


Current Status and Main Scientific Outcomes of the CSES Mission
doi: 10.11728/cjss2022.04.yg06 cstr: 32142.14.cjss2022.04.yg06
-
Abstract: This report briefly introduces the current status of the CSES (China Seismo-Electromagnetic Satellite) mission which includes the first satellite CSES 01 in-orbit (launched in February 2018), and the second satellite CSES 02 (will be launched in 2023) under development. The CSES 01 has been steadily operating in orbit for over four years, providing abundant global geophysical field data, including the background geomagnetic field, the electromagnetic field and wave, the plasma (in-situ and profile data), and the energetic particles in the ionosphere. The CSES 01 platform and the scientific instruments generally perform well. The data validation and calibration are vital for CSES 01, for it aims to monitor earthquakes by extracting the very weak seismic precursors from a relatively disturbing space electromagnetic environment. For this purpose, we are paying specific efforts to validate data quality comprehensively. From the CSES 01 observations, we have obtained many scientific results on the ionosphere electromagnetic environment, the seismo-ionospheric disturbance phenomena, the space weather process, and the Lithosphere-Atmosphere-Ionosphere coupling mechanism.
-

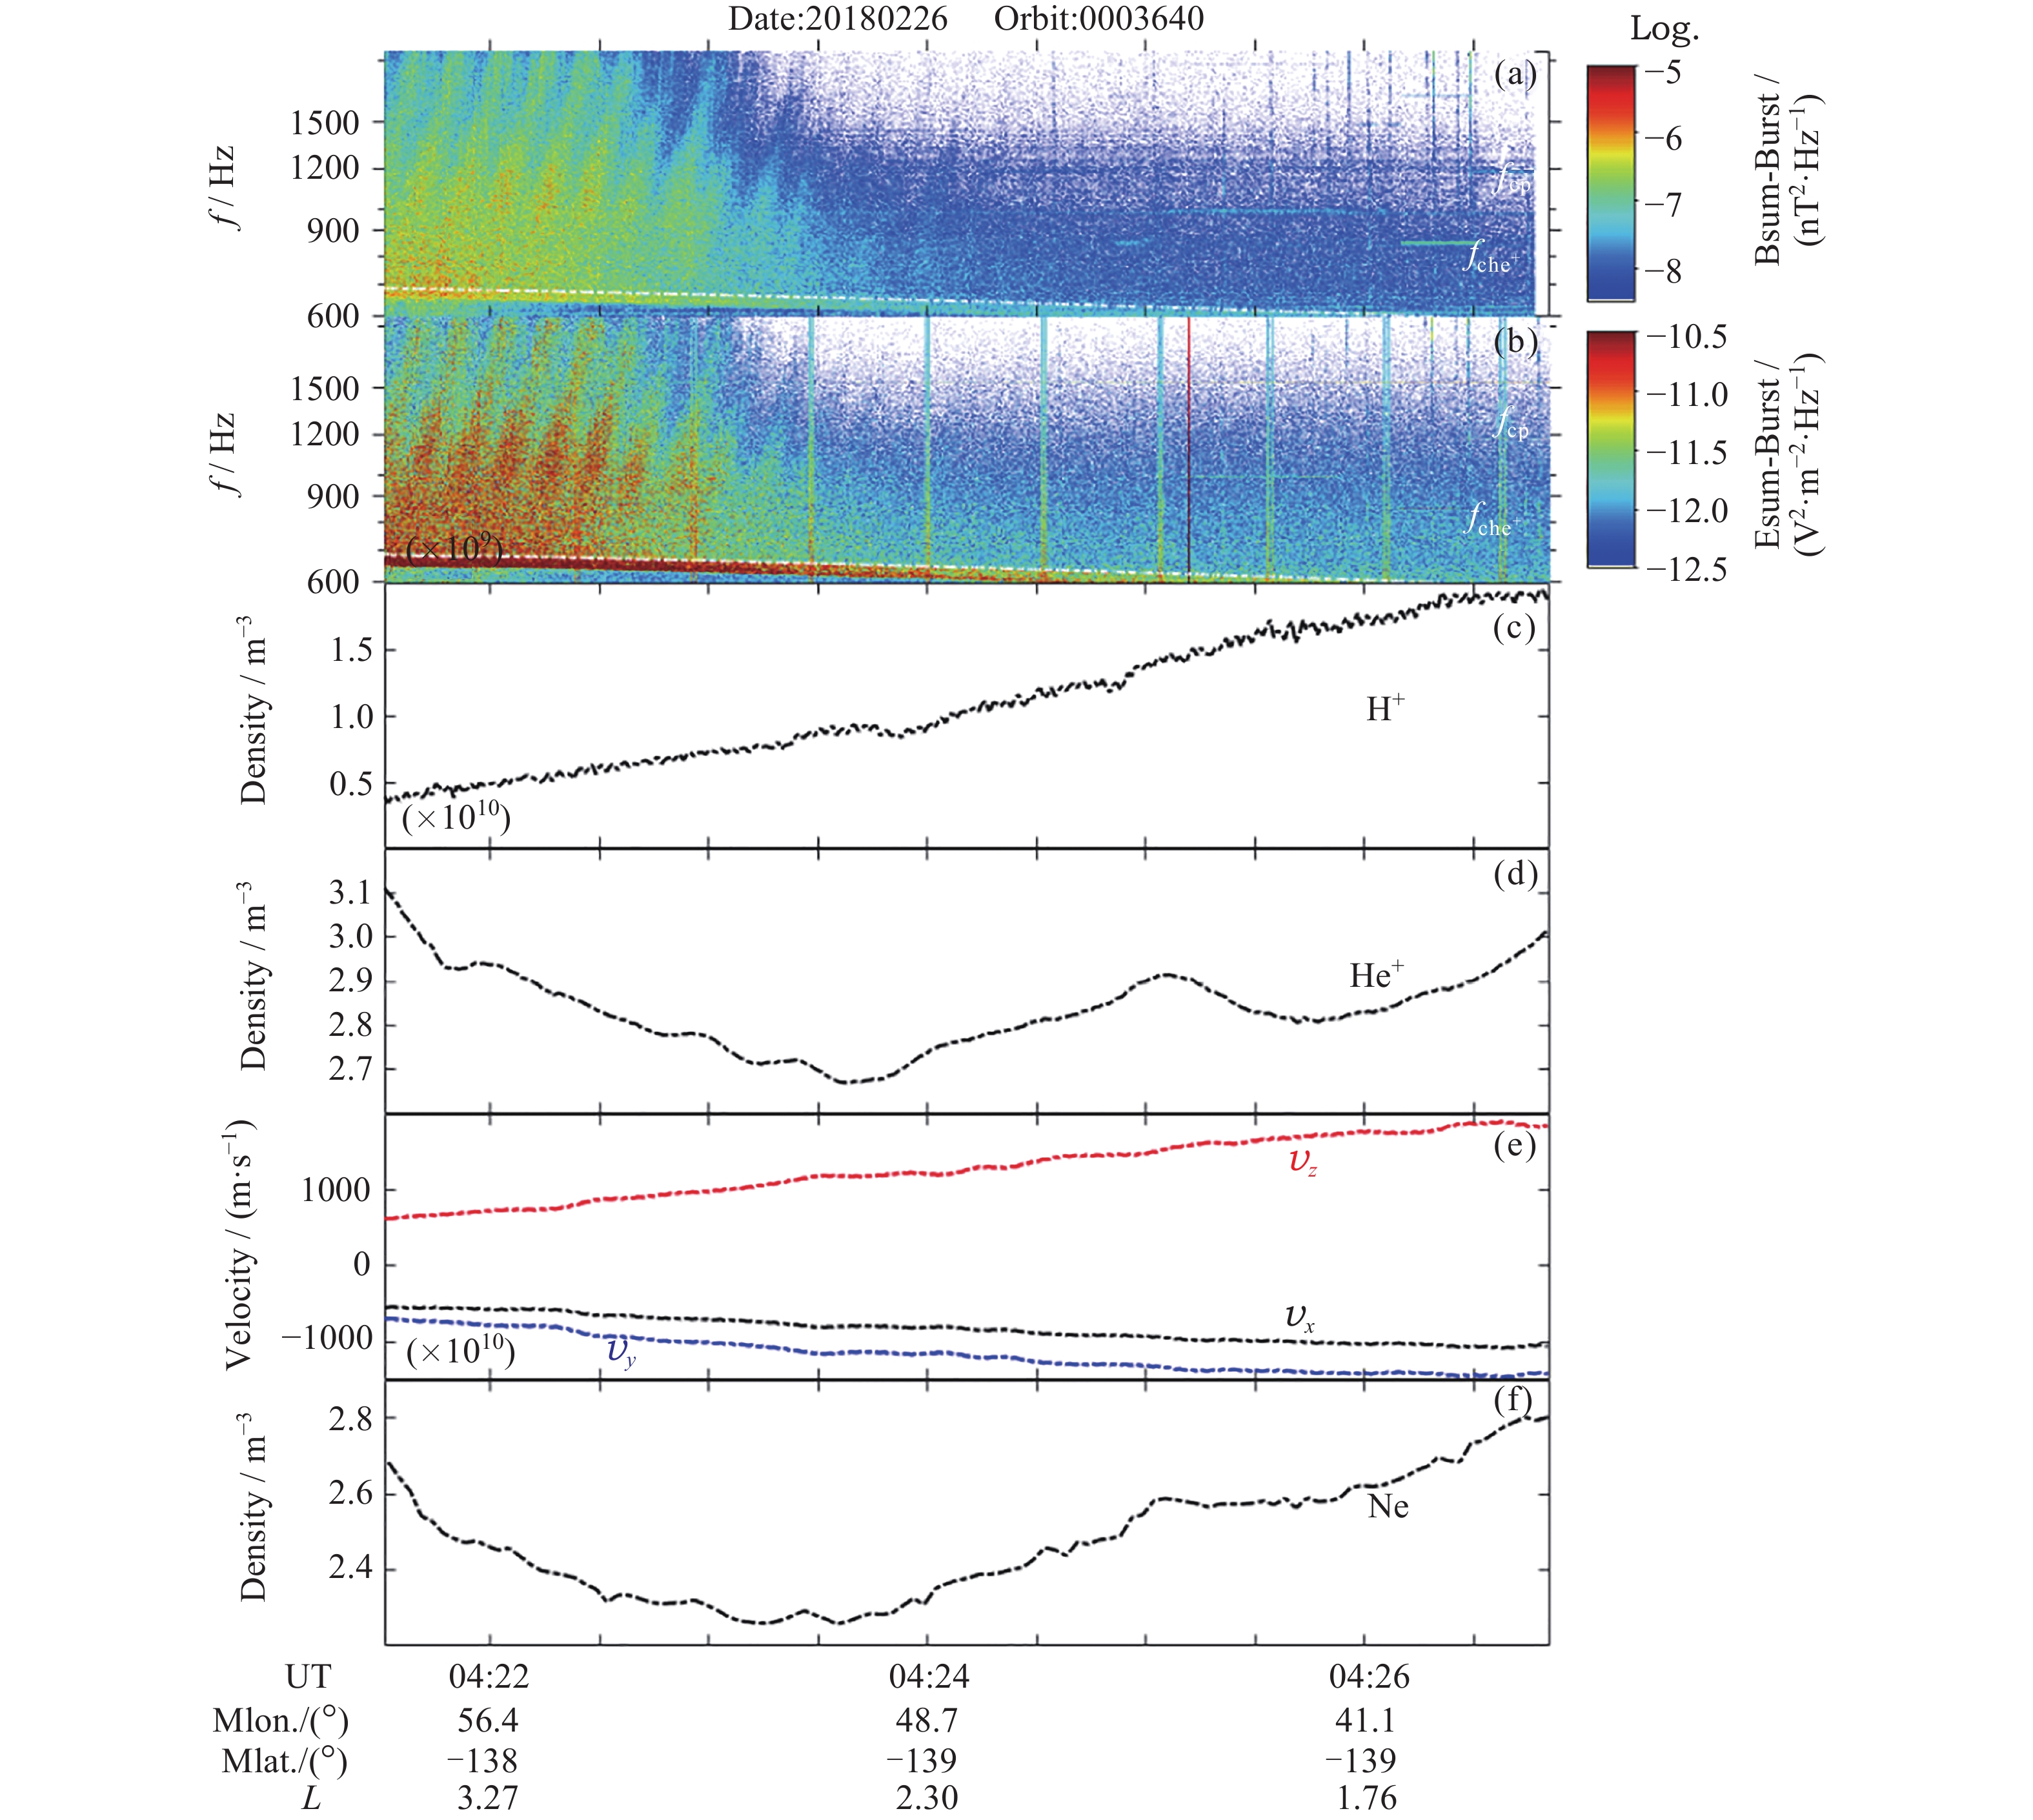
Figure 2. ELF/VLF QP waves recorded by CSES satellite in the high-latitude upper ionosphere on 26 February 2018. (a)(b) Power Spectral Density values (PSD) of the magnetic field and the electric field. (c)(d) Density of H+ and He +. (e) Drifting velocity of ions. (f) Density of electron. Data are displayed as a function of Universal Time (UT), geomagnetic longitude (mlon), geomagnetic latitude (mlat) and L shell, respectively
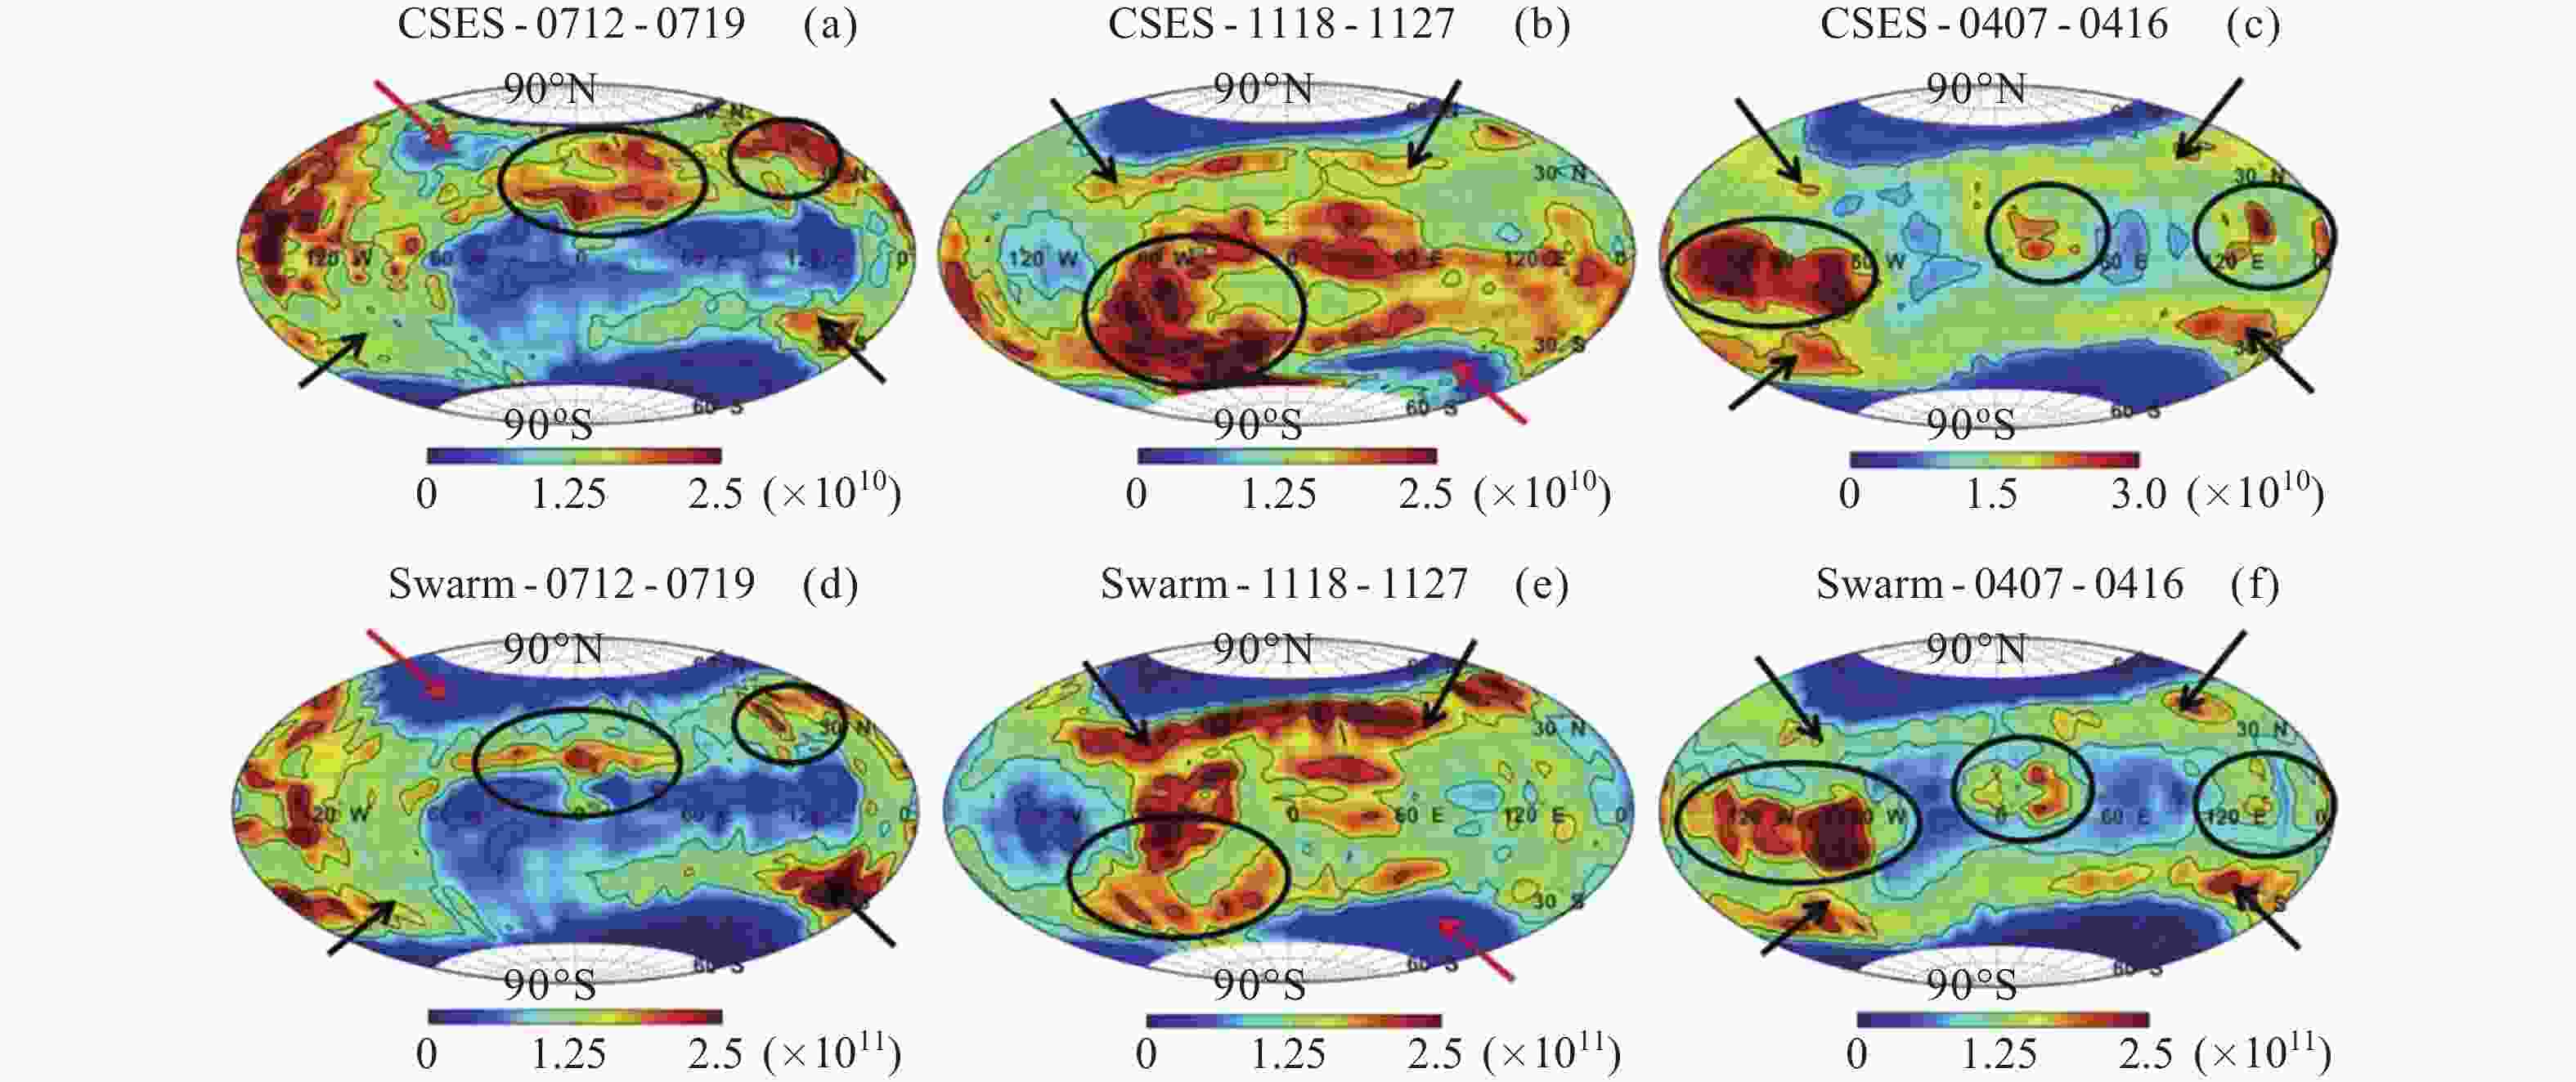
Figure 3. Global distributions of Ne at 02:00 LT of CSES (up panels) and Swarm (bottom panels) under the quiet geomagnetic conditions. From left to right: Ne measurements during 12–19 July 2018, 18–27 November 2018, and 7–16 April 2019, corresponding to roughly at the summer solstice, winter solstice, and spring equinox, respectively. For CSES observations, Ne value range from 0 to 2.5×10¹⁰ or 3×10¹⁰ m–3, while for Swarm one, Ne is mainly from 0 to 2.5×10¹¹ m–3
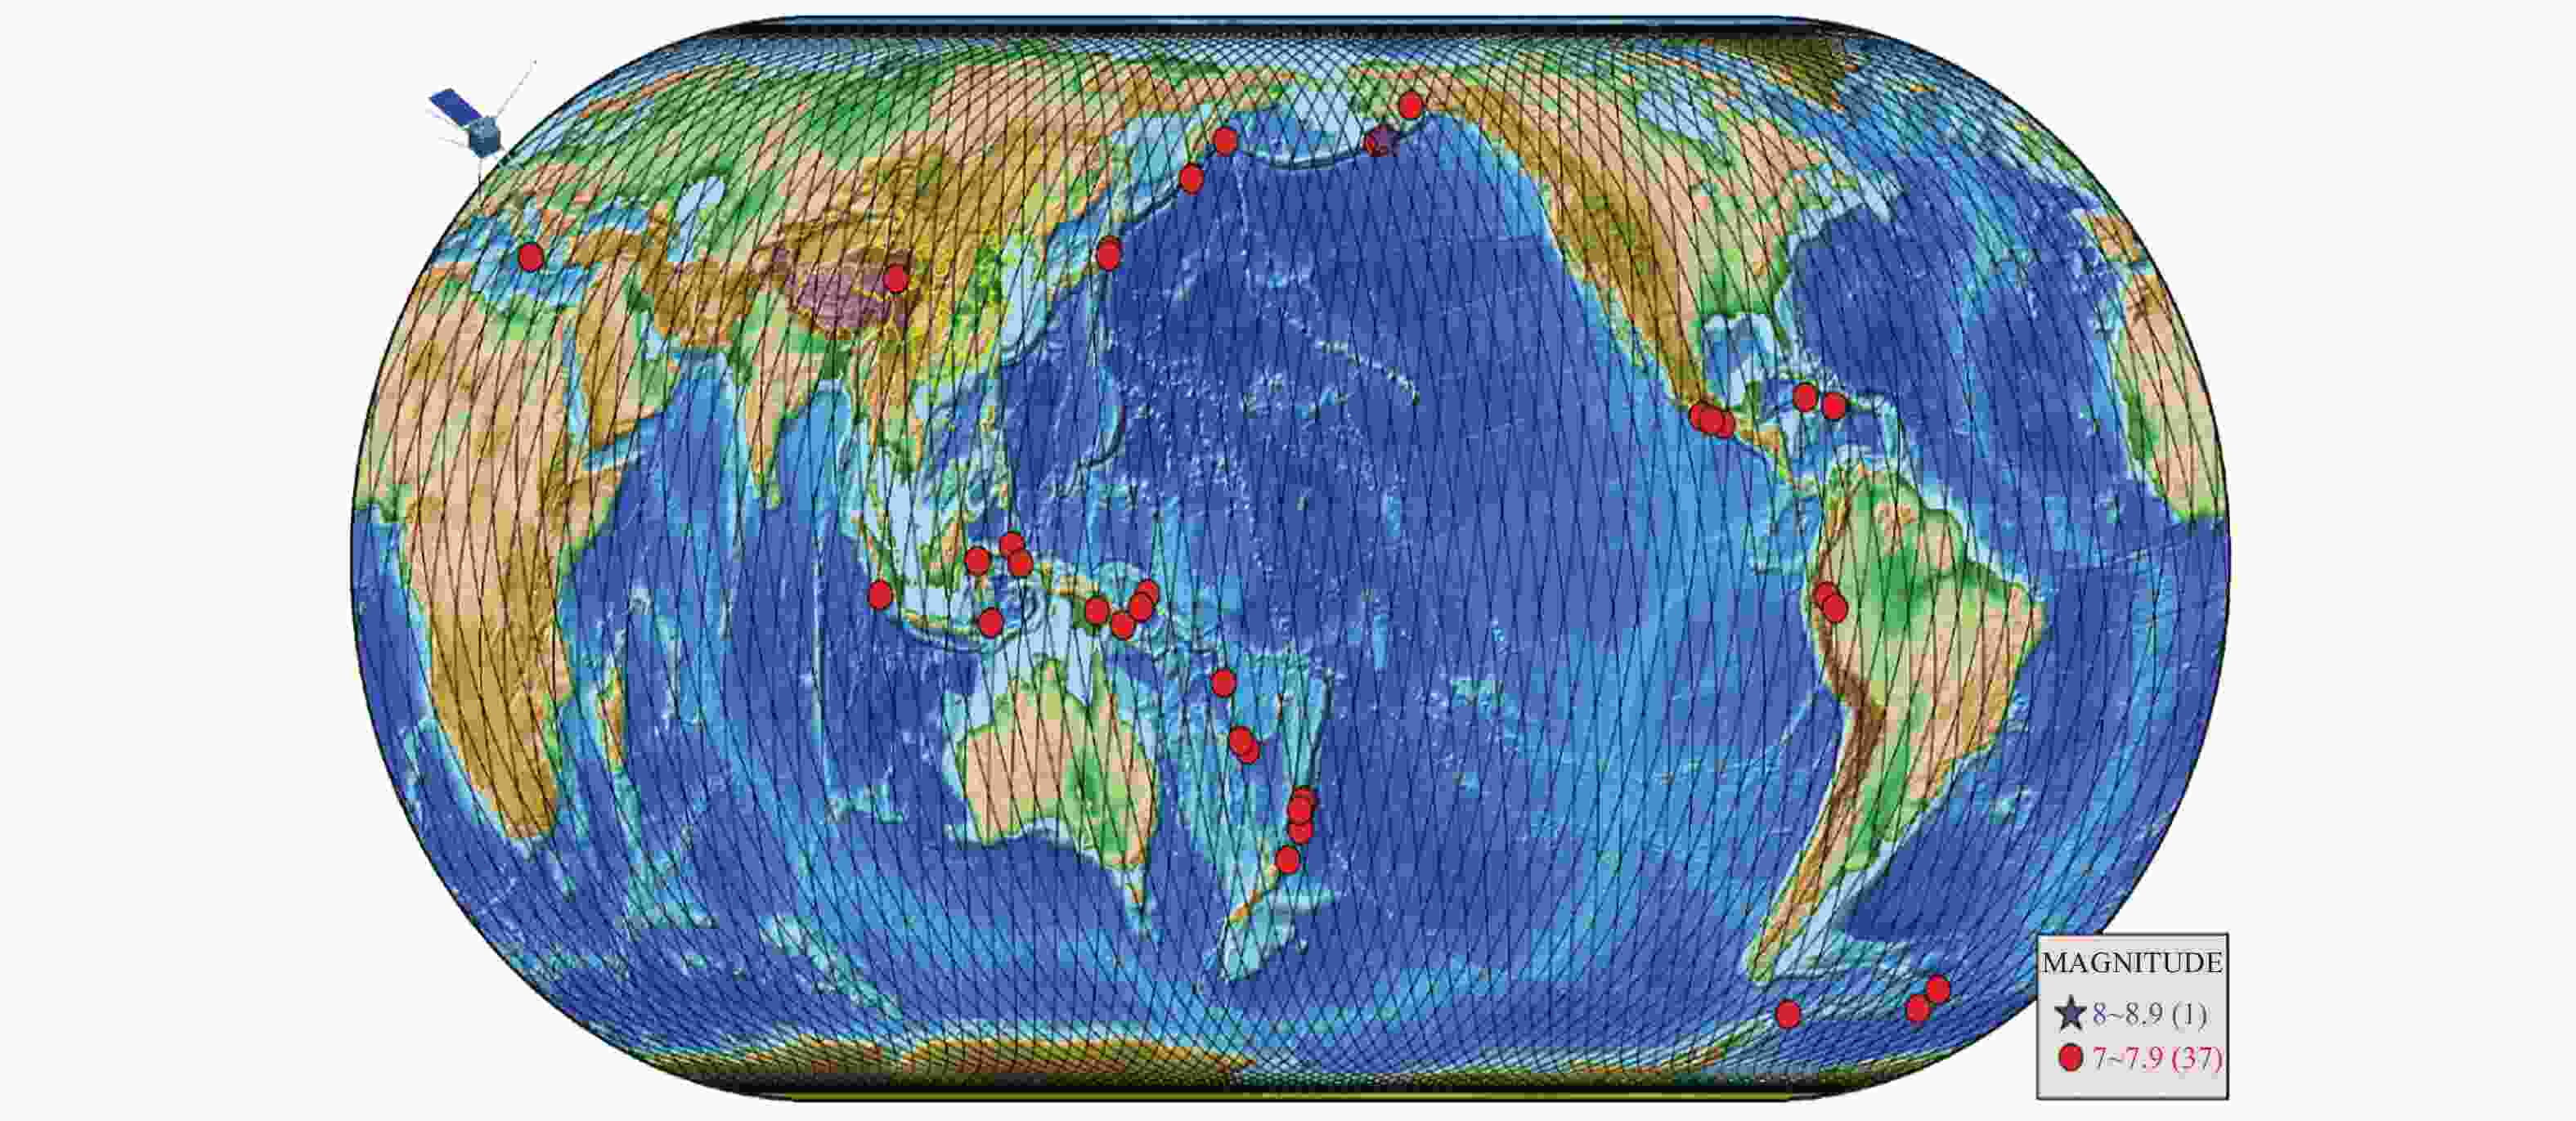
Figure 4. Global earthquake activity occurred after the launch of CSES from February 2018 to 1 December 2021. The overlapped black lines are the orbit trajectories of the CSES
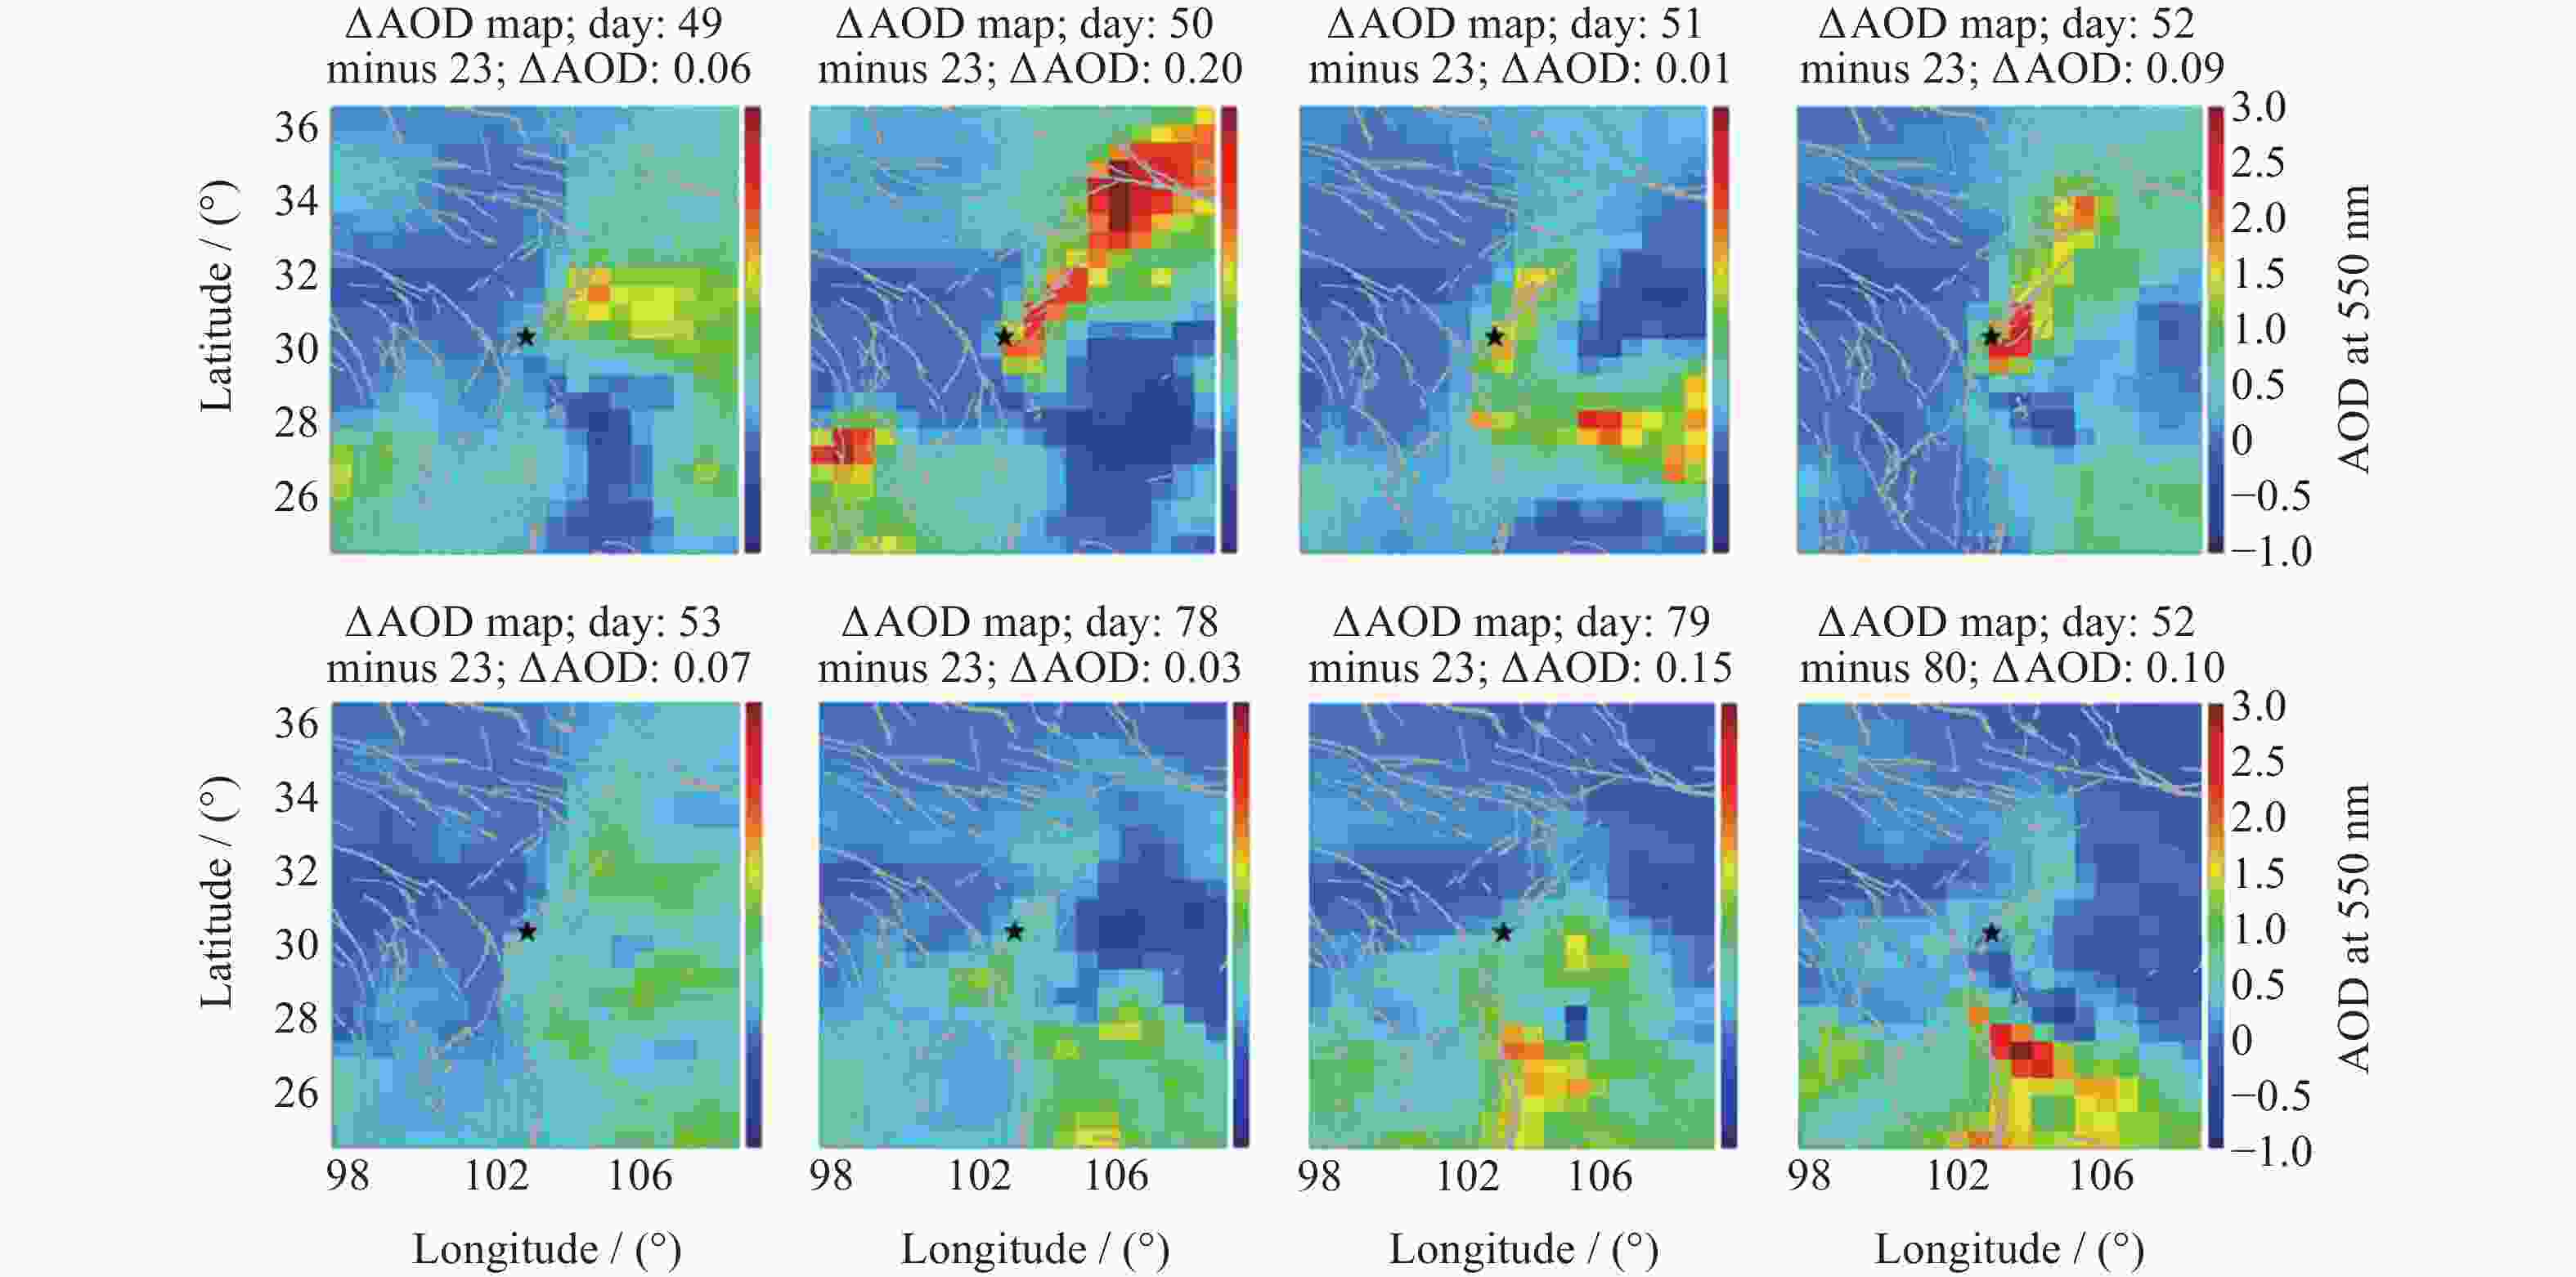
Figure 5. MERRA-2 AOD at 18:00 UTC 2013 in the region of EQ epicenter (indicated by a star in the maps). Grey lines indicate main seismic faults in the research area; on the 49–53th, 78–80th days, respectively, with the value on 23th (20 February 2013) subtracted. Latitude (North) and longitude (East) are in degrees
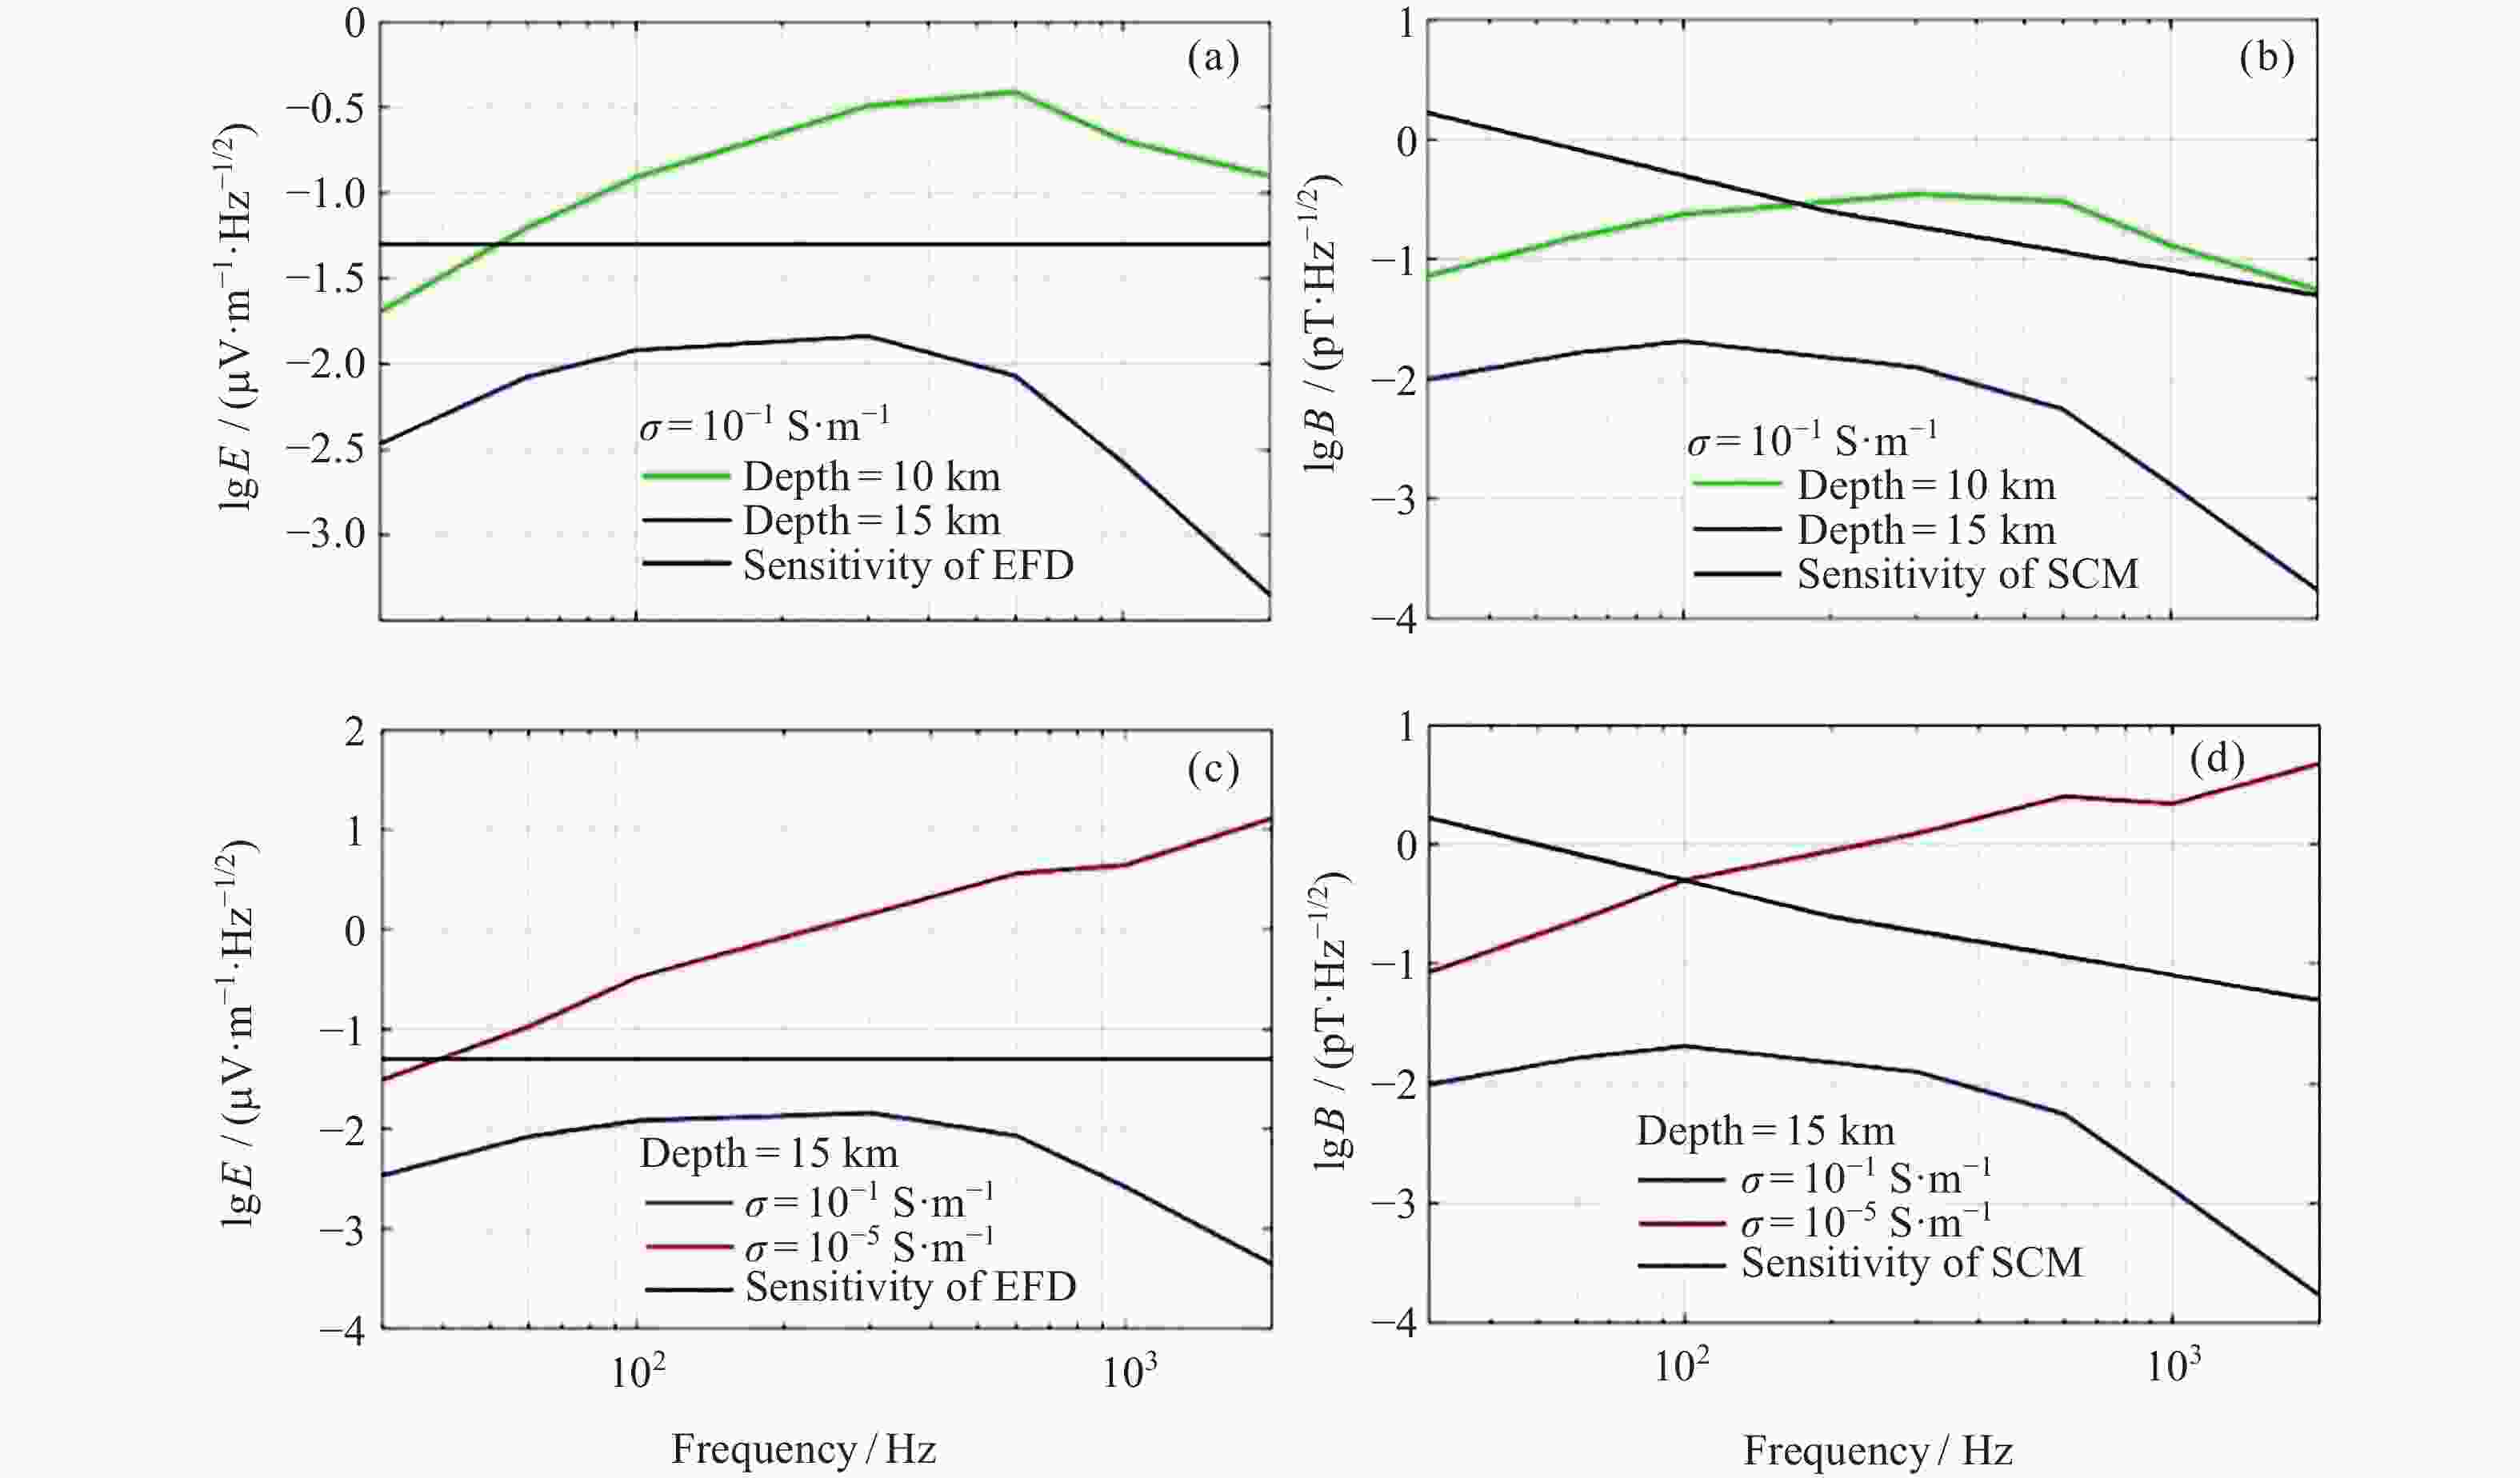
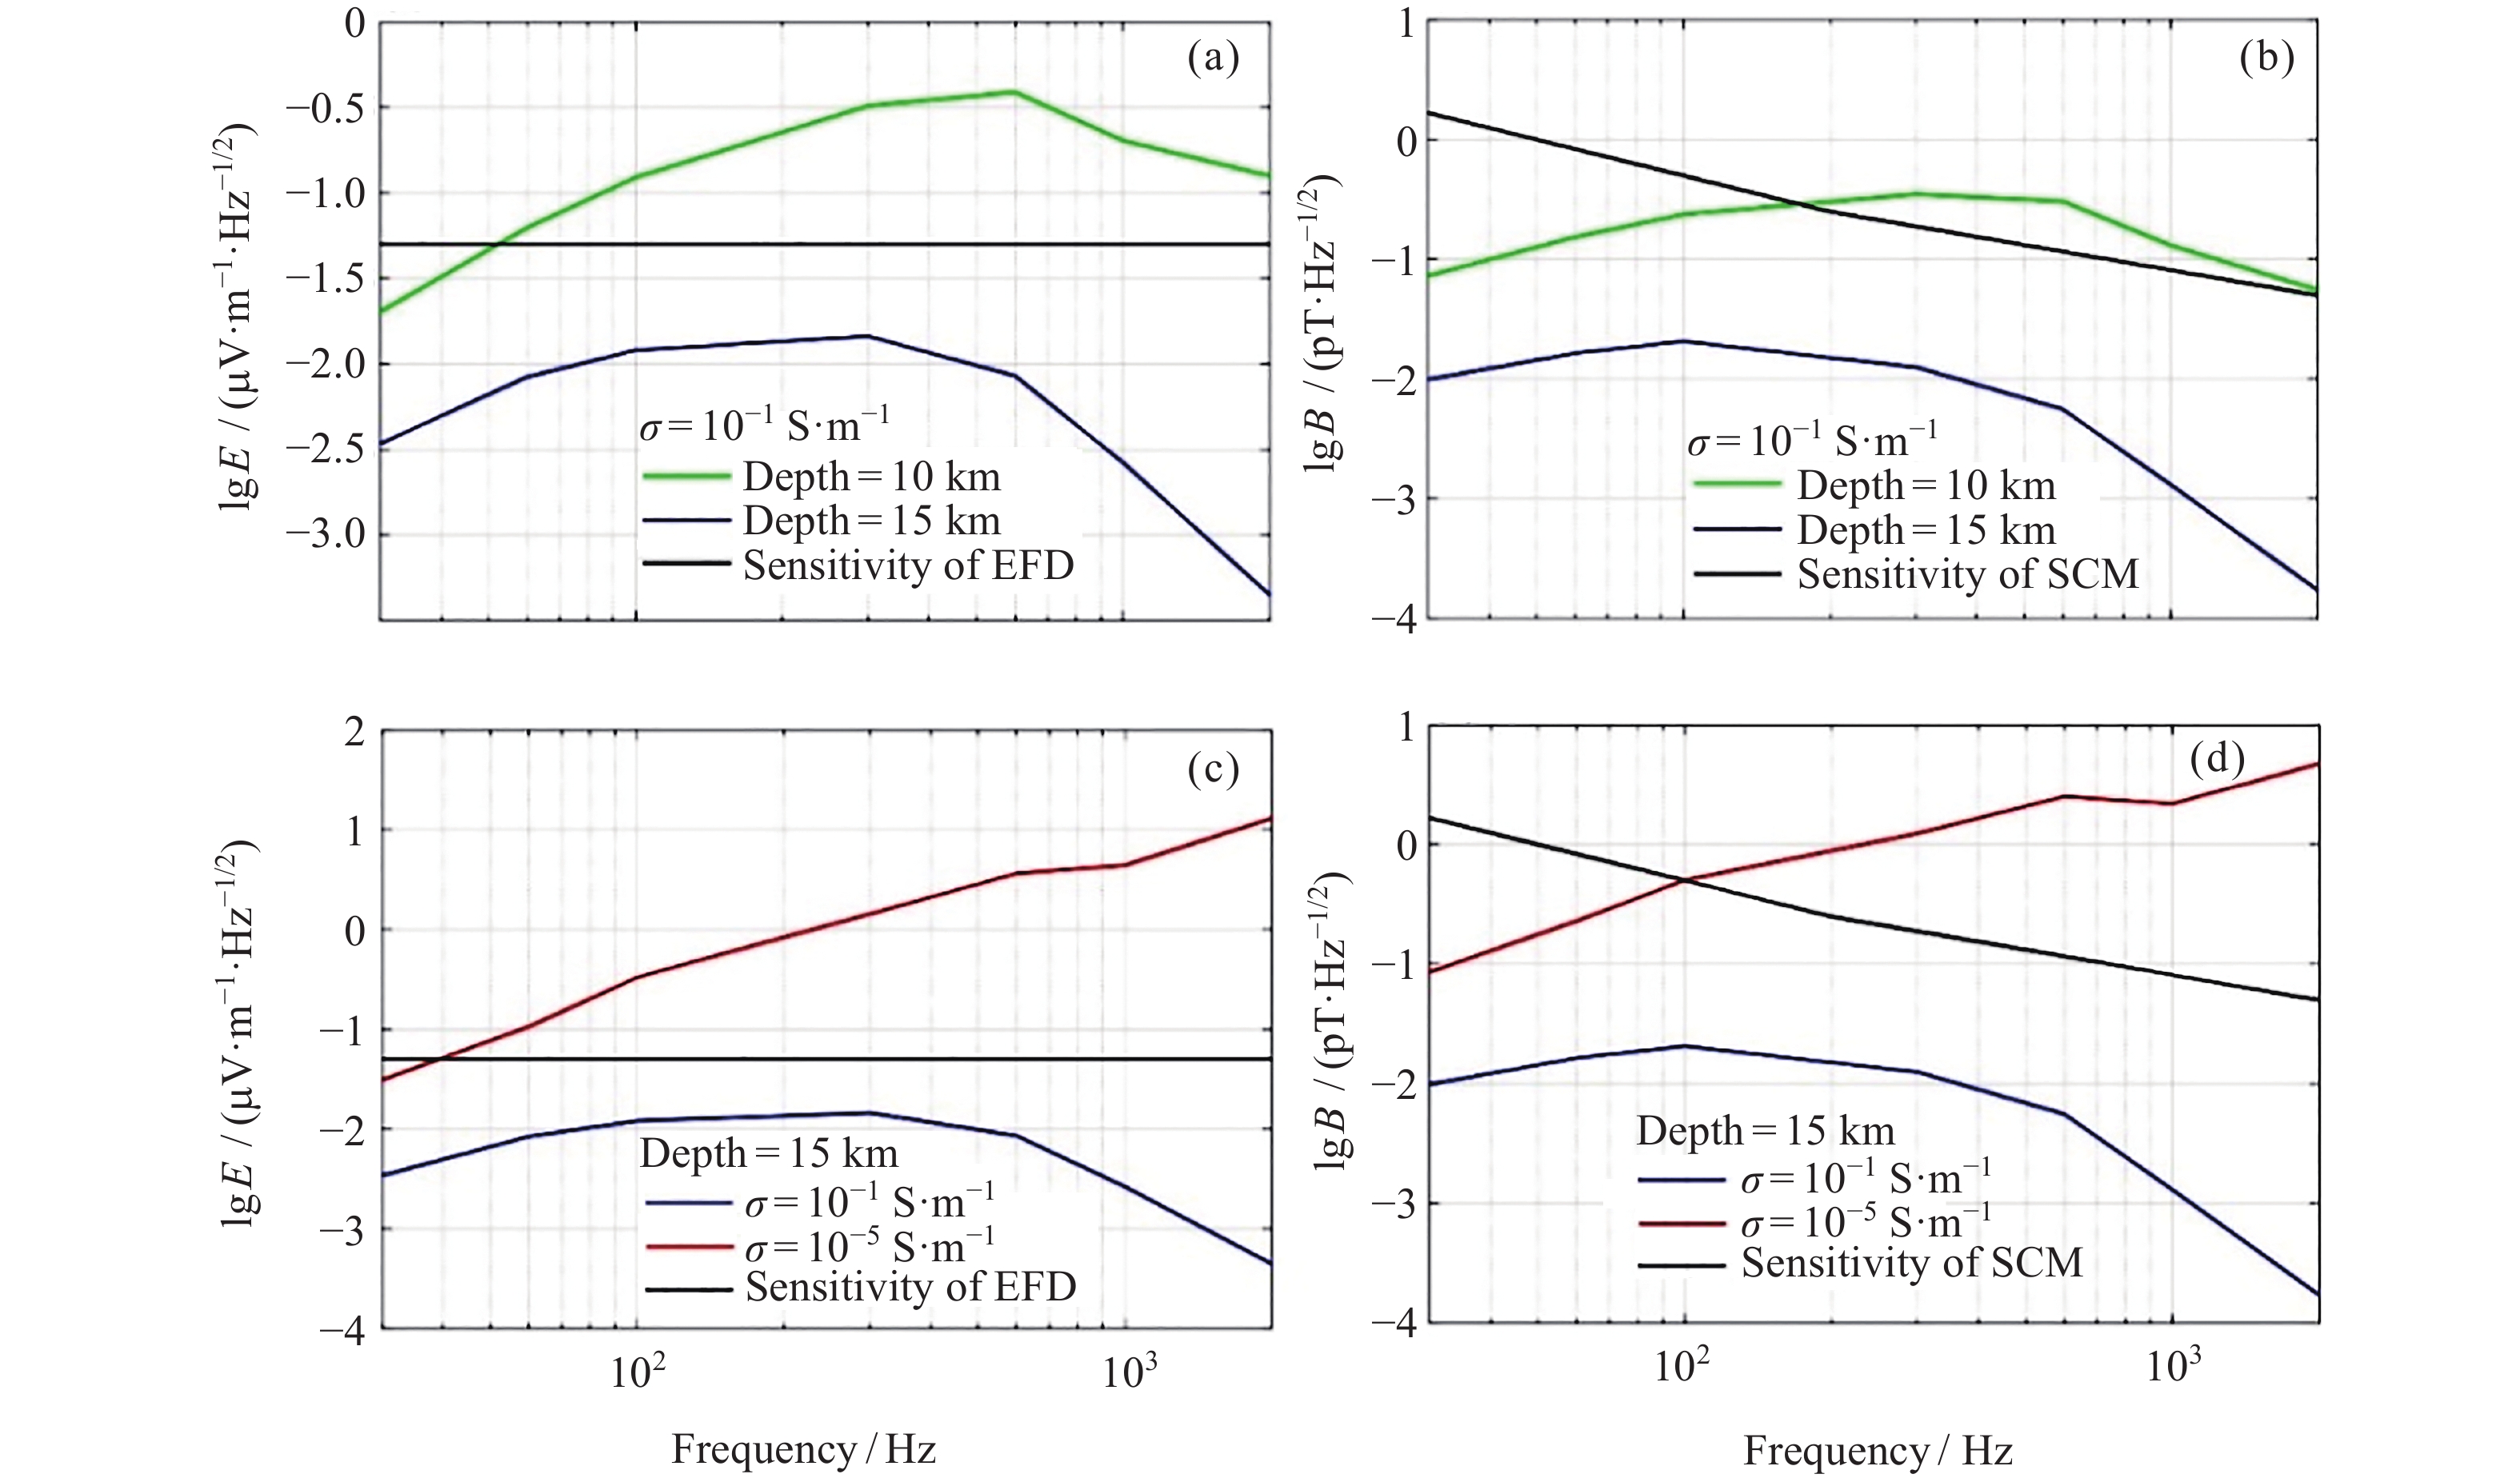
Figure 6. (a)(b) is a comparison between a simulated EM field at CSES altitude from an M6 earthquake with different source depths and sensitivity of CSES EM sensors (10 km, 15 km; lithospheric conductivity is 10–4 S·m–1); (c)(d) is comparison under different lithospheric conductivity and sensitivity of CSES EM sensors (source depth is 15 km; lithospheric conductivity is 10–4 S·m–1 and 10–5 S·m–1)
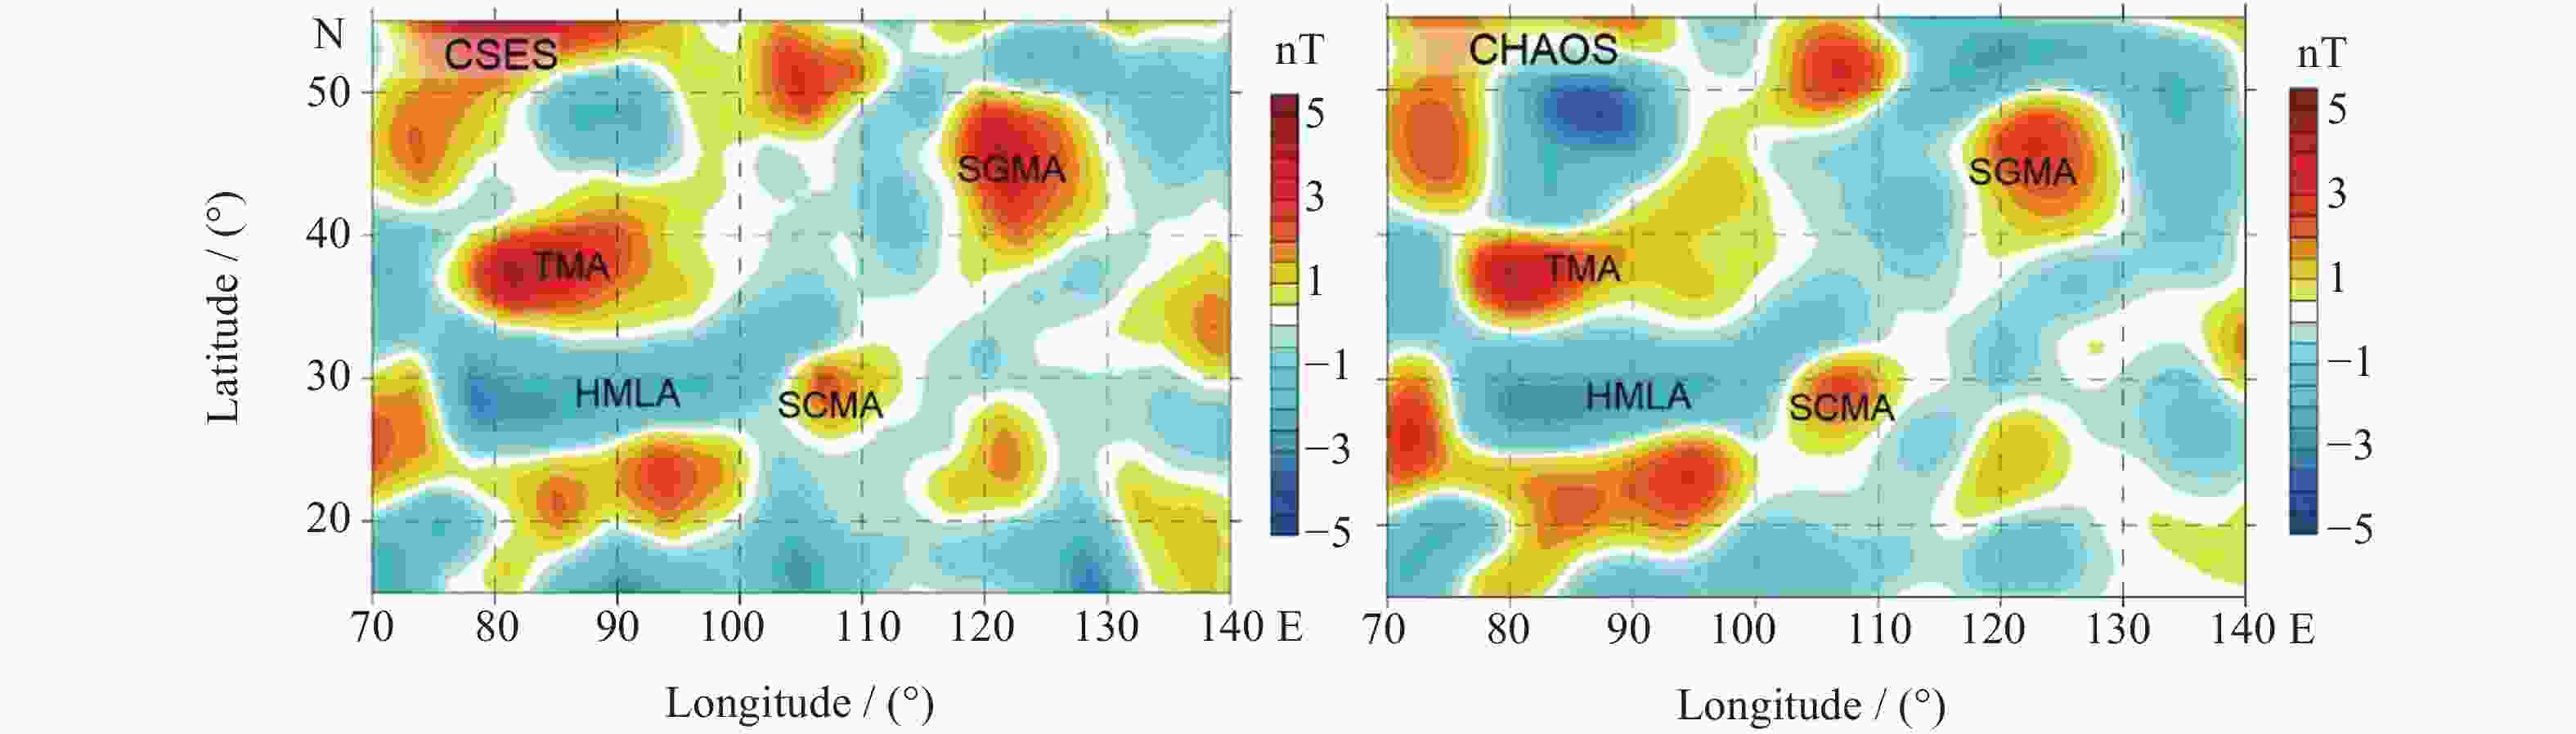
Figure 7. Lithospheric magnetic anomaly map over China and surrounding regions at average 507 km altitude (a) derived from CSES data and (b) given by the CHAOS-7 model. Abbreviations: TMA, Tarim magnetic high anomaly; SCMA, Sichuan magnetic high anomaly; SGMA, Songliao-Greater Khingan magnetic high anomaly; HMLA, Himalayan-Tibetan magnetic low anomaly

Figure 8. Dayside plasma and electric field observations during 5–6 August (black curves) and 25–26 August (red curves)
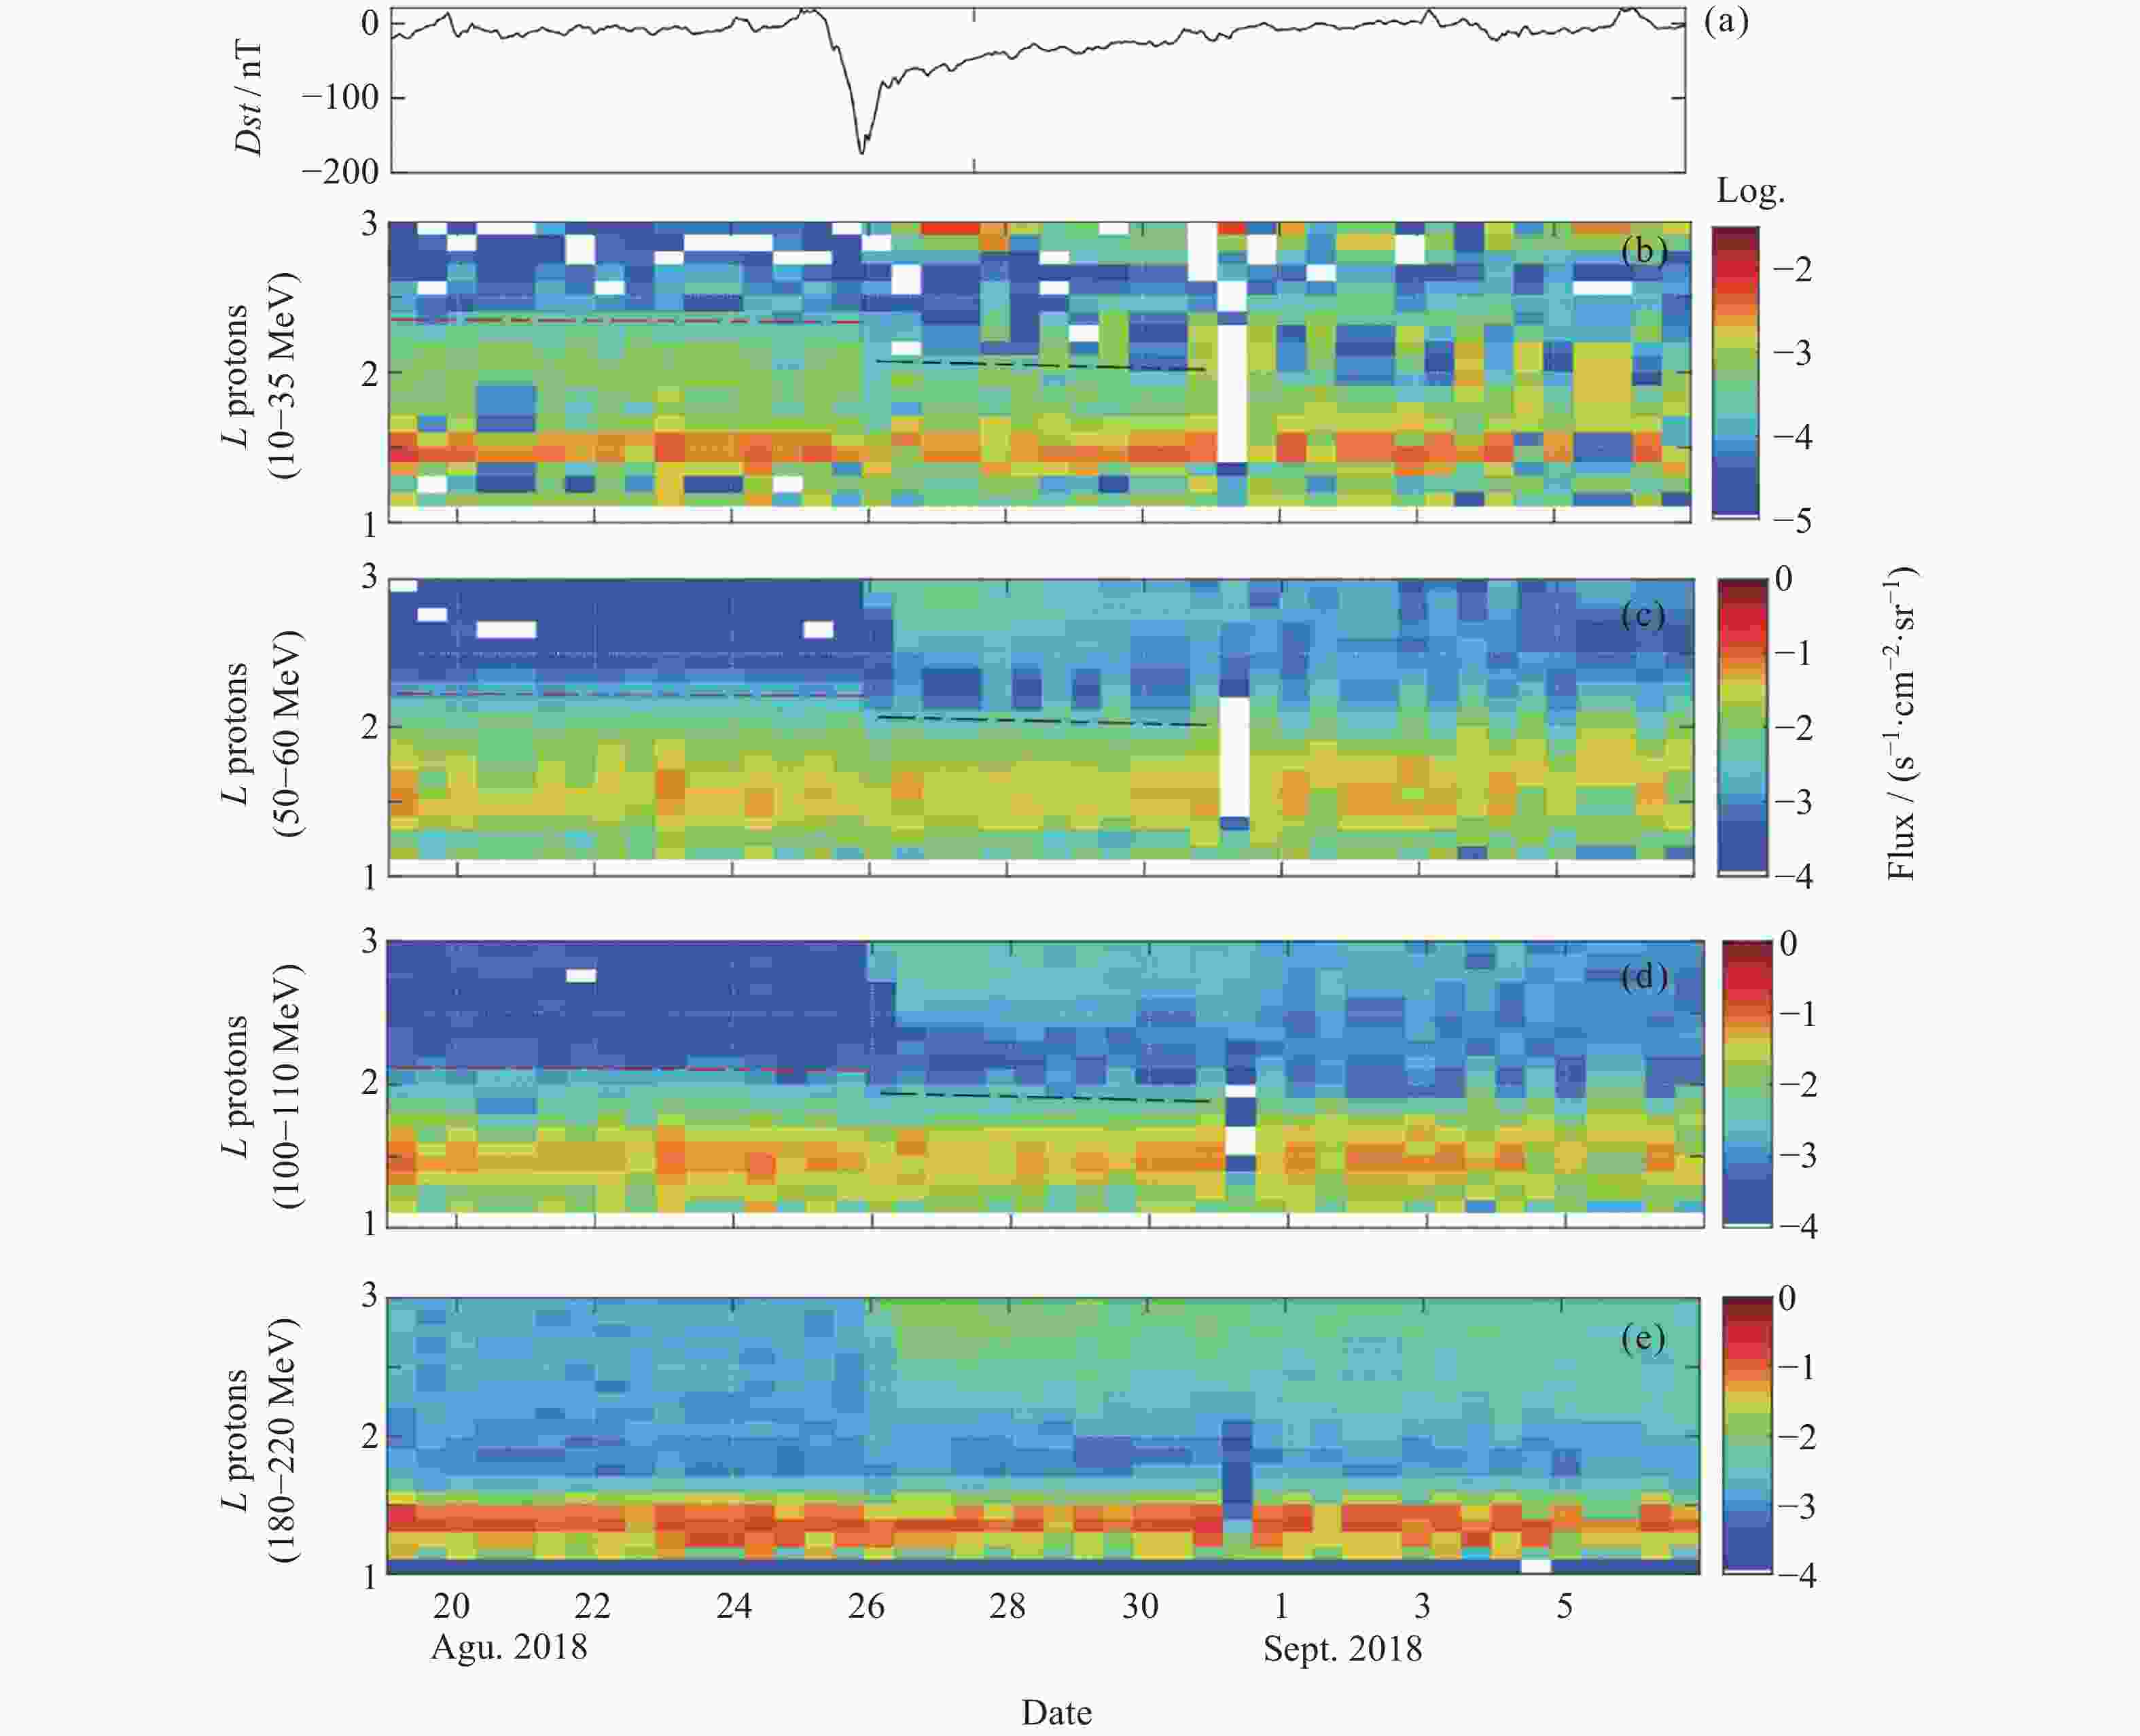
Figure 9. Proton evolution during the large magnetic storm of August 2018 observed by HEPP-H onboard CSES satellite. The outer boundary of the inner radiation belt are denoted by red dotted lines before 26 August (quiet time) and black dotted lines after 26 August (storm time). The flux enhancement within the region of L > 2.5 appearing from 26 August could come from the high-energy electron contamination
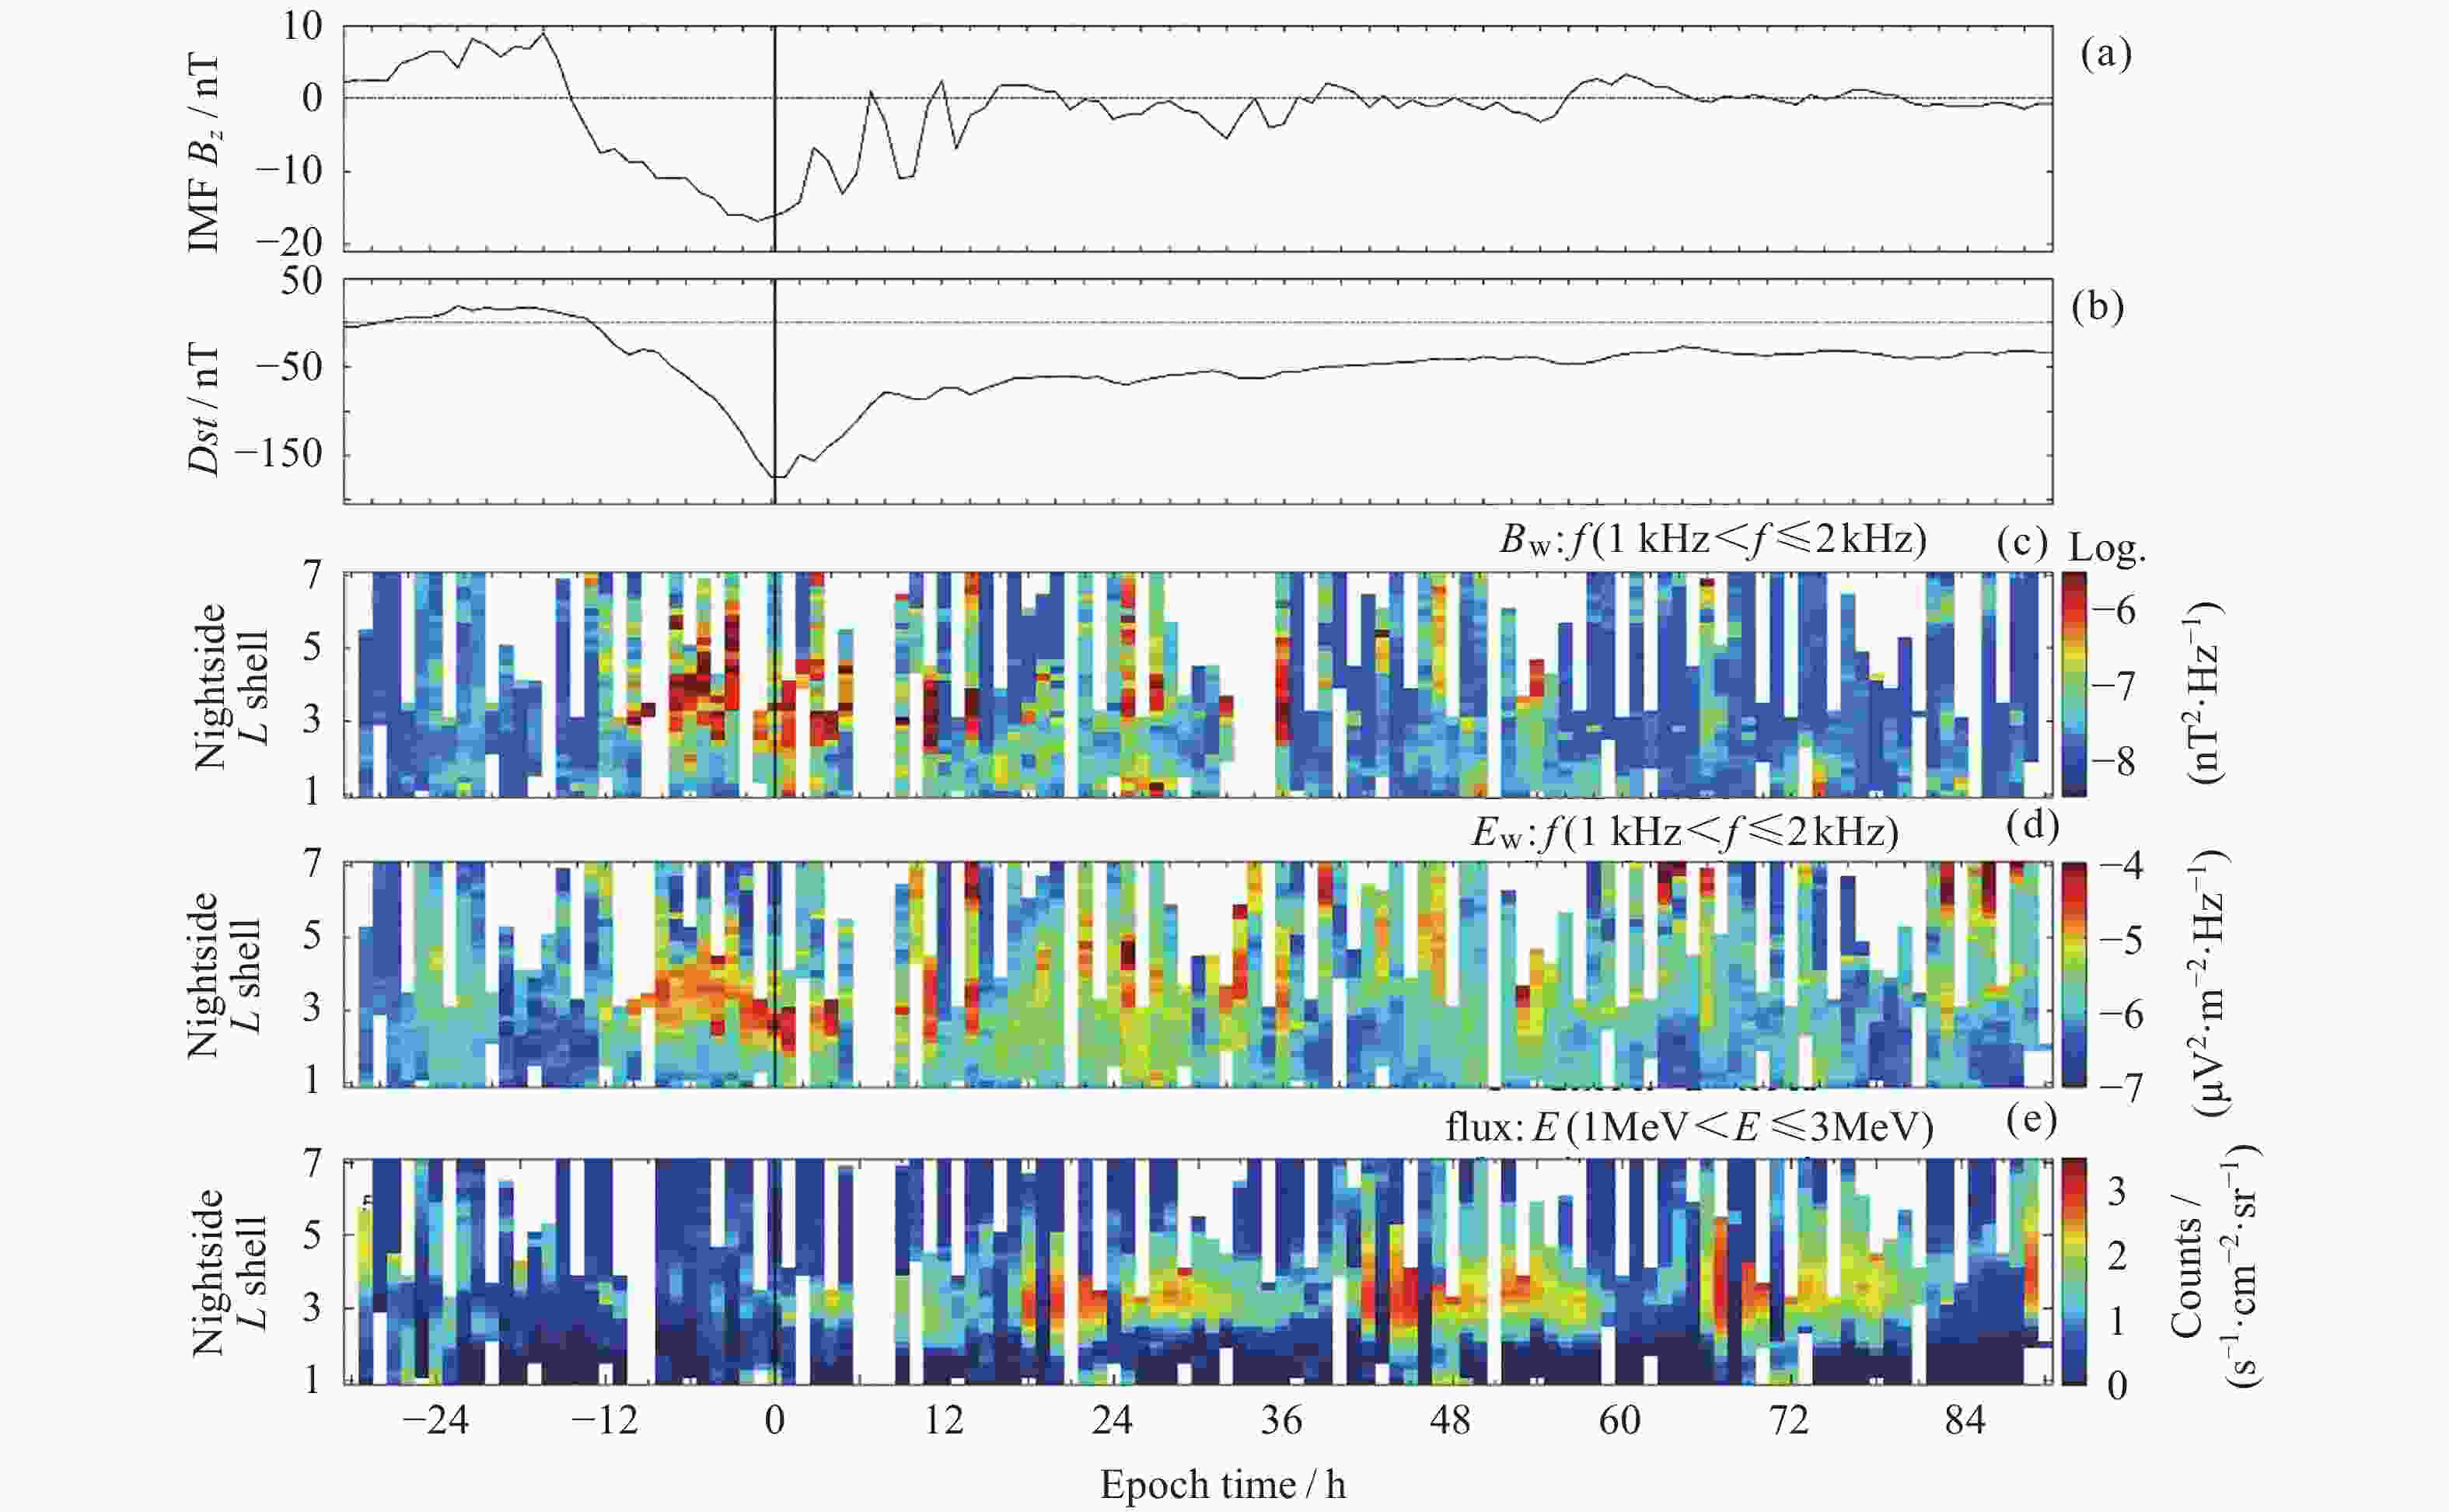
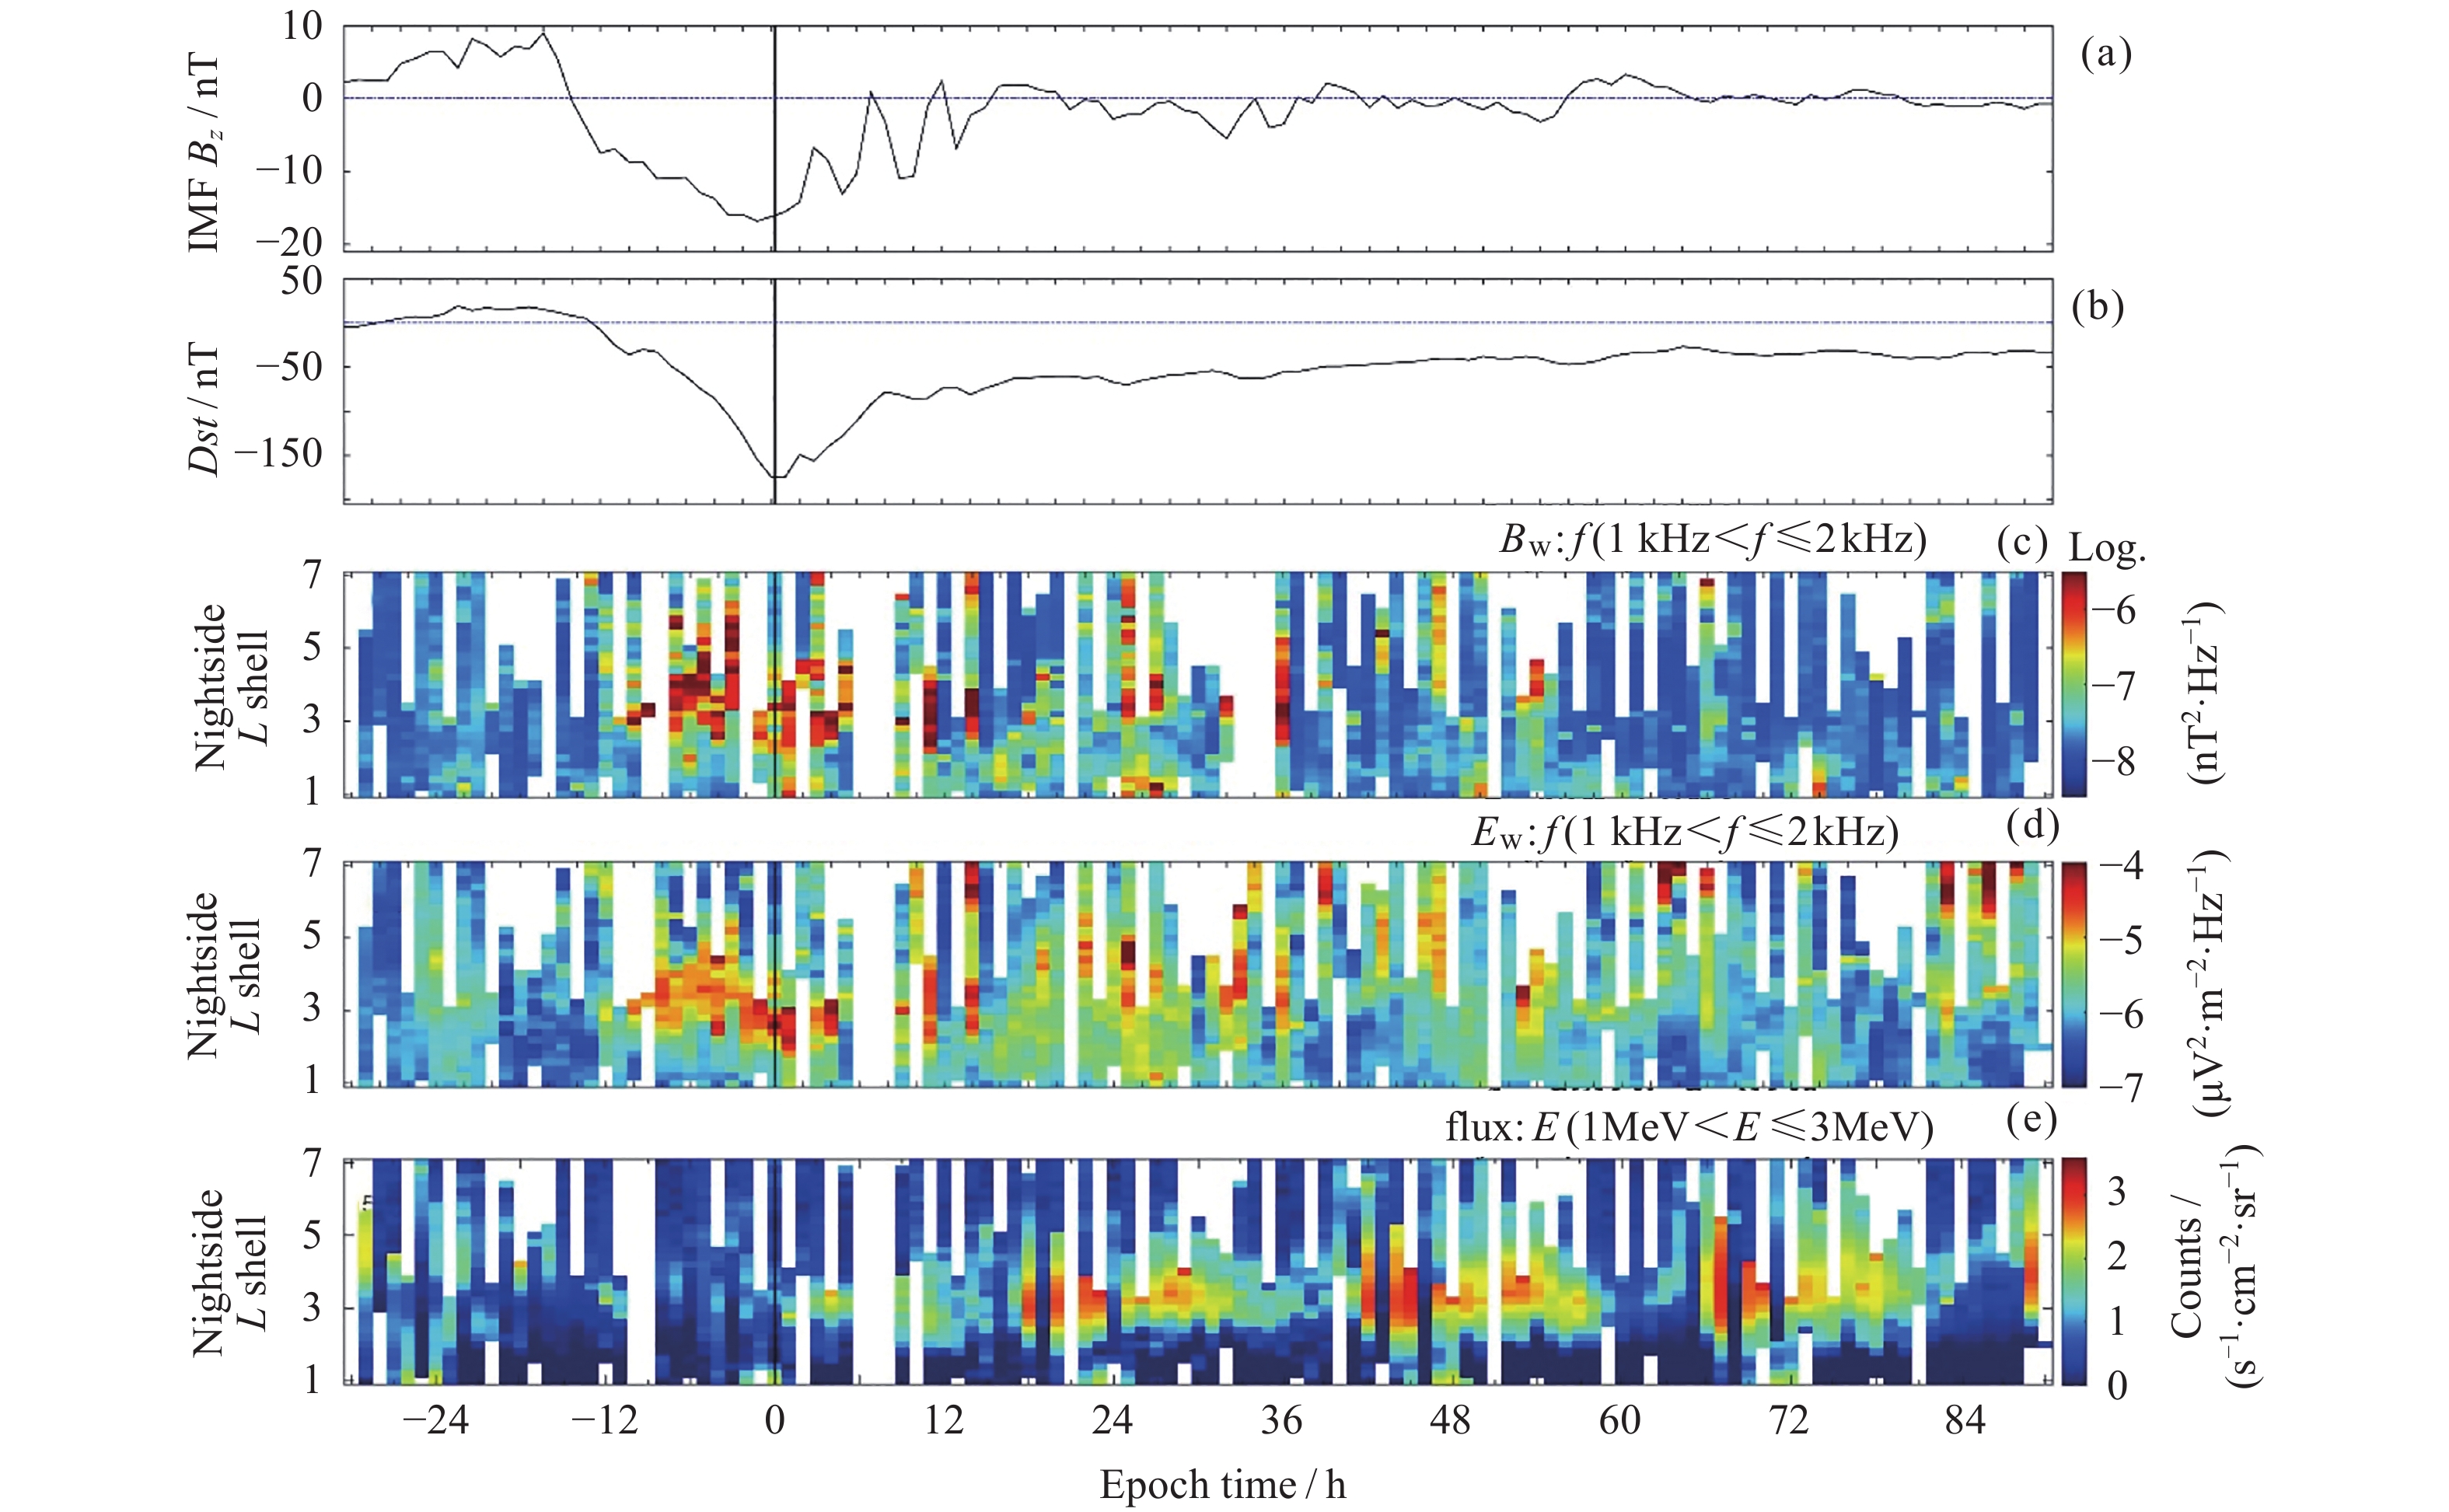
Figure 10. Variation of ionospheric wave intensity and energetic flux during the geomagnetic storm occurred in 2018
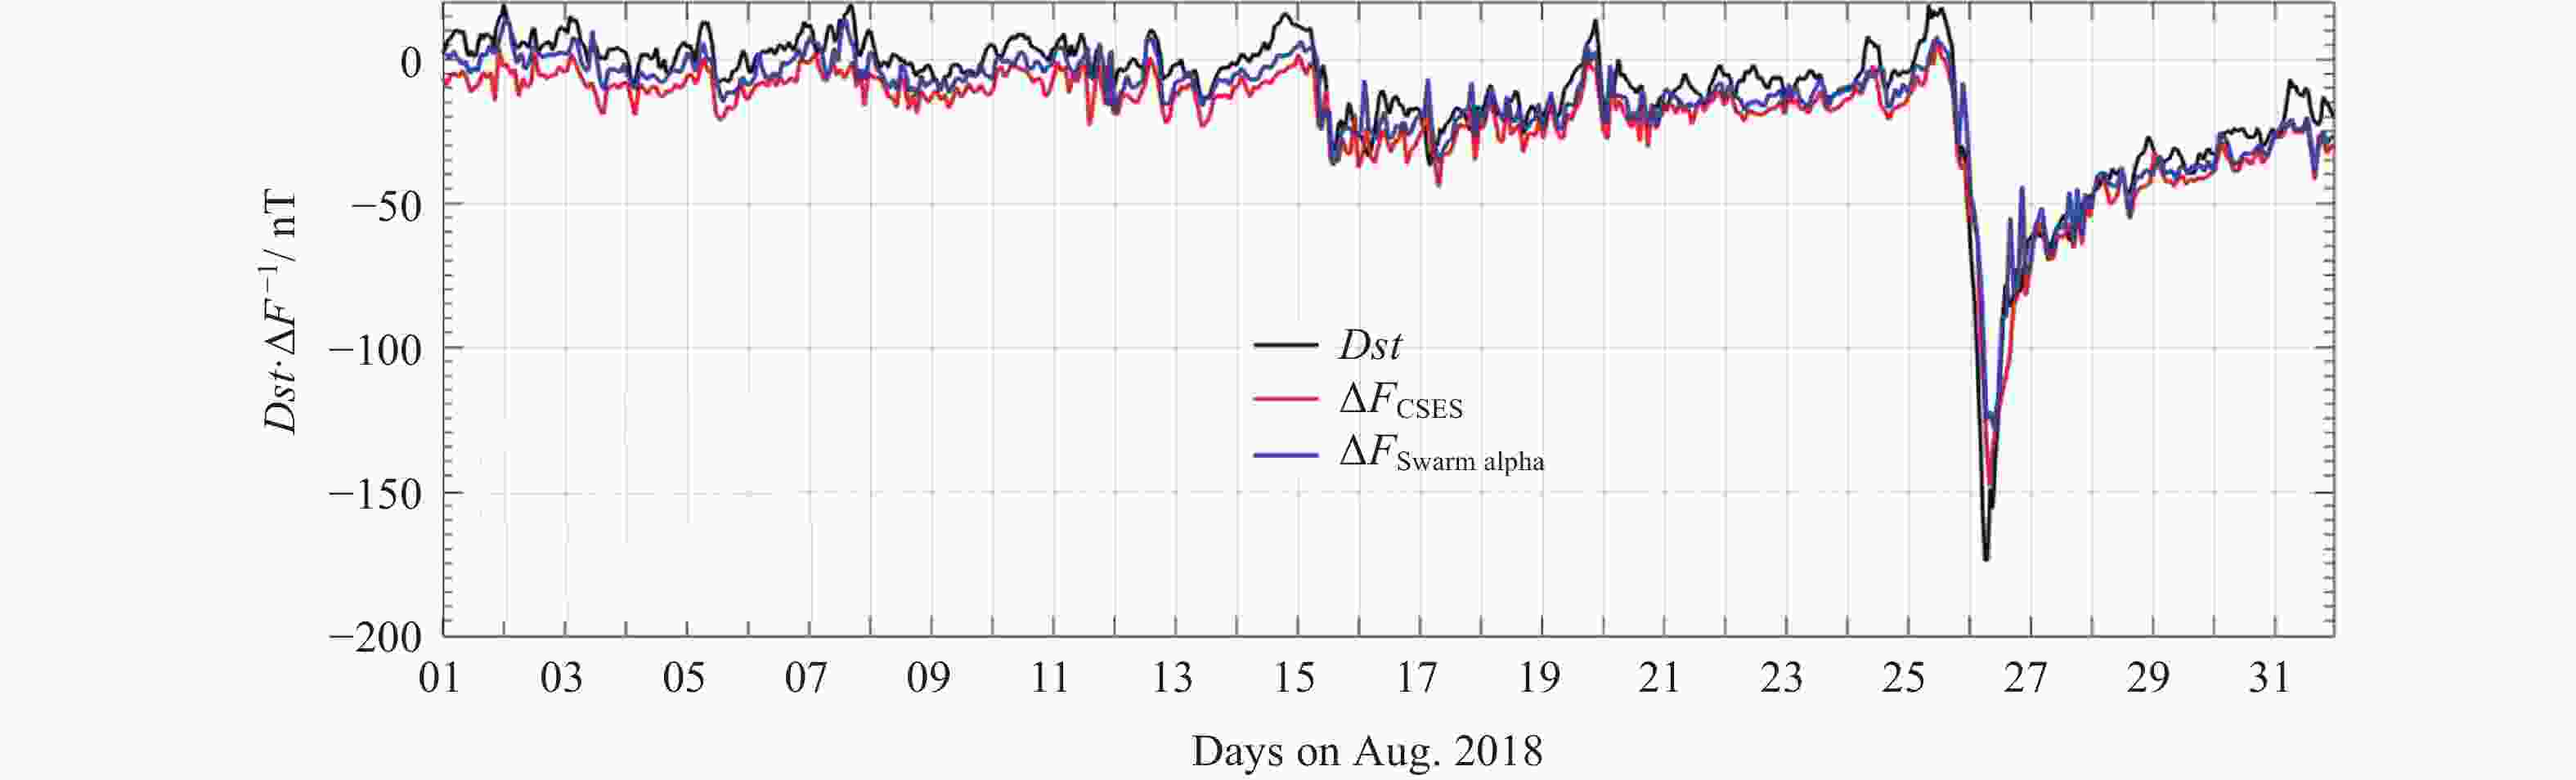
Figure 11. Dst index determined by ground observatory data (black) and the satellite-derived equivalent from CSES (red) and Swarm alpha (blue) magnetic data between 1 and 31 August 2018
Table 1. Possible seismo-ionospheric disturbances recorded by the CSES during the shallow strong EQs
No. Place UTC Lat./
(º)Long./
(º)Magn./
MDepth/
kmPossible seismo-
ionospheric perturbation1 Mexico 16 Feb. 2018 23:39:38 16.6 –97.75 7.1 10 The abnormal emissions in frequency 155.5 Hz and 1.405 kHz.
The electron density and ion (O+) density increased two days before the mainshock2 Papua New Guinea 25 Feb. 2018 17:44:42 –6.19 142.77 7.5 20 The magnetic field enhancement in the frequency 155 Hz nearest the epicenter 7 and 3 days before the mainshock.
The electron/ion disturbed 7, 6, 5, and 2 days before mainshock3 Loyalty Islands Region 29 Aug. 2018 03:51:54 –21.95 170.1 7.1 20 The electron density increased; the PSD values of the electromagnetic field in ELF frequency increase; the energetic particle flux in the 0.1–3 MeV increased during the mainshock 4 Indonesia 28 Sept. 2018 10:02:44 –0.25 119.9 7.4 10 The electron density significantly increased on 12 and 2 days before the mainshock 5 Papua New Guinea 10 Oct. 2018 20:48:18 –5.70 151.25 7.1 20 The abnormal emissions in ULF/ELF/VLF frequency 9 and 4 days before the mainshock.
The electron density, and energetic particle flux were disturbed 5,and 2 days before and on the mainshock day6 Kmadek islands, New Zealand 15 Jun. 2019 22:55:00 –30.80 –178.10 7.2 20 The in-situ and occultation electron density abnormally increased within one week before the mainshock 7 Southern waters
of Cuba28 Jan. 2020 19:10:22 19.46 –78.79 7.7 10 The electron density increased over the conjugate area on January 27 and the epicenter area on January 28 8 Mexico 23 Jun. 2020 15:29:04 16.14 –95.75 7.4 10 The electron density got disturbed 3 days before the mainshock 9 Sumatra island, Indonesia 18 Aug. 2020 22:29:21 –4.31 101.15 7.0 10 The electron density significantly increased 10 days before the mainshock 10 Maduo County, Qinghai, China 21 May. 2021 18:04:11 34.59 98.34 7.4 17 The electron density, and the electromagnetic field in ULF/ELF band observed simultaneous increases 8 days before the mainshock.
The energetic electron in the energy level 0.1 to 3 MeV increased 7 days and 6 days before the mainshock.
The electric field intensity in the VLF band increased one day before the mainshock11 Near Alaska Peninsula 29 Jul. 2021 06:15:46 55.40 –158.00 8.1 10 The abnormal ULF wave appeared on 10, 2 days before the mainshock.
The Infrared hyperspectral methane, OLR, aerosol, and other long-term observation data observed anomalies more than a month before the earthquake.12 South water of Alaska 14 Aug. 2021 11:57:42 55.30 –157.75 7.0 10 The abnormal ULF emissions occurred on 12,4 days before and on the mainshock day 13 Haiti region 14 Aug. 2021 12:29:07 18.35 –73.45 7.3 10 The electromagnetic field intensity in the ULF/ELF band increased on August 9, 8, 4 days, and one day before the mainshock.
The energetic particle flux in 100 to 200 keV increased 4 and 3 days before the mainshock 下载: 导出CSV
-
[1] SHEN X H, ZHANG X M, YUAN S G, et al. The state-of-the-art of the China Seismo-Electromagnetic Satellite mission[J]. Science China Technological Sciences, 2018, 61(5): 634-642 doi: 10.1007/s11431-018-9242-0 [2] ZHIMA Z, HUANG J P, SHEN X H, et al. Simultaneous observations of ELF/VLF rising-tone quasiperiodic waves and energetic electron precipitations in the high-latitude upper ionosphere[J]. Journal of Geophysical Research: Space Physics, 2020, 125(5): e2019JA027574 [3] CHENG B J, ZHOU B, MAGNES W, et al. High precision magnetometer for geomagnetic exploration onboard of the China Seismo-Electromagnetic Satellite[J]. Science China Technological Sciences, 2018, 61(5): 659-668 doi: 10.1007/s11431-018-9247-6 [4] ZHOU B, YANG Y Y, ZHANG Y T, et al. Magnetic field data processing methods of the China Seismo-Electromagnetic Satellite[J]. Earth and Planetary Physics, 2018, 2(6): 455-461 doi: 10.26464/epp2018043 [5] POLLINGER A, LAMMEGGER R, MAGNES W, et al. Coupled dark state magnetometer for the China Seismo-Electromagnetic Satellite[J]. Measurement Science and Technology, 2018, 29(9): 095103 doi: 10.1088/1361-6501/aacde4 [6] CAO J B, ZENG L, ZHAN F, et al. The electromagnetic wave experiment for CSES mission: search coil magnetometer[J]. Science China Technological Sciences, 2018, 61(5): 653-658 doi: 10.1007/s11431-018-9241-7 [7] HUANG J P, SHEN X H, ZHANG X M, et al. Application system and data description of the China Seismo-Electromagnetic Satellite[J]. Earth and Planetary Physics, 2018, 2(6): 444-454 doi: 10.26464/epp2018042 [8] YAN R, GUAN Y B, SHEN X H, et al. The Langmuir Probe onboard CSES: data inversion analysis method and first results[J]. Earth and Planetary Physics, 2018, 2(6): 479-488 [9] LIU C, GUAN Y B, ZHENG X Z, et al. The technology of space plasma in-situ measurement on the China Seismo-Electromagnetic Satellite[J]. Science China Technological Sciences, 2019, 62(5): 829-838 doi: 10.1007/s11431-018-9345-8 [10] CHU W, HUANG J P, SHEN X H, et al. Preliminary results of the high energetic particle package on-board the China seismo-electromagnetic satellite[J]. Earth and Planetary Physics, 2018, 2(6): 489-498 [11] LI X Q, XU Y B, AN Z H, et al. The high-energy particle package onboard CSES[J]. Radiation Detection Technology and Methods, 2019, 3(3): 22 doi: 10.1007/s41605-019-0101-7 [12] LIN J, SHEN X H, HU L C, et al. CSES GNSS ionospheric inversion technique, validation and error analysis[J]. Science China Technological Sciences, 2018, 61(5): 669-677 doi: 10.1007/s11431-018-9245-6 [13] CHEN L, OU M, YUAN Y P, et al. Preliminary observation results of the Coherent Beacon System onboard the China Seismo-Electromagnetic Satellite-1[J]. Earth and Planetary Physics, 2018, 2(6): 505-514 [14] ZHIMA Z, YAN R, LIN J, et al. The possible seismo-ionospheric perturbations recorded by the China-seismo-electromagnetic satellite[J]. Remote Sensing, 2022, 14(4): 905 doi: 10.3390/rs14040905 [15] HU Yunpeng, ZHIMA Zeren, HUANG Jianping, et al. Algorithms and implementation of wave vector analysis tool for the electromagnetic waves recorded by the CSES satellite[J]. Chinese Journal of Geophysics, 2020, 63(5): 1751-1765 [16] QING Y, LIN J, LIU Y, et al. Precise orbit determination of the China Seismo-Electromagnetic Satellite (CSES) using onboard GPS and BDS observations[J]. Remote Sensing, 2020, 12(19): 3234 doi: 10.3390/rs12193234 [17] ZHIMA Z, ZHOU B, ZHAO S F, et al. Cross-calibration on the electromagnetic field detection payloads of the China Seismo-Electromagnetic Satellite[J]. Science China Technological Sciences, 2022, 65(6): 1415-1426 doi: 10.1007/s11431-021-1965-2 [18] YANG Y Y, ZHOU B, HULOT G, et al. CSES high precision magnetometer data products and example study of an intense geomagnetic storm[J]. Journal of Geophysical Research: Space Physics, 2021, 126(4): e2020JA028026 [19] YAN R, GUAN Y B, MIAO Y Q, et al. The regular features recorded by the Langmuir probe onboard the low earth polar orbit satellite CSES[J]. Journal of Geophysical Research: Space Physics, 2022, 127(1): e2021JA029289 [20] YANG Y Y, HULOT G, VIGNERON P, et al. The CSES global geomagnetic field model (CGGM): an IGRF-type global geomagnetic field model based on data from the China Seismo-Electromagnetic Satellite[J]. Earth, Planets and Space, 2021, 73(1): 45 doi: 10.1186/s40623-020-01316-w [21] ALKEN P, THÉBAULT E, BEGGAN C D, et al. International geomagnetic reference field: the thirteenth generation[J]. Earth, Planets and Space, 2021, 73(1): 49 doi: 10.1186/s40623-020-01288-x [22] CHEN L J, SANTOLÍK O, HAJOŠ M, et al. Source of the low-altitude hiss in the ionosphere[J]. Geophysical Research Letters, 2017, 44(5): 2060-2069 doi: 10.1002/2016GL072181 [23] ZHIMA Z, CHEN L J, XIONG Y, et al. On the origin of ionospheric hiss: a conjugate observation[J]. Journal of Geophysical Research: Space Physics, 2017, 122(11): 11784-11793 [24] PARROT M, SANTOLÍK O, NĔMEC F. Chorus and chorus-like emissions seen by the ionospheric satellite DEMETER[J]. Journal of Geophysical Research: Space Physics, 2016, 121(4): 3781-3792 doi: 10.1002/2015JA022286 [25] ZHIMA Z, CAO J B, LIU W L, et al. DEMETER observations of high-latitude chorus waves penetrating the plasmasphere during a geomagnetic storm[J]. Geophysical Research Letters, 2013, 40(22): 5827-5832 doi: 10.1002/2013GL058089 [26] HAYOSH M, NĚMEC F, SANTOLÍK O, et al. Propagation properties of quasiperiodic VLF emissions observed by the DEMETER spacecraft[J]. Geophysical Research Letters, 2016, 43(3): 1007-1014 doi: 10.1002/2015GL067373 [27] NĚMEC F, BEZDĚKOVÁ B, MANNINEN J, et al. Conjugate observations of a remarkable quasiperiodic event by the low-altitude DEMETER spacecraft and ground-based instruments[J]. Journal of Geophysical Research: Space Physics, 2016, 121(9): 8790-8803 doi: 10.1002/2016JA022968 [28] YAN R, ZHIMA Z, XIONG C, et al. Comparison of electron density and temperature from the CSES satellite with other space-borne and ground-based observations[J]. Journal of Geophysical Research: Space Physics, 2020, 125(10): e2019JA027747 [29] NĚMEC F, SANTOLÍK O, PARROT M. Decrease of intensity of ELF/VLF waves observed in the upper ionosphere close to earthquakes: a statistical study[J]. Journal of Geophysical Research: Space Physics, 2009, 114(A4): A04303 [30] PARROT M, BERTHELIER J J, LEBRETON J P, et al. Examples of unusual ionospheric observations made by the DEMETER satellite over seismic regions[J]. Physics and Chemistry of the Earth, Parts A/B/C, 2006, 31(4/5/6/7/8/9): 486-495 [31] PULINETS S, OUZOUNOV D. Lithosphere-Atmosphere-Ionosphere Coupling (LAIC) model – An unified concept for earthquake precursors validation[J]. Journal of Asian Earth Sciences, 2011, 41(4/5): 371-382 [32] ZHU K Y, ZHENG L, YAN R, et al. The variations of electron density and temperature related to seismic activities observed by CSES[J]. Natural Hazards Research, 2021, 1(2): 88-94 doi: 10.1016/j.nhres.2021.06.001 [33] PULINETS S, OUZOUNOV D. The Possibility of Earthquake Forecasting: Learning from Nature[M]. IOPscience, 2018. DOI: 10.1088/978-0-7503-1248-6 Corpus ID: 133839066 [34] LIU Q Q, DE SANTIS A, PISCINI A, et al. Multi-parametric climatological analysis reveals the involvement of fluids in the preparation phase of the 2008 Ms 8.0 Wenchuan and 2013 Ms 7.0 Lushan earthquakes[J]. Remote Sensing, 2020, 12(10): 1663 doi: 10.3390/rs12101663 [35] ZHAO S F, SHEN X H, LIAO L, et al. A lithosphere-atmosphere-ionosphere coupling model for ELF electromagnetic waves radiated from seismic sources and its possibility observed by the CSES[J]. Science China Technological Sciences, 2021, 64(11): 2551-2559 doi: 10.1007/s11431-021-1934-5 [36] WANG J, SHEN X H, YANG Y Y, et al. Initial scalar lithospheric magnetic anomaly map of China and surrounding regions derived from CSES satellite data[J]. Science China Technological Sciences, 2021, 64(5): 1118-1126 doi: 10.1007/s11431-020-1727-0 [37] ZHAO S F, SHEN X H, ZHOU C, et al. The influence of the ionospheric disturbance on the ground based VLF transmitter signal recorded by LEO satellite–Insight from full wave simulation[J]. Results in Physics, 2020, 19: 103391 doi: 10.1016/j.rinp.2020.103391 [38] YANG Y Y, ZHIMA Z R, SHEN X H, et al. The first intense geomagnetic storm event recorded by the China seismo-electromagnetic satellite[J]. Space Weather, 2020, 18(1): e2019SW002243 [39] LIU D P, ZEREN Z, SHEN X H, et al. Typical ionospheric disturbances revealed by the plasma analyzer package onboard the China Seismo-Electromagnetic Satellite[J]. Advances in Space Research, 2021, 68(9): 3796-3805 doi: 10.1016/j.asr.2021.08.009 [40] ZHANG Z, XIANG Z, WANG Y, Ni B, et al. Electron acceleration by magnetosonic waves in the deep inner belt (L = 1.5–2) region during geomagnetic storm of August 2018[J]. Journal of Geophysical Research: Space Physics, 2021, 126: e2021JA029797 [41] ZHANG Z, CHEN L, LIU S, et al. Chorus acceleration of relativistic electrons in extremely low L-shell during geomagnetic storm of August 2018[J]. Geophysical Research Letters, 2020, 47(4): e2019GL086226 [42] ZHANG Z, SHEN X, LI X, et al. Proton loss of inner radiation belt during geomagnetic storm of 2018 based on CSES satellite observation[J]. Chinese Physics B, 2021, 30(12): 129401 [43] ZHIMA Z, HU Y P, SHEN X H, et al. Storm-time features of the ionospheric ELF/VLF waves and energetic electron fluxes revealed by the China seismo-electromagnetic satellite[J]. Applied Sciences, 2021, 11(6): 2617 doi: 10.3390/app11062617 -
-

 下载:
下载:


计量
- 文章访问数: 1332
- HTML全文浏览量: 578
- PDF下载量: 75
-
被引次数:
0(来源:Crossref)
0(来源:其他)

