


基于符号化表示相似度度量的卫星多元工程参数异常检测
doi: 10.11728/cjss2023.01.220112004 cstr: 32142.14.cjss2023.01.220112004
Multivariate Engineering Parameter Anomaly Detection of the Satellite Based on Similarity Metric of the Symbolic Representation
-
摘要: 随着卫星系统复杂程度的日益增加,综合分析卫星多元参数之间的相关性异常对于卫星安全运行和空间任务的正确执行具有重要意义。利用某卫星工程参数数据,基于符号聚合近似算法(SAX),研究卫星多元工程参数的异常检测问题,解决了当前异常检测方法中多元参数融合时不考虑上下文信息造成信息丢失的问题,实现多元参数有效融合,形成一种优化的基于快速动态时间规整算法(Fast-DTW)的异常检测算法。研究结果表明,模型在某卫星电源子系统的异常检测过程中,recall,precision和F1 score分别为0.947,0.9和0.923,能够实际应用于卫星异常检测,提高卫星在轨运行的安全性。
-
关键词:
- 异常检测 /
- 卫星工程参数 /
- 符号聚合近似 /
- 快速动态时间规整(Fast-DTW)
Abstract: The complexity of the satellite system is increasing, and the comprehensive analysis of the abnormal correlation between the satellite with multiple parameters is important for the safe operation of the satellite and the correct execution of space tasks. Aiming at the characteristics of large amount of engineering parameter data, high parameter correlation and pseudo-period, a satellite multivariate engineering parameter anomaly detection method based on symbolized representation similarity measurement is proposed. Using real satellite engineering parameter data, based on Symbol Aggregation Algorithm (SAX), this paper studies the anomaly detection problem of satellite multiple engineering parameters, solves the problem of the context information, realizes effective fusion, and forms an optimized anomaly detection algorithm based on similarity measurement Fast-DTW algorithm. Results show that during the abnormality detection process, the recall, precision and F1 score are 0.947, 0.9 and 0.923 respectively in the real satellite power subsystem, and the algorithm can be actually used in satellite anomaly detection to improve the safety of satellite in-orbit operation. -

图 1
$ \varphi =4 $ 和$ \varphi =5 $ 时字母映射关系Figure 1. Latter mapping relationship when
$\varphi =4 $ and$\varphi =5 $ 
图 2 某卫星电源分系统充电电流时序数据
Figure 2. Charging current timing data of a satellite power supply subsystem

图 3 传统的固定窗口子序列分段算法的分段结果
Figure 3. Segmentation results of the traditional segmentation algorithm for fixed window opening sequence

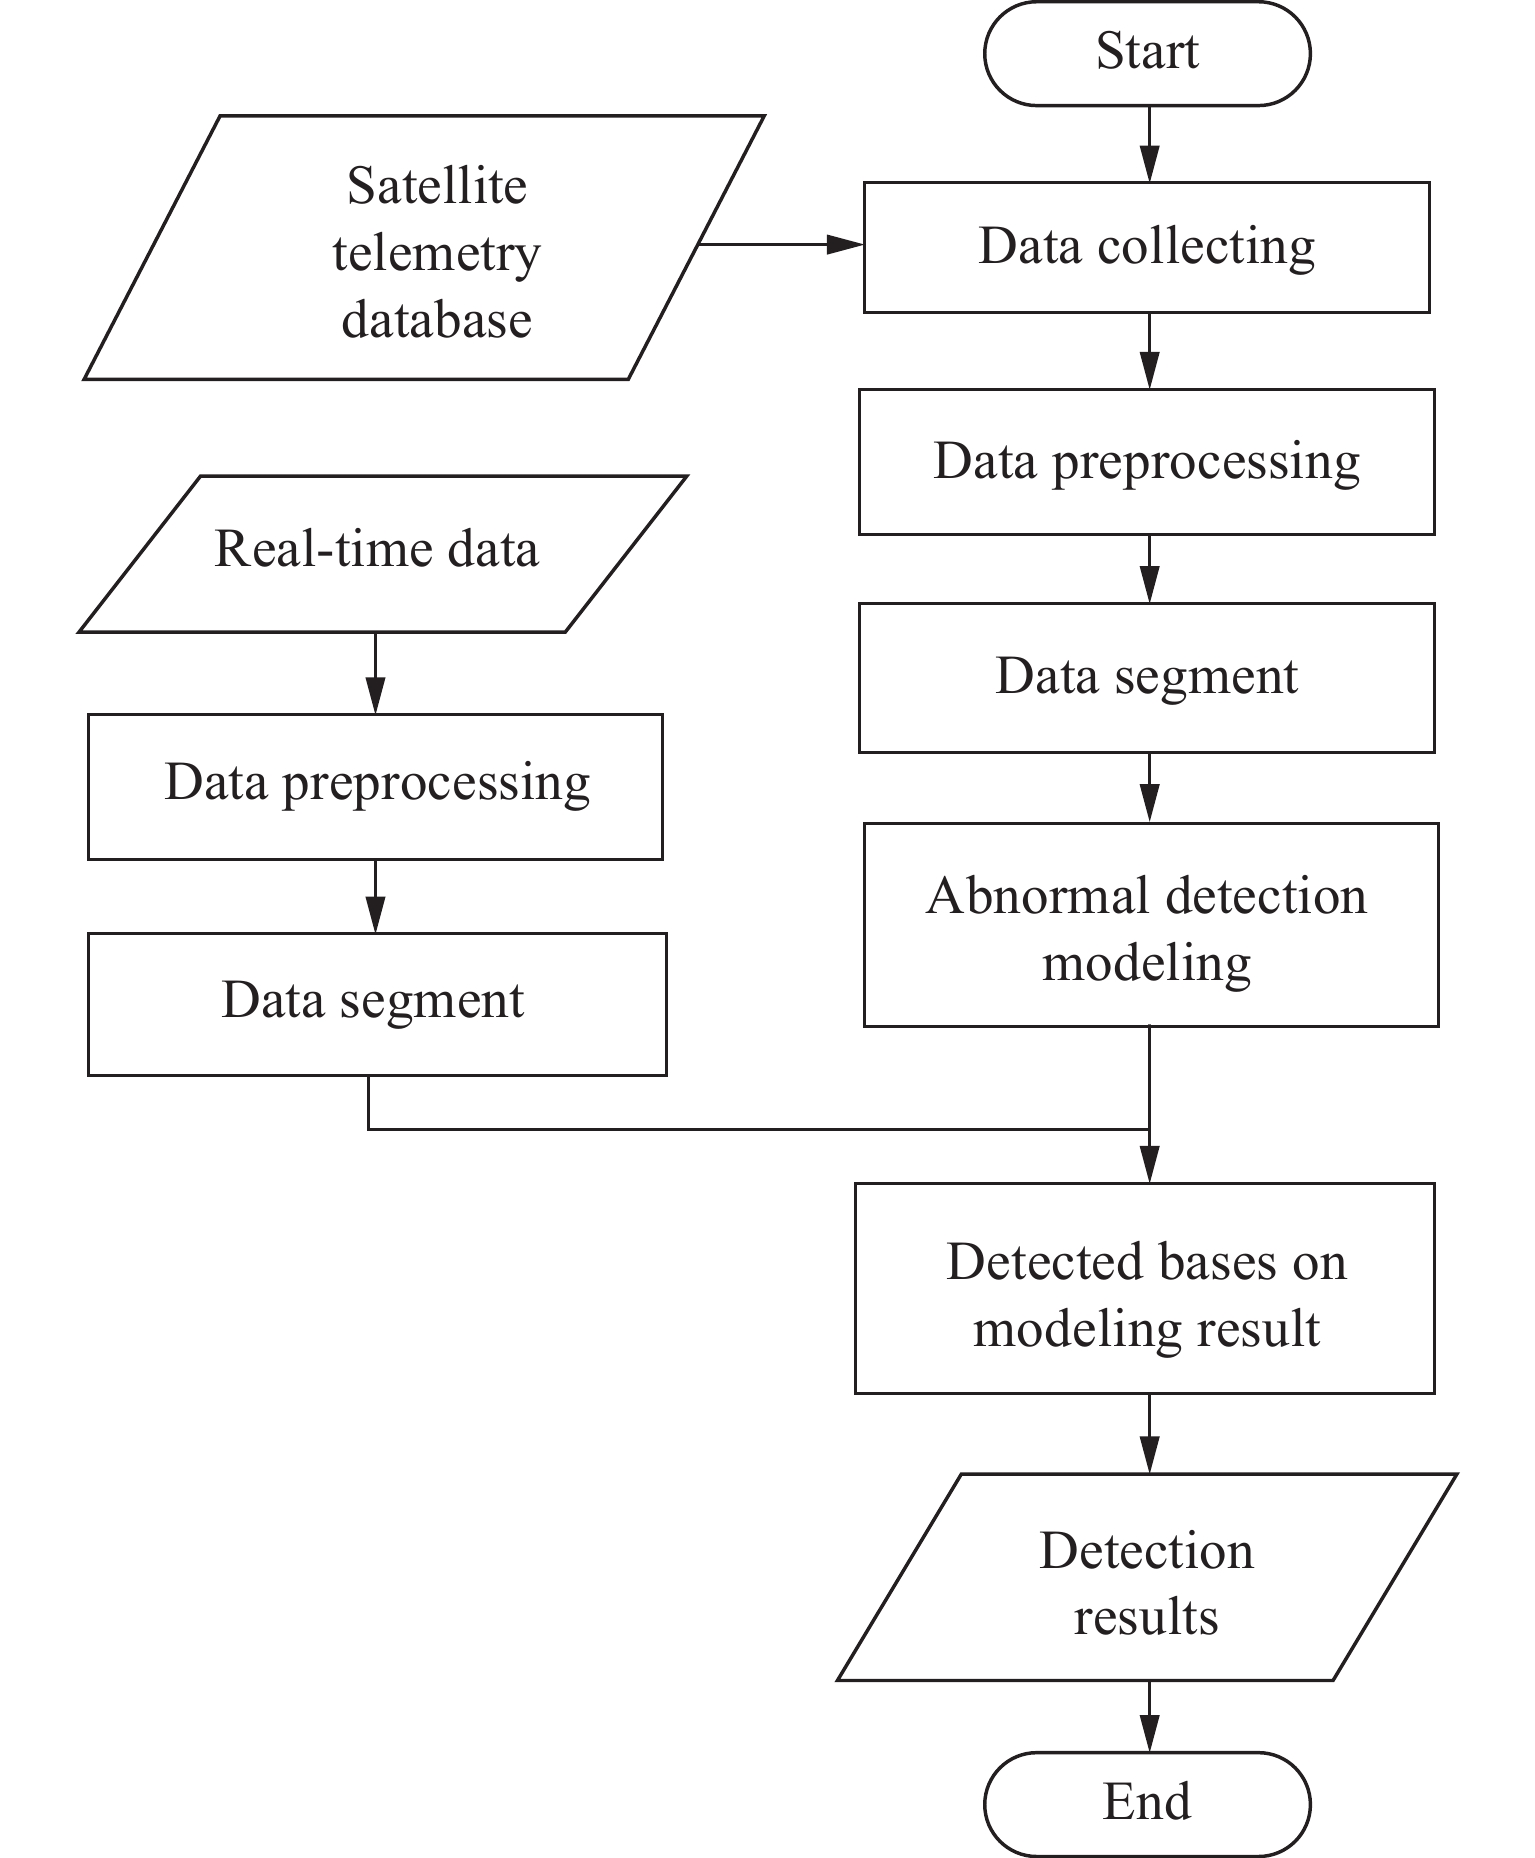
图 4 基于EMF卫星异常检测算法流程
Figure 4. Flow chart of satellite abnormality detection algorithm based on EMF

图 6
$ {l}_{\mathrm{e}\mathrm{n}} $ 为5时EPA_Segment算法的分段结果Figure 6. Segment results of EPA_Segment algorithm when
$ {l}_{\mathrm{e}\mathrm{n}} $ is 5
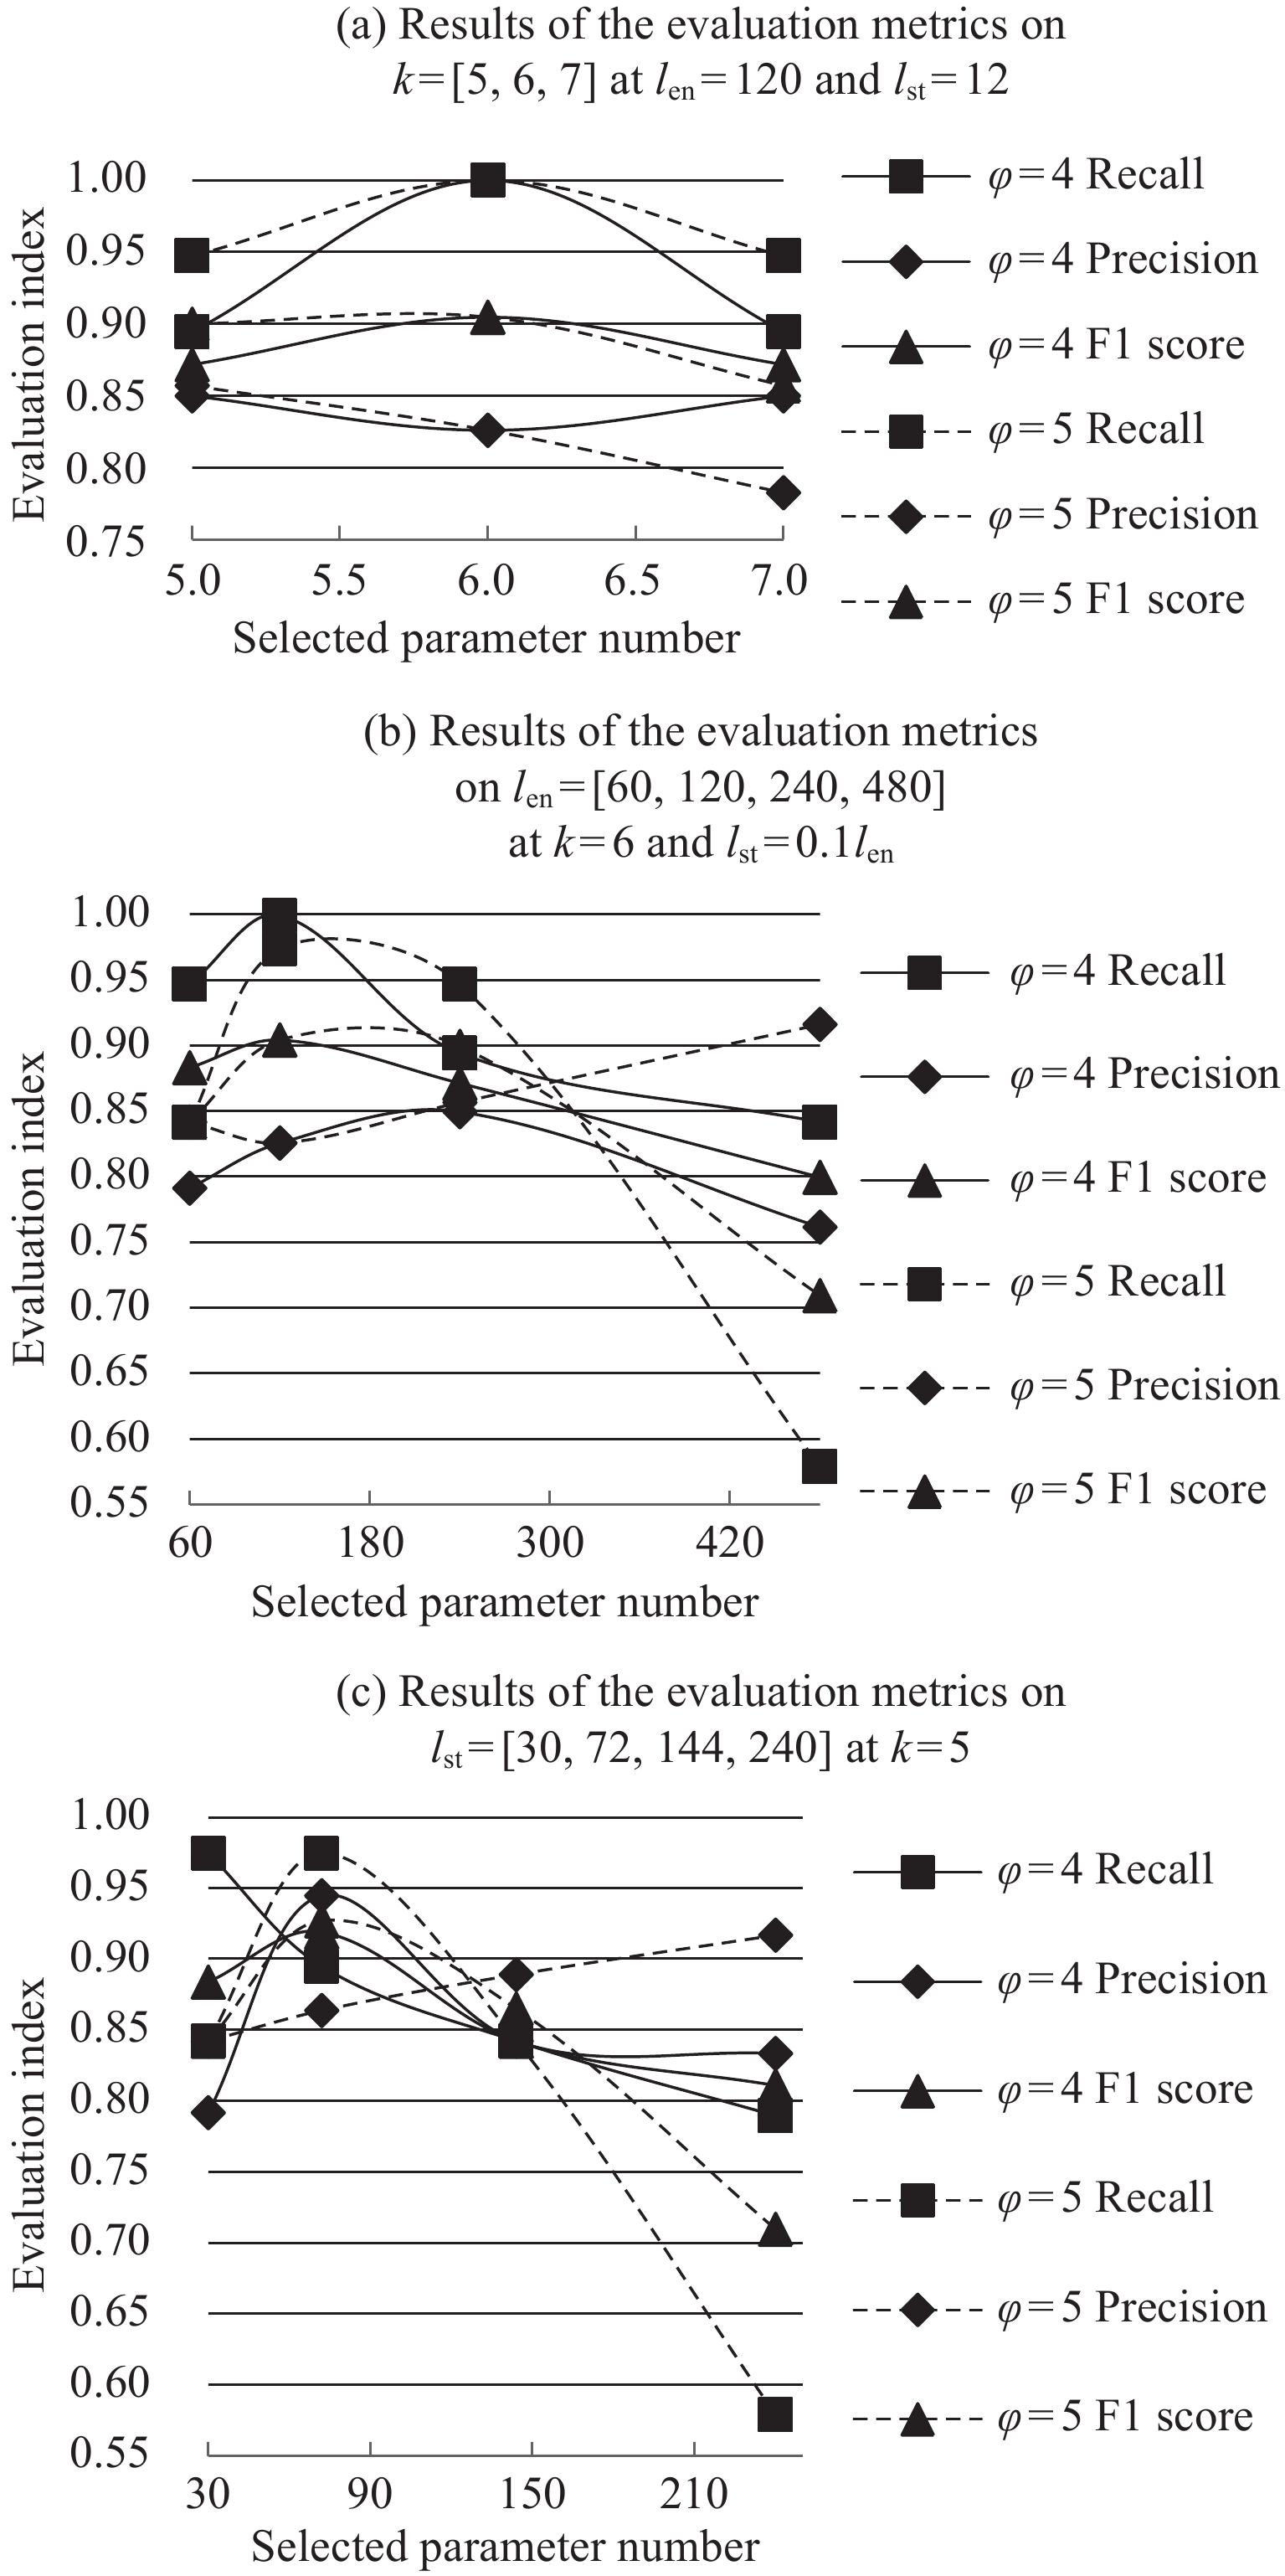
图 7 参数选择量对异常检测评价指标的影响
Figure 7. Effect of selectparametersnums on the evaluation index of anomaly detection

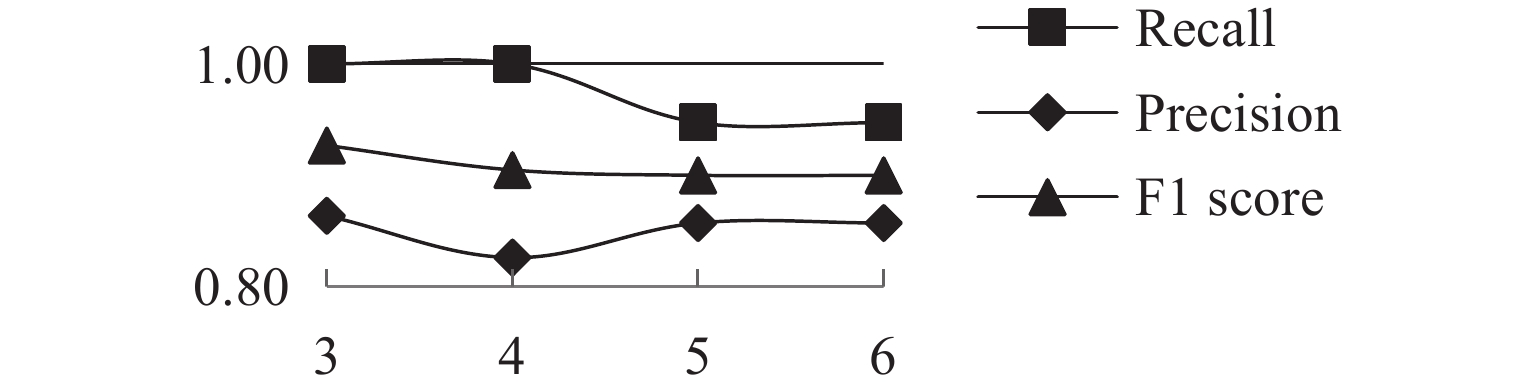
图 8 参数训练过程中各评价指标结果
Figure 8. Results of each evaluation index during the parametric training process
表 1 字母数为3~7的断点查找表
Table 1. Breakpoint lookup table with alphabetically numbered 3~7
3 4 5 6 7 $ {\mathrm{\beta }}_{1} $ –0.43 –0.67 –0.84 –0.97 –1.07 $ {\mathrm{\beta }}_{2} $ 0.43 0 –0.25 –0.43 –0.57 $ {\mathrm{\beta }}_{3} $ - 0.67 0.25 0 –0.18 $ {\mathrm{\beta }}_{4} $ - - 0.84 0.43 0.18 $ {\mathrm{\beta }}_{5} $ - - - 0.97 0.57 $ {\mathrm{\beta }}_{6} $ - - - - 1.07  下载: 导出CSV
表 2 极值点获取(EPA)算法流程
Table 2. Extremum point acquisition algorithm process
Input: Time series $ T=\left({t}_{1},{t}_{2},\cdots .{t}_{n}\right) $, $ {\rm{threshold}} $ Initialize: The sliding window $ \omega ={T}_{{\rm{cycle}}}+{T}_{\mathrm{f}\mathrm{i}\mathrm{t}\mathrm{t}\mathrm{e}\mathrm{d}}, $ $ {t}_{i}={t}_{1} $ 1. while i<=n do 2. $ {t}_{i} $= maximum/mininum ($ \left[{t}_{i},{t}_{i+\omega }\right] $) 3. $ {t}_{j} $= maximum/mininum ($ \left[{t}_{i+\omega -threshold},{t}_{i+\omega +threshold}\right] $) 4. Add $ i $ and $ j $ to the extreme point set $ {\rm{EPS}} $ 5. Set $ i=j $ 6. end while 7. return $ {\rm{EPS}} $
下载: 导出CSV
表 3 分段(Segment)算法流程
Table 3. Segment algorithm process
Input: The extrepoint set sequence $ {\rm{EPS}}=({e}_{1},{e}_{2}, \cdots ,{e}_{m}) $, Time series $ T=\left({t}_{1},{t}_{2},\cdots .{t}_{n}\right) $ Initialize: The sliding window size $ len $,$ {e}_{i}={e}_{1} $ 1. while i<=m do 2. $ {t}_{{e}_{i}} $= maximum/mininum ($ \left[{t}_{{e}_{i}},{t}_{{l}_{en}+{e}_{i}}\right] $) 3. $ {t}_{{e}_{j}} $= maximum/mininum ($ \left[{t}_{{e}_{i}},{t}_{{l}_{en}+{e}_{i}}\right] $) 4. If $ {e}_{j}={e}_{i} $ 5. Add $ {e}_{i} $ to the set of segmentation time points $ {\rm{STP}} $ 6. set $ {e}_{i}={e}_{j} $; 7. end while 8. ${\rm{STP}}=({s}_{1},{s}_{2},\cdots ,{s}_{k})$ 9. while i<k do 10. Add $ \left[{t}_{{s}_{i}},{t}_{{s}_{i+1}}\right] $ to the set of pseudo-periodic subsequences $ {\rm{PPS}} $ 11. end while 12. return $ {\rm{PPS}} $
下载: 导出CSV
表 4 EPA_Segment算法调参优化结果
Table 4. Results of EPA_Segment tuning optimization algorithm
$ {l}_{\mathrm{e}\mathrm{n}} $ EPA_Segment
(max)/ cycleEPA_Segment
(min) / cycleActual/
cycle2 43 35 12 3 22 20 12 4 18 16 12 5 13 12 12 6 12 12 12 7 12 11 12 8 11 10 12
下载: 导出CSV
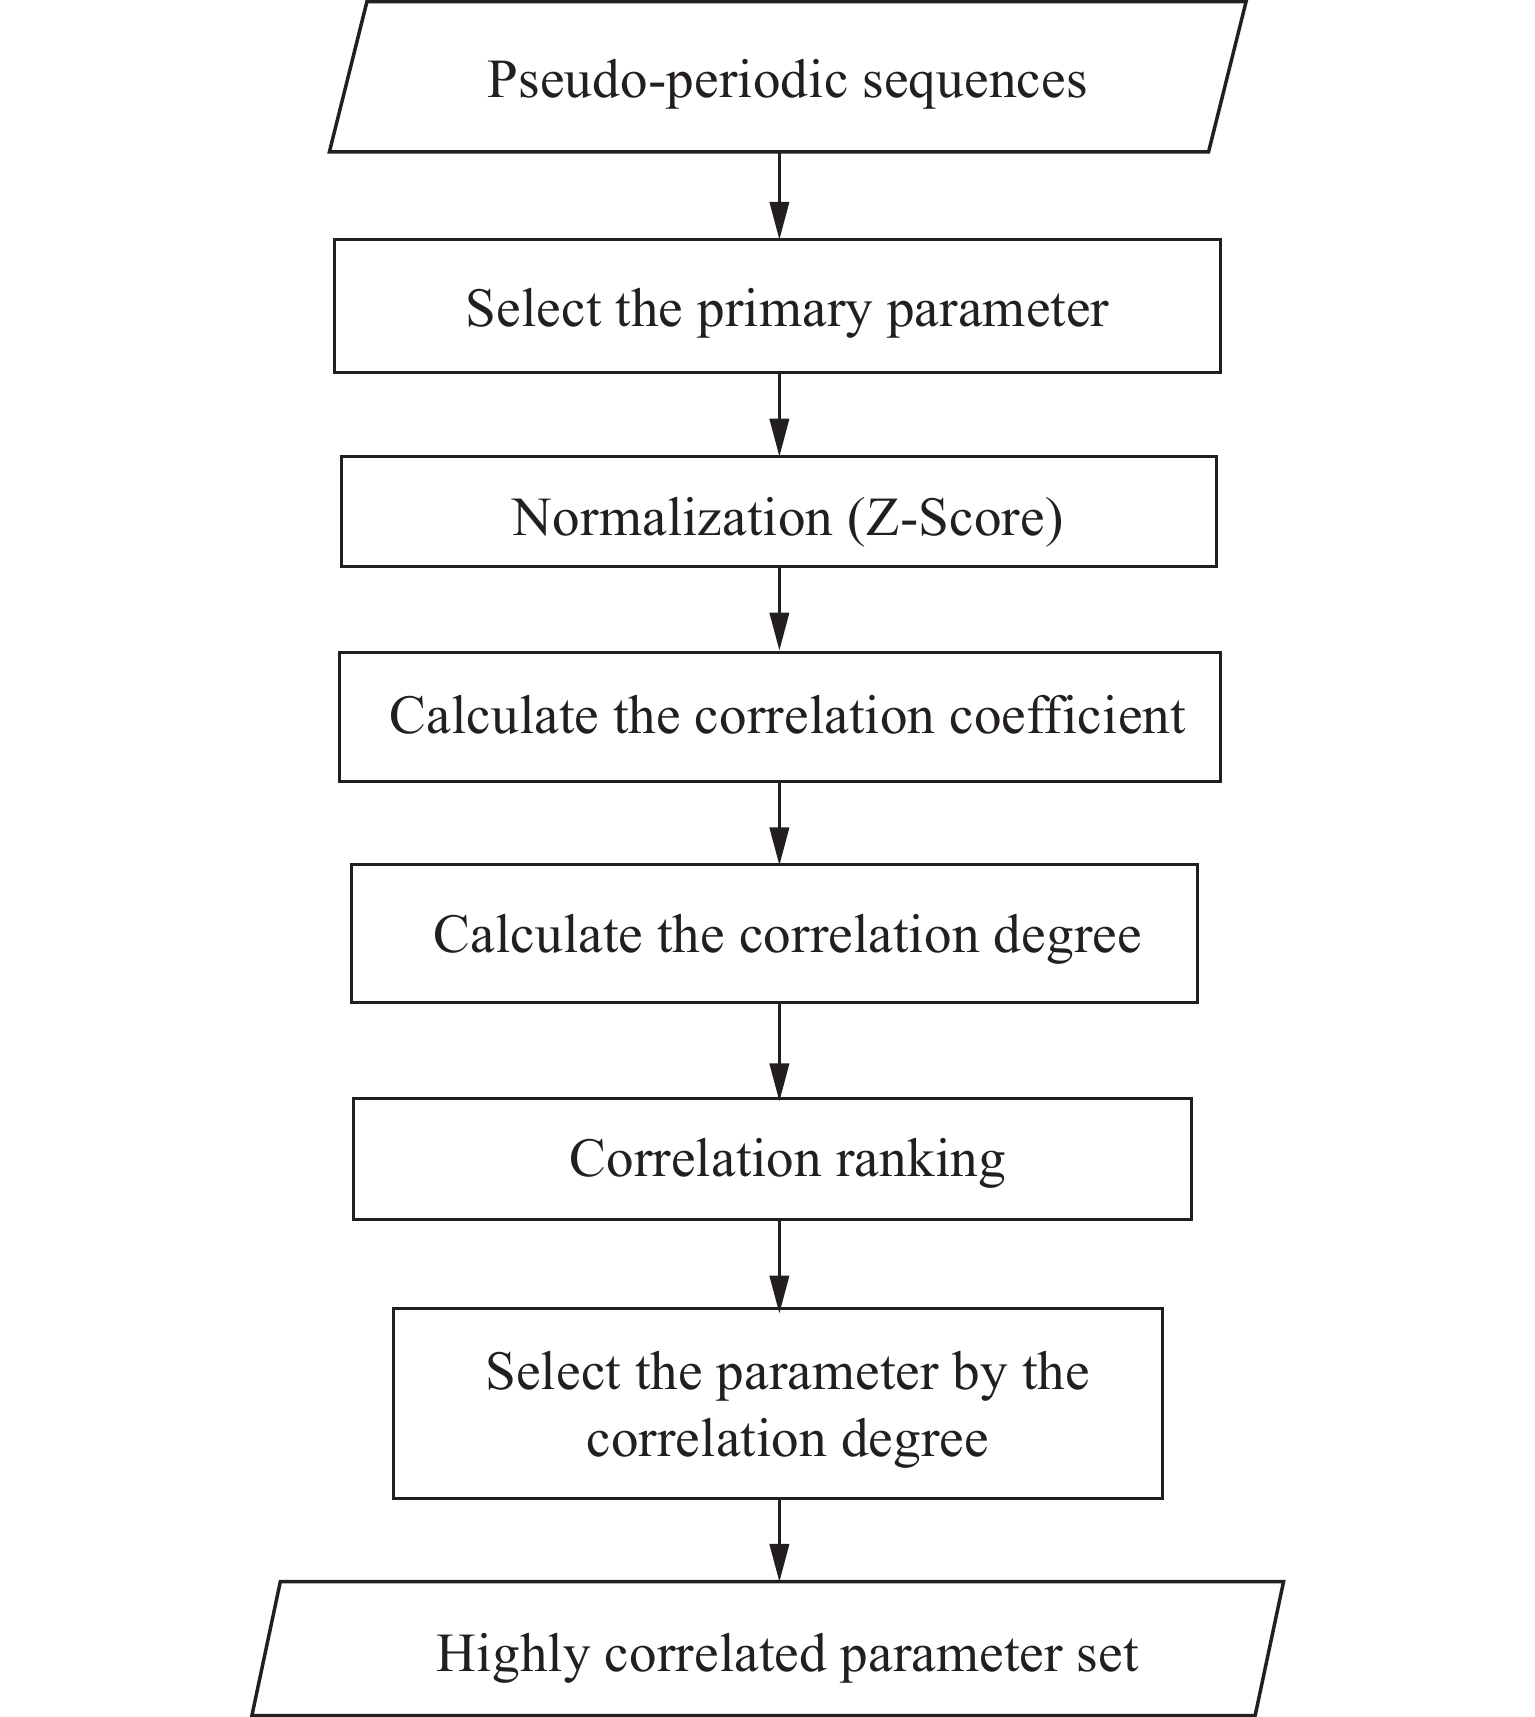
表 5 电源分系统特征选择的最优结果
Table 5. Optimal result of the feature selection of the power supply subsystem
卫星参数 相关性百分比/(%) 测控应答机A机配电状态 83.5 测控应答机B机配电状态 83.3 GNSS接收机A机配电状态 83.0 备相位计配电状态 82.9 备载荷电控箱配电状态 82.8 相位计配电状态 82.8
下载: 导出CSV
表 6 不同算法的异常检测结果
Table 6. Anomaly detection results for different algorithms
评价指标 EMF 1-NN ED KMeans ED Recall 0.947 0.871 0.833 Precision 0.9 0.9 0.714 F1 score 0.923 0.885 0.769
下载: 导出CSV
-
[1] 张晓芳, 刘松涛, 吴耀平. 影响卫星故障的空间天气分析[J]. 空间科学学报, 2015, 35(4): 461-472ZHANG Xiaofang, LIU Songtao, WU Yaoping. Statistical analysis of space weather effects on satellites anomalies[J]. Chinese Journal of Space Science, 2015, 35(4): 461-472 [2] 庞景月. 基于概率性预测的航天器遥测数据异常检测方法研究[D]. 哈尔滨: 哈尔滨工业大学, 2019PANG Jingyue. Probabilistic Prediction Based Anomaly Detection Method for Spacecraft Telemetry Data[D]. Harbin: Harbin Institute of Technology, 2019 [3] 杨甲森, 孟新, 陈托, 等. 基于遥测数据相关性的航天器异常检测[J]. 仪器仪表学报, 2018, 39(8): 24-33YANG Jiasen, MENG Xin, CHEN Tuo, et al. Anomaly detection of spacecraft based on the telemetry data correlation[J]. Chinese Journal of Scientific Instrument, 2018, 39(8): 24-33 [4] HUNDMAN K, CONSTANTINOU V, LAPORTE C, et al. Detecting spacecraft anomalies using LSTMs and nonparametric dynamic thresholding[C]//Proceedings of the 24 th ACM Sigkdd International Conference on Knowledge Discovery & Data Mining. London: ACM, 2018: 387-395 [5] 张薇, 肖志刚, 李博权. 故障树专家系统在有效载荷状态诊断的应用[J]. 计算机技术与发展, 2014, 24(12): 28-31,36ZHANG Wei, XIAO Zhigang, LI Boquan. Application of fault tree expert system in diagnosis about payload status[J]. Computer Technology and Development, 2014, 24(12): 28-31,36 [6] FIGUEROA F, UNDERWOOD L, WALKER M G, et al. NASA platform for autonomous systems (NPAS)[C]//AIAA SciTech. San Diego: AIAA, 2019 [7] BERNDT D J, CLIFFORD J. Using dynamic time warping to find patterns in time series[C]//Proceedings of the 3 rd International Conference on Knowledge Discovery and Data Mining. Seattle: ACM, 1994: 359-370 [8] 田林琳. 基于深度学习及GPU计算的航天器故障检测技术[J]. 计算机测量与控制, 2020, 28(5): 1-4,9TIAN Linlin. Spacecraft fault detection technology based on deep learning and GPU computing[J]. Computer Measurement & Control, 2020, 28(5): 1-4,9 [9] 顾昕雨. 基于ARIMA-SVR组合模型的卫星遥测数据预测研究[D]. 北京: 中国科学院大学(中国科学院国家空间科学中心), 2021GU Xinyu. Research on Satellite Telemetry Data Prediction based on ARIMA-SVR Combination Model[D]. Beijing: University of Chinese Academy of Sciences (National Space Science Center, Chinese Academy of Sciences), 2021 [10] 王伟, 王建东, 张霞. 基于改进符号化度量方法的机场噪声异常检测[J]. 计算机与现代化, 2014(8): 5-10WANG Wei, WANG Jiandong, ZHANG Xia. An anomaly detection method of airport-noise time series based on improved SAX measurement[J]. Computer and Modernization, 2014(8): 5-10 [11] 阮辉, 刘雷, 胡晓光. 基于趋势符号聚合近似的卫星时序数据分类方法[J]. 北京航空航天大学学报, 2021, 47(2): 333-341RUAN Hui, LIU Lei, HU Xiaoguang. Satellite time series data classification method based on trend symbolic aggregation approximation[J]. Journal of Beijing University of Aeronautics and Astronautics, 2021, 47(2): 333-341 [12] 王见, 毛黎明, 尹爱军. 结合形状特征及其上下文的多维DTW[J]. 计算机工程与应用, 2020, 56(22): 42-47 doi: 10.3778/j.issn.1002-8331.1912-0320WANG Jian, MAO Liming, YIN Aijun. Multi-dimensional DTW combined with shape feature and context information[J]. Computer Engineering and Applications, 2020, 56(22): 42-47 doi: 10.3778/j.issn.1002-8331.1912-0320 [13] 杜莹, 李四虎, 胡绍林, 等. 遥测伪周期时间序列子序列异常检测算法[J]. 中国空间科学技术, 2016, 36(5): 18-24DU Ying, LI Sihu, HU Shaolin, et al. Detection algorithm of abnormal sub-sequence in pseudo periodic time series of telemetry[J]. Chinese Space Science and Technology, 2016, 36(5): 18-24 [14] LIN J, KEOGH E, WEI L, et al. Experiencing SAX: a novel symbolic representation of time series[J]. Data Mining and Knowledge Discovery, 2007, 15(2): 107-144 doi: 10.1007/s10618-007-0064-z -
-


 下载:
下载:


计量
- 文章访问数: 786
- HTML全文浏览量: 359
- PDF下载量: 33
-
被引次数:
0(来源:Crossref)
0(来源:其他)

