


Construction and Verification of DAM Model
-
摘要: 根据热层物理、经验模型原理和代码分析,研究模型构建方法。进而剖析国内热层大气探测和热层模型构建现状,提出存在的困难和未来的发展思路。以GOST模型为基础,分析模型的工作机制、地磁扰动期大气密度预报误差来源和密切相关的模型系数,推导模型密度对相关模型系数的偏导数矩阵。利用天基实测密度,有针对性地构建磁暴期大气模型(DAM)。并通过独立于建模的实测密度数据,验证DAM模型性能。统计发现,地磁活动指数Ap介于100~132时GOST, MSIS00和DAM模型的相对误差均值依次为64.32%,–176.72%,–14.83%。Ap指数80~132时,相对误差均值对应为77.44%,–136.74%,–14.14%,DAM模型性能较GOST和MSIS00均有明显提升。证明通过搭建大气模型框架和实测密度数据估计模型参数的建模方法是可行和有效的。Abstract: The physical model of the thermosphere and the empirical and semi-empirical model of the thermosphere are analyzed. The basic theory and code analysis of the empirical thermosphere model are used to clarify the model construction methods. Based on the current situation of atmospheric modeling in China, the difficulties are analyzed and development suggestions are given. Based on the GOST model, the prediction performance of atmospheric model in geomagnetic disturbed period was analyzed, and the construction of atmospheric model in geomagnetic storm period was studied. The Disturbed Atmospheric Model (DAM) was constructed based on the measured density data, and its validity was verified. It is found that the mean relative errors of GOST, MSIS00 and DAM models are 64.32%, –176.72% and –14.83%, respectively, within the range of geomagnetic index Ap 100~132. As Ap is within the range of 80~132, the relative error mean of each model is 77.44%, –136.74%, –14.14% respectively, DAM model is significantly improved compared with GOST and MSIS00. It is proved that the modeling method of estimating model parameters by building an atmospheric model framework and measured density data is feasible and effective.
-
Key words:
- Thermosphere models /
- Model construction /
- DAM model /
- Evaluation
-
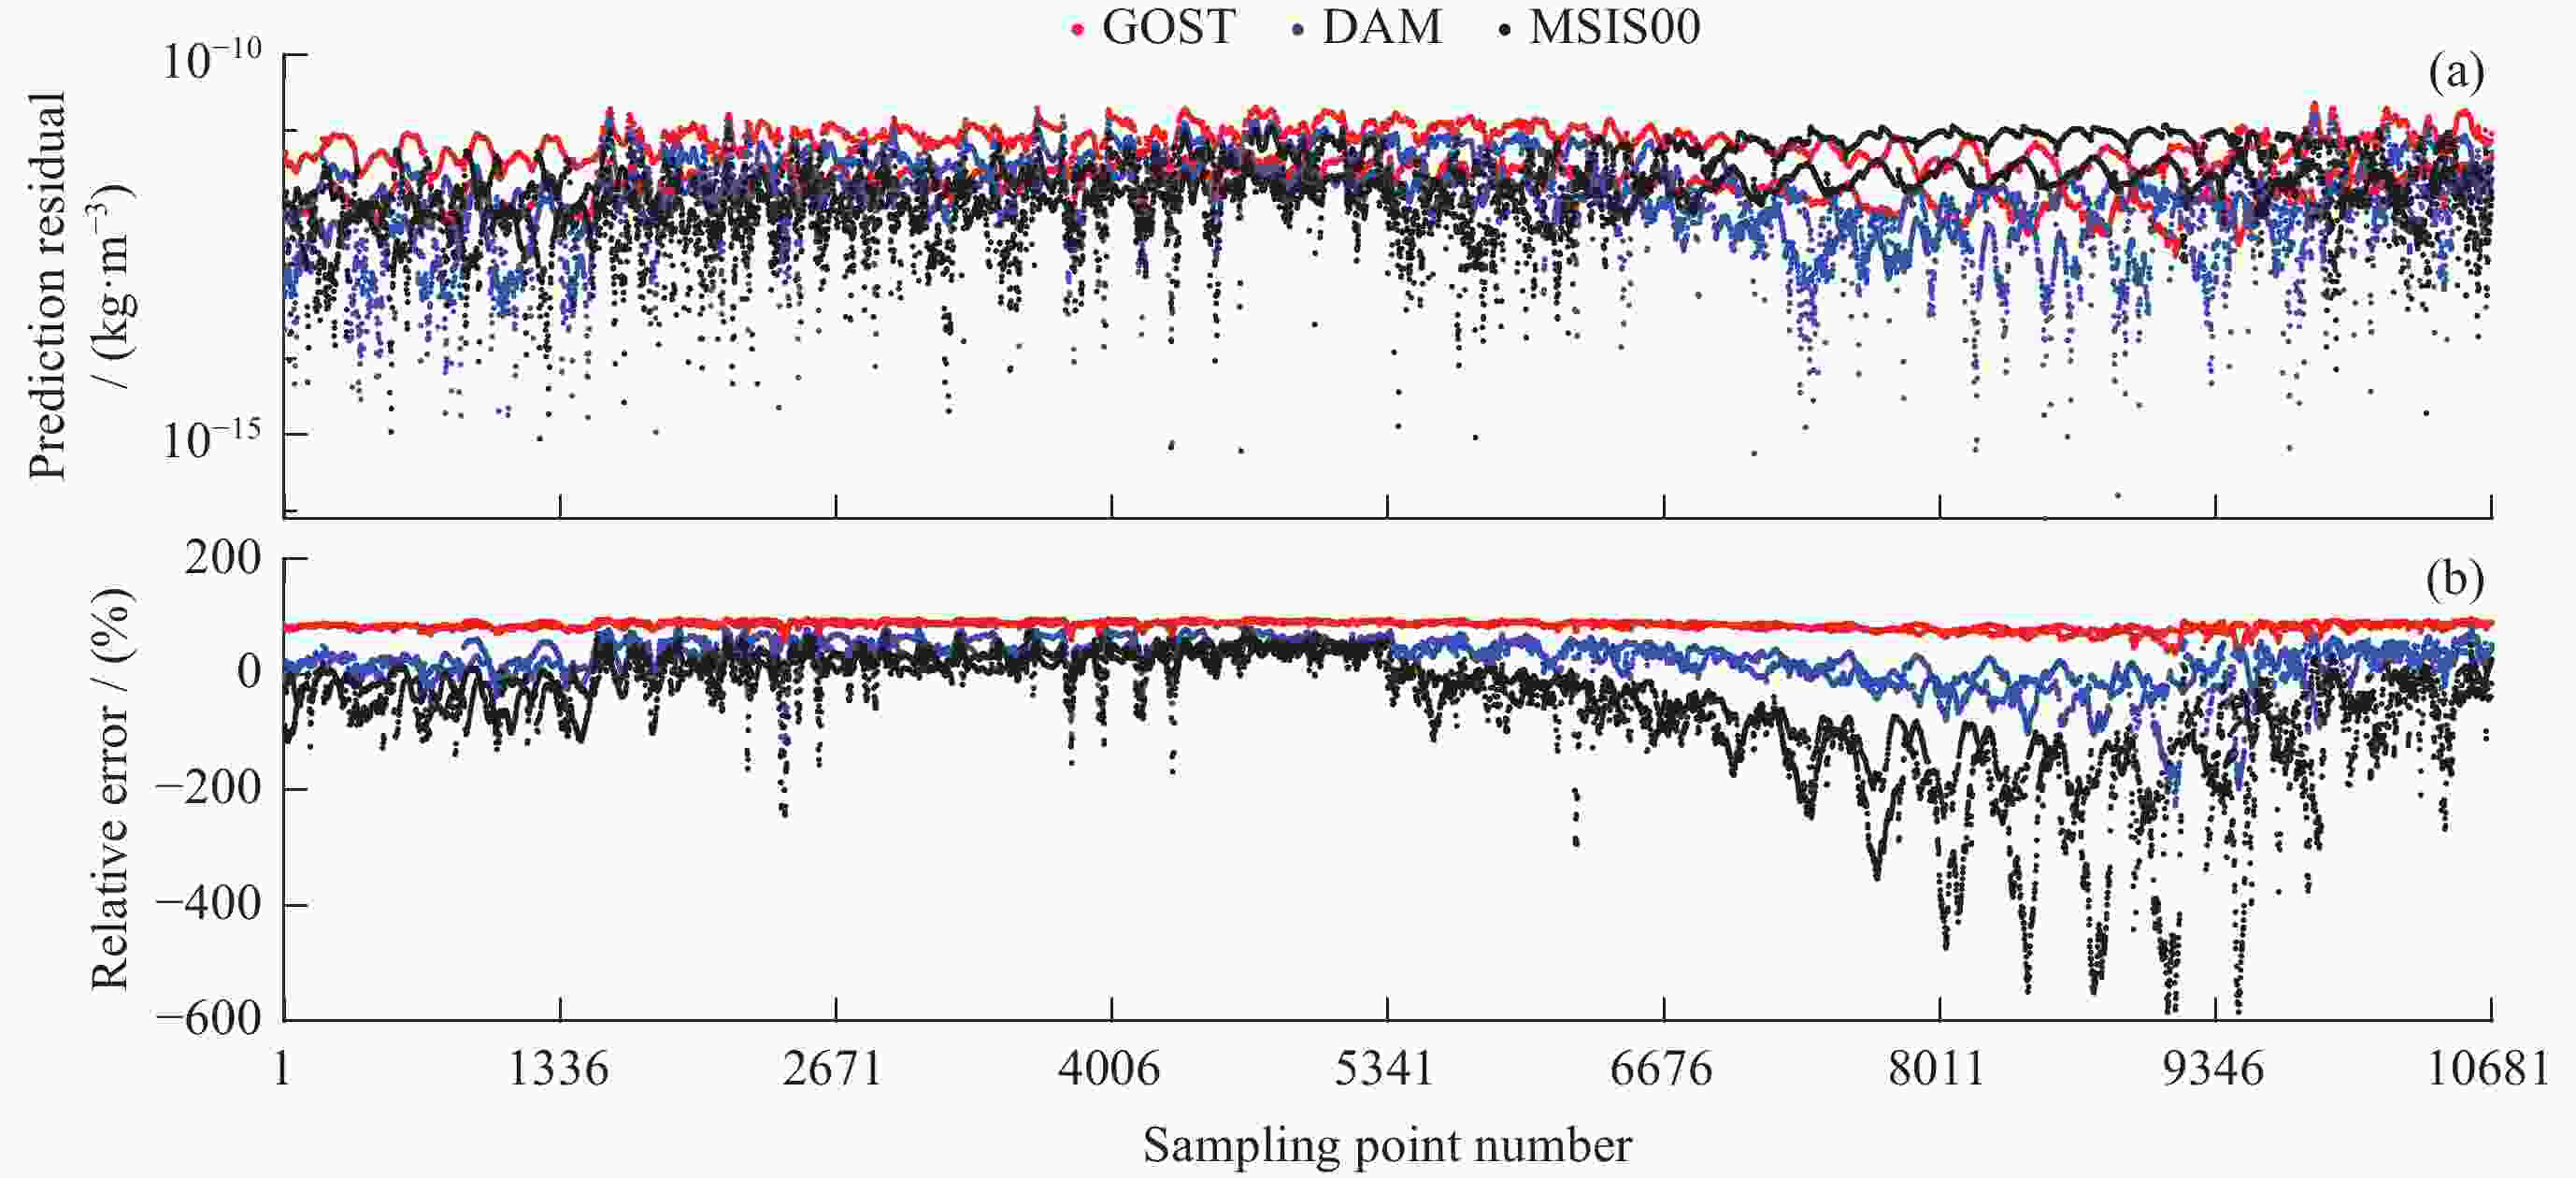
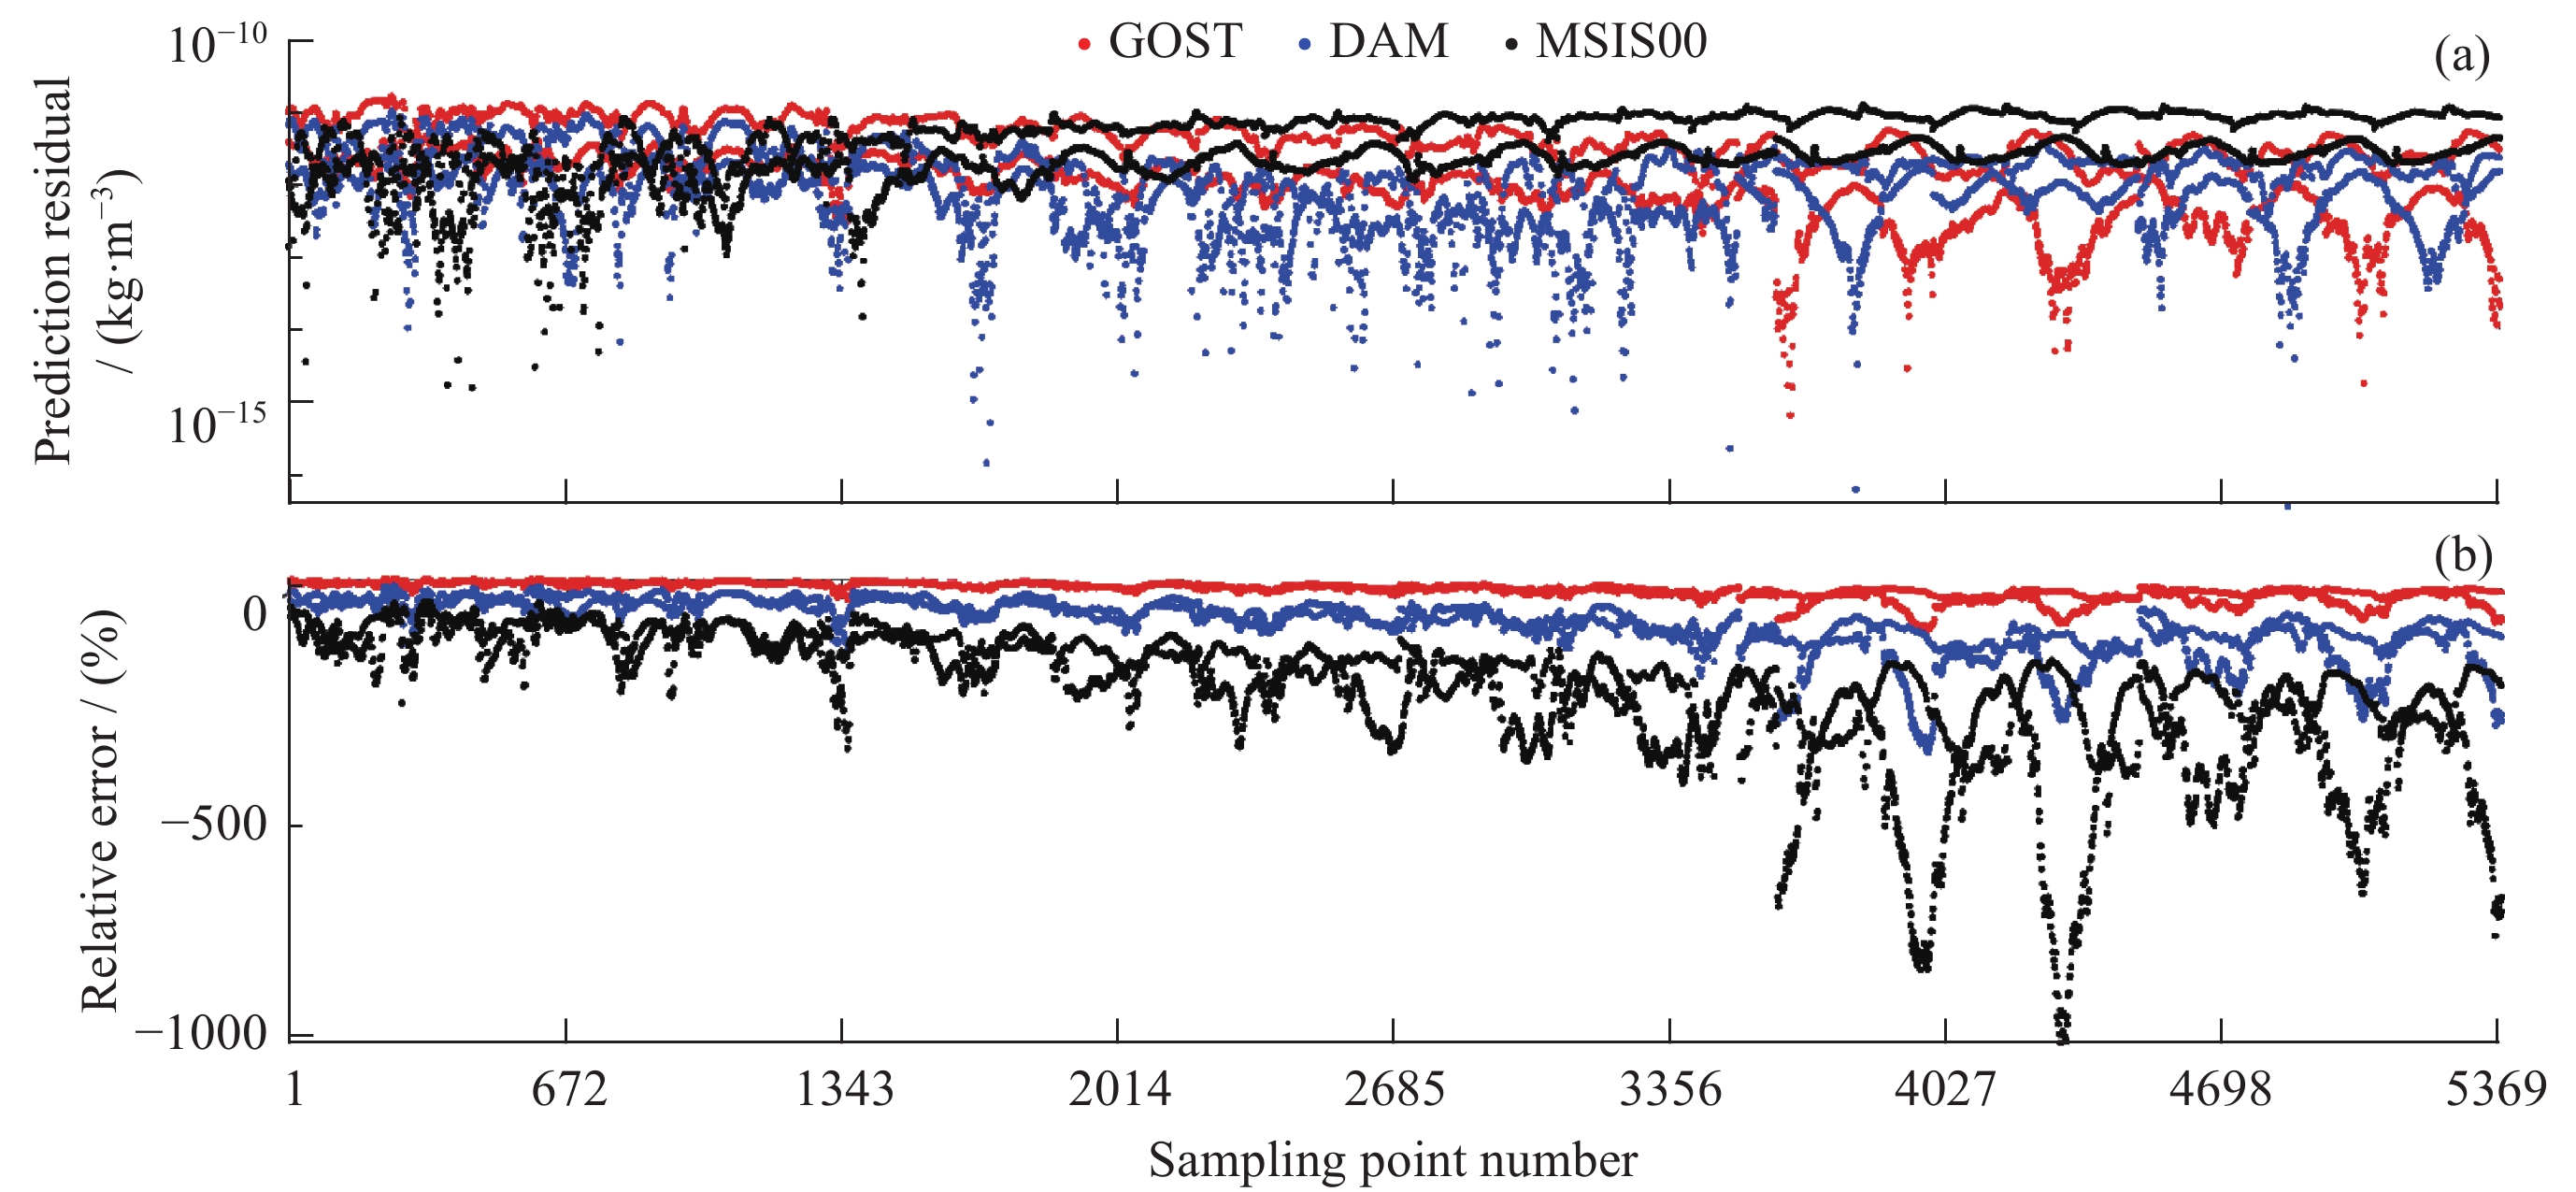
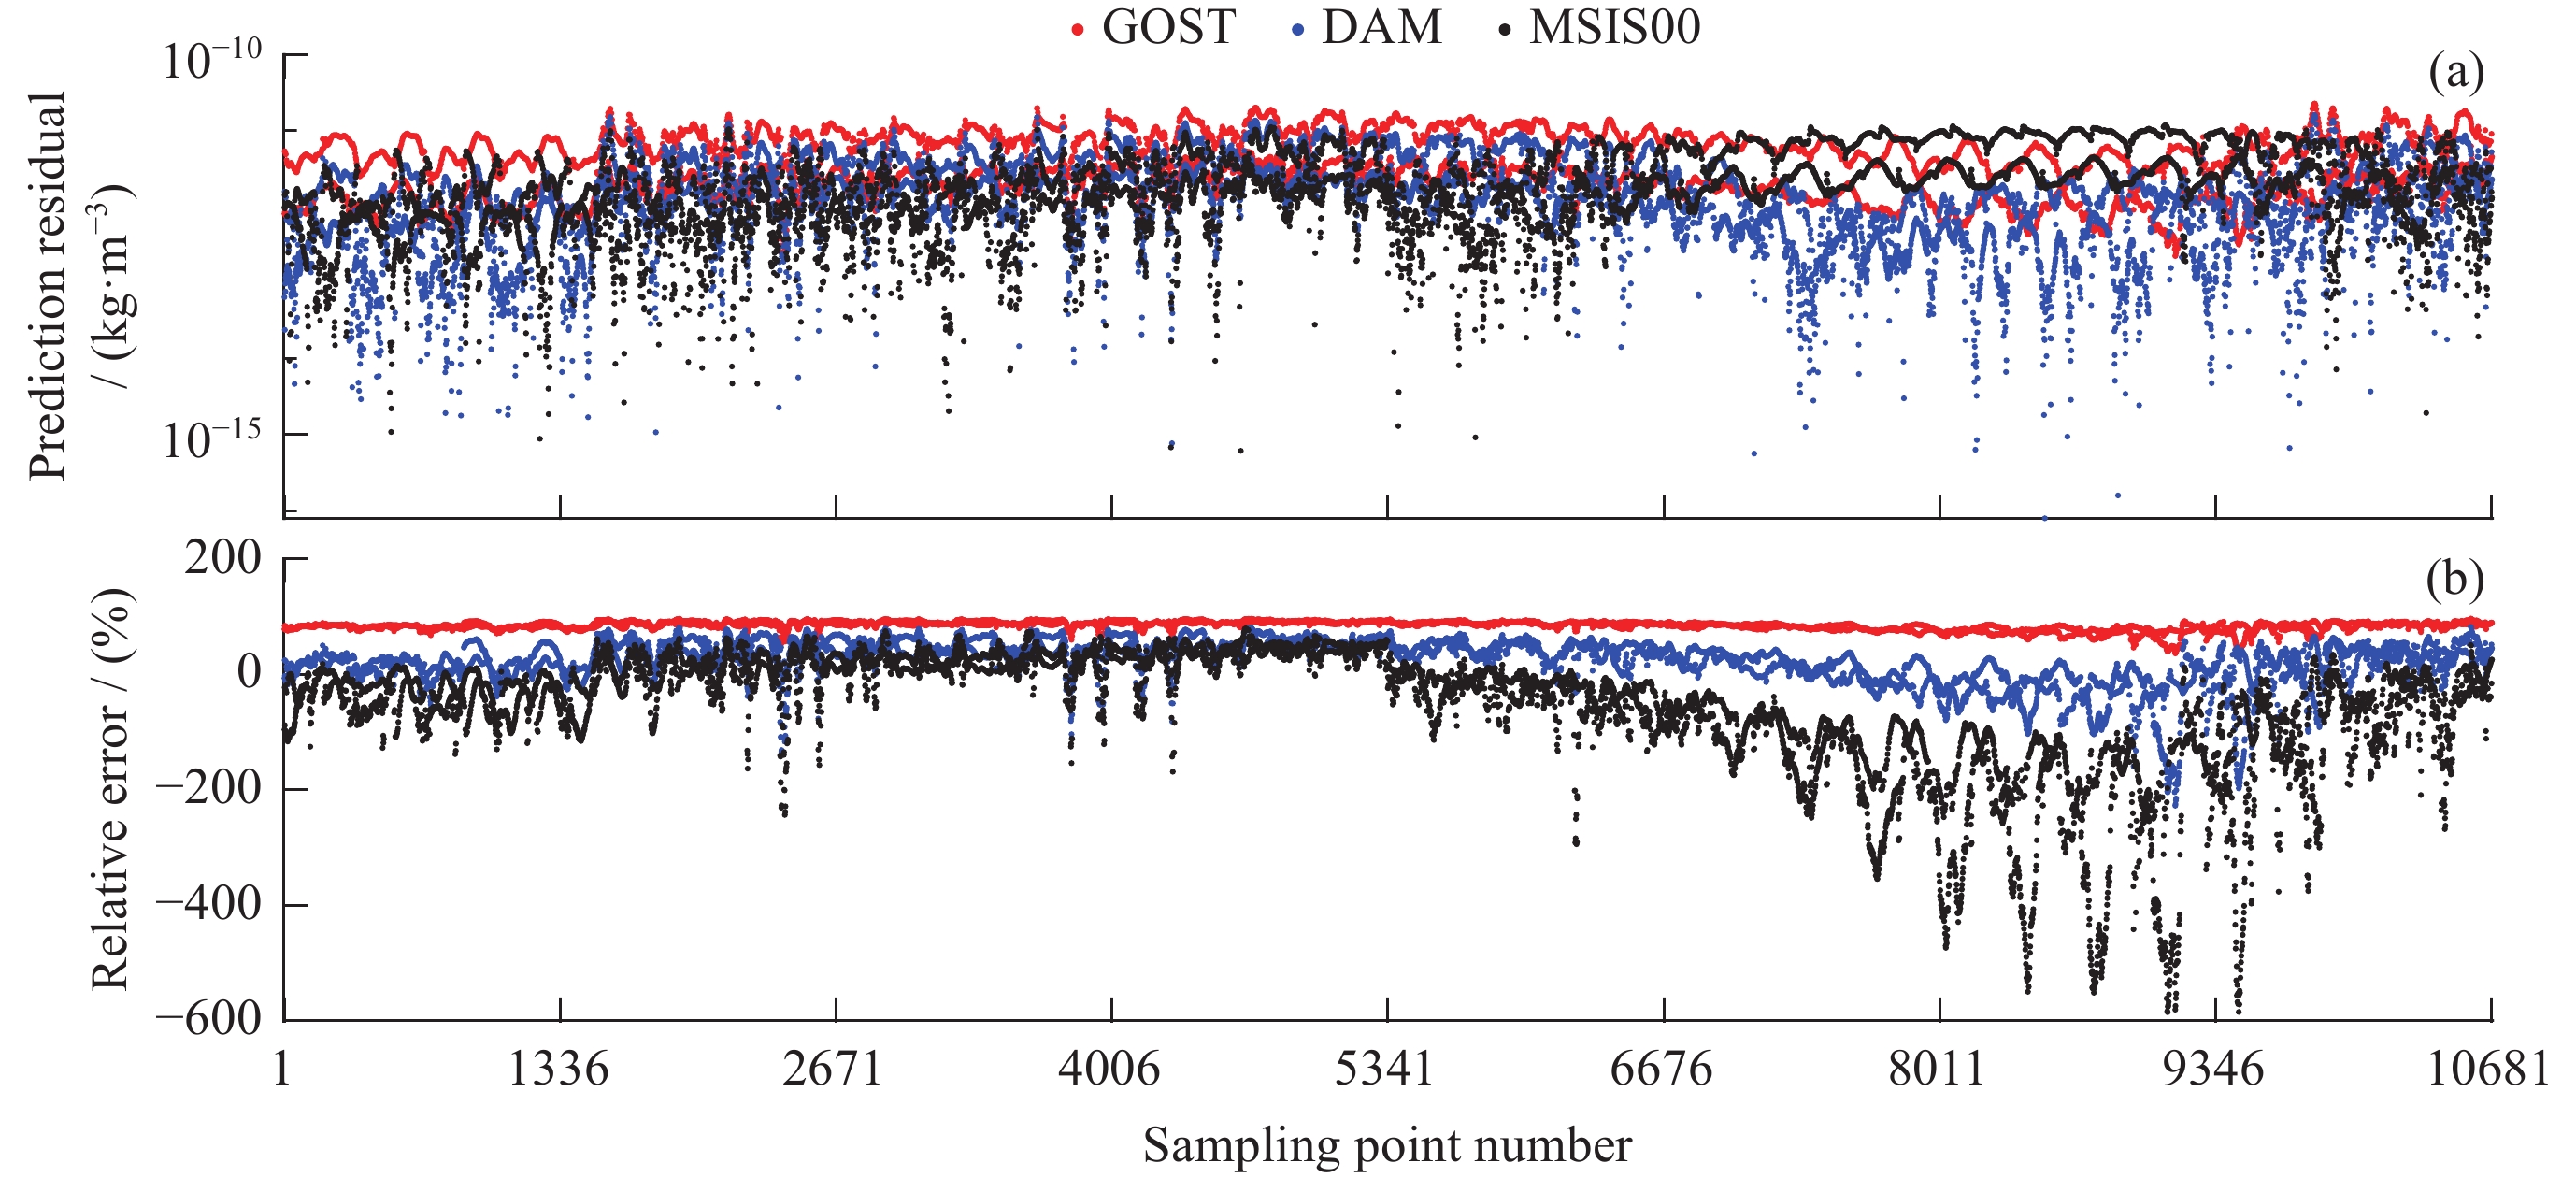
图 1 GOST, DAM和MSIS00模型预报残差(a)和误差百分比(b)
Figure 1. Prediction residual (a) and error percentage (b) of GOST, DAM and MSIS00 model
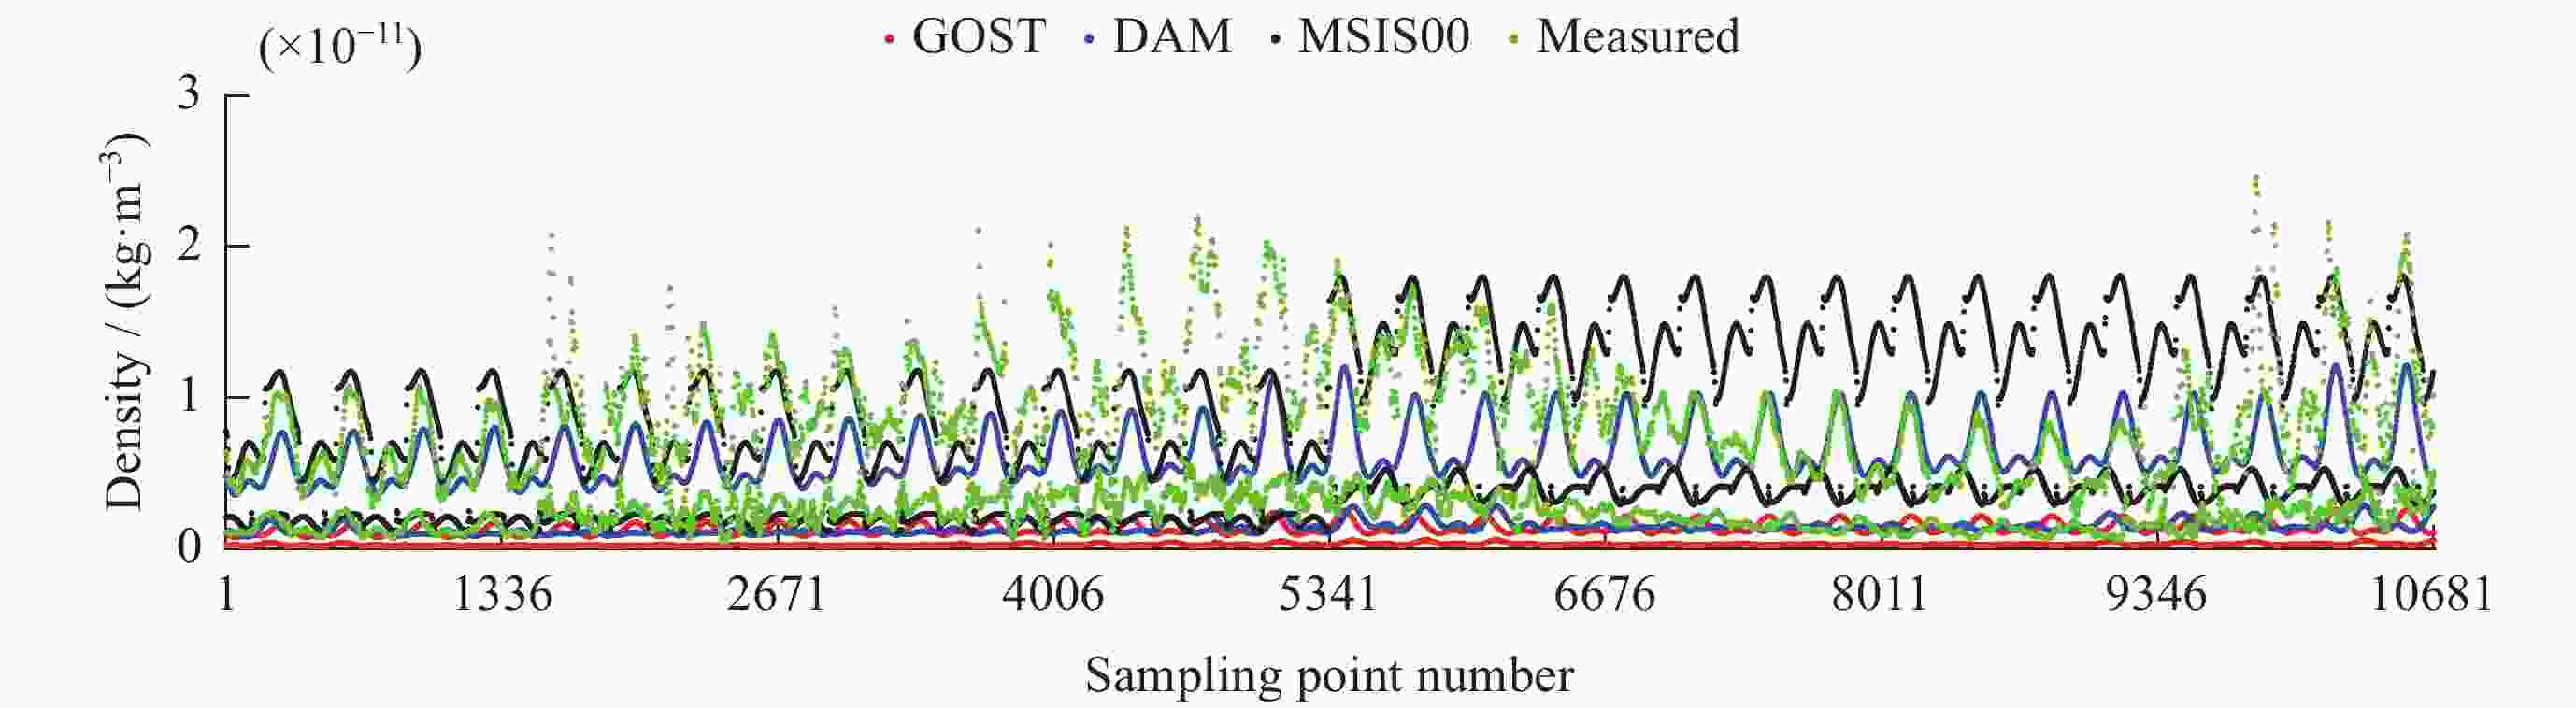
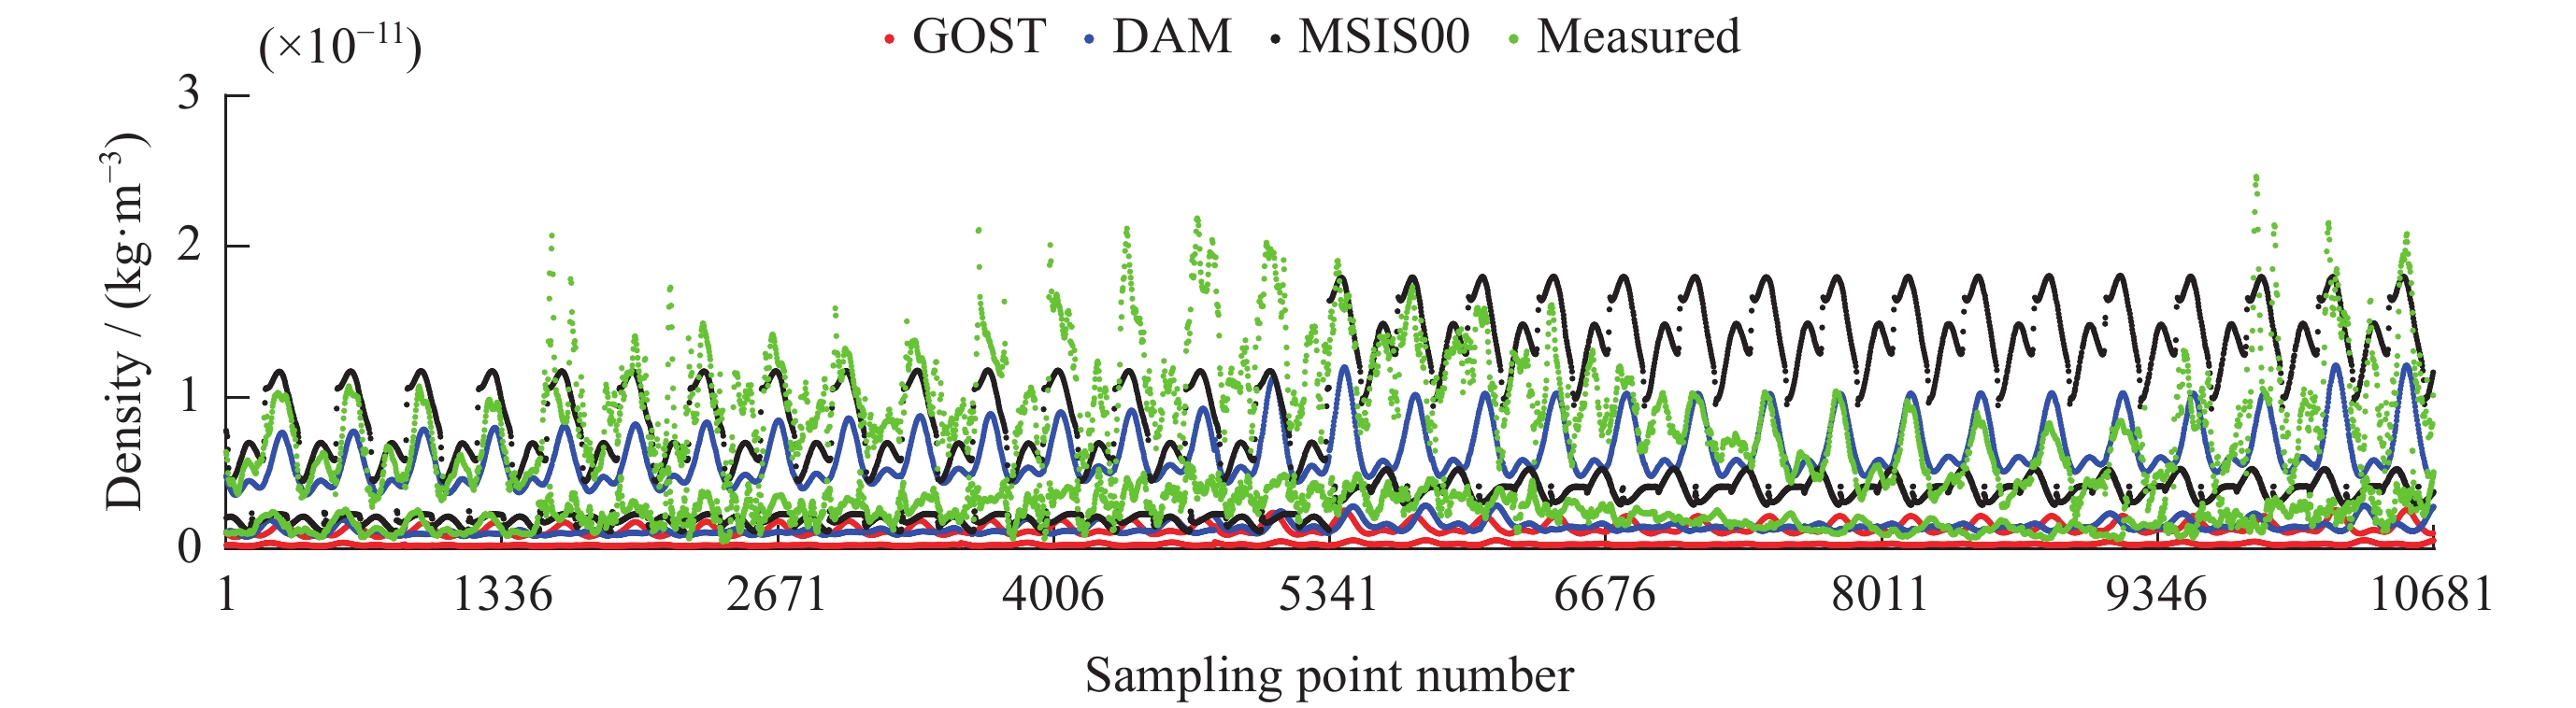
图 2 GOST,DAM,MSIS00模型预报与实测密度
Figure 2. GOST, DAM, MSIS00 model prediction and measured density
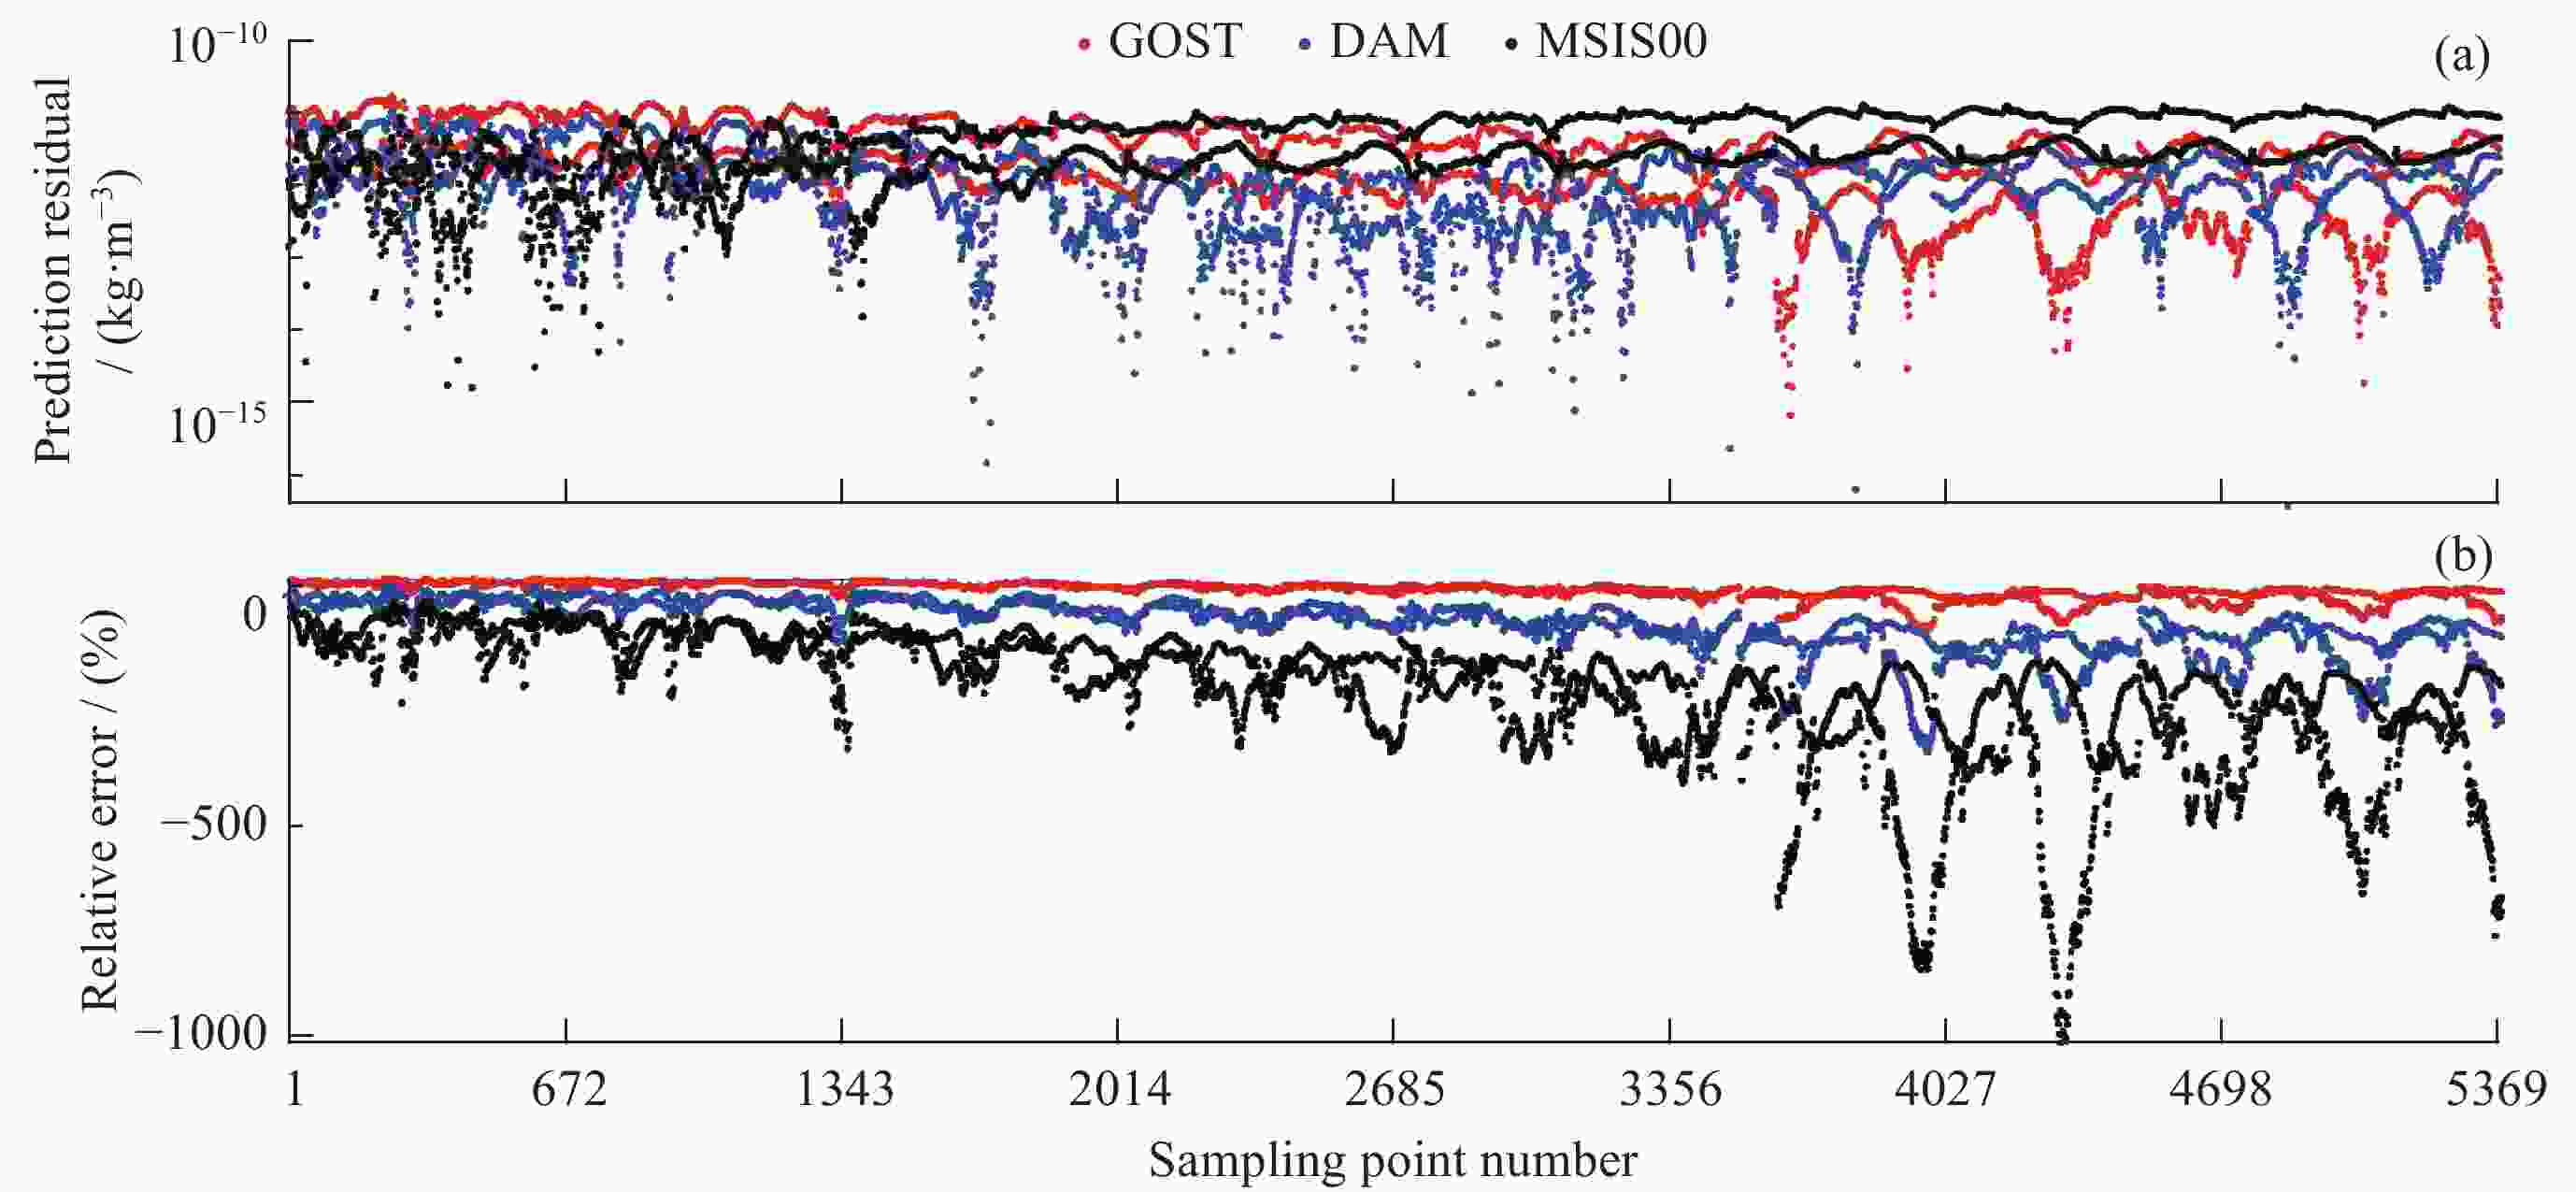
图 3 基于数据集 1 评估的各模型预报残差 (a) 与误差百分比 (b)
Figure 3. Prediction residual (a) and error percentage (b) of each model based on evaluation data set 1

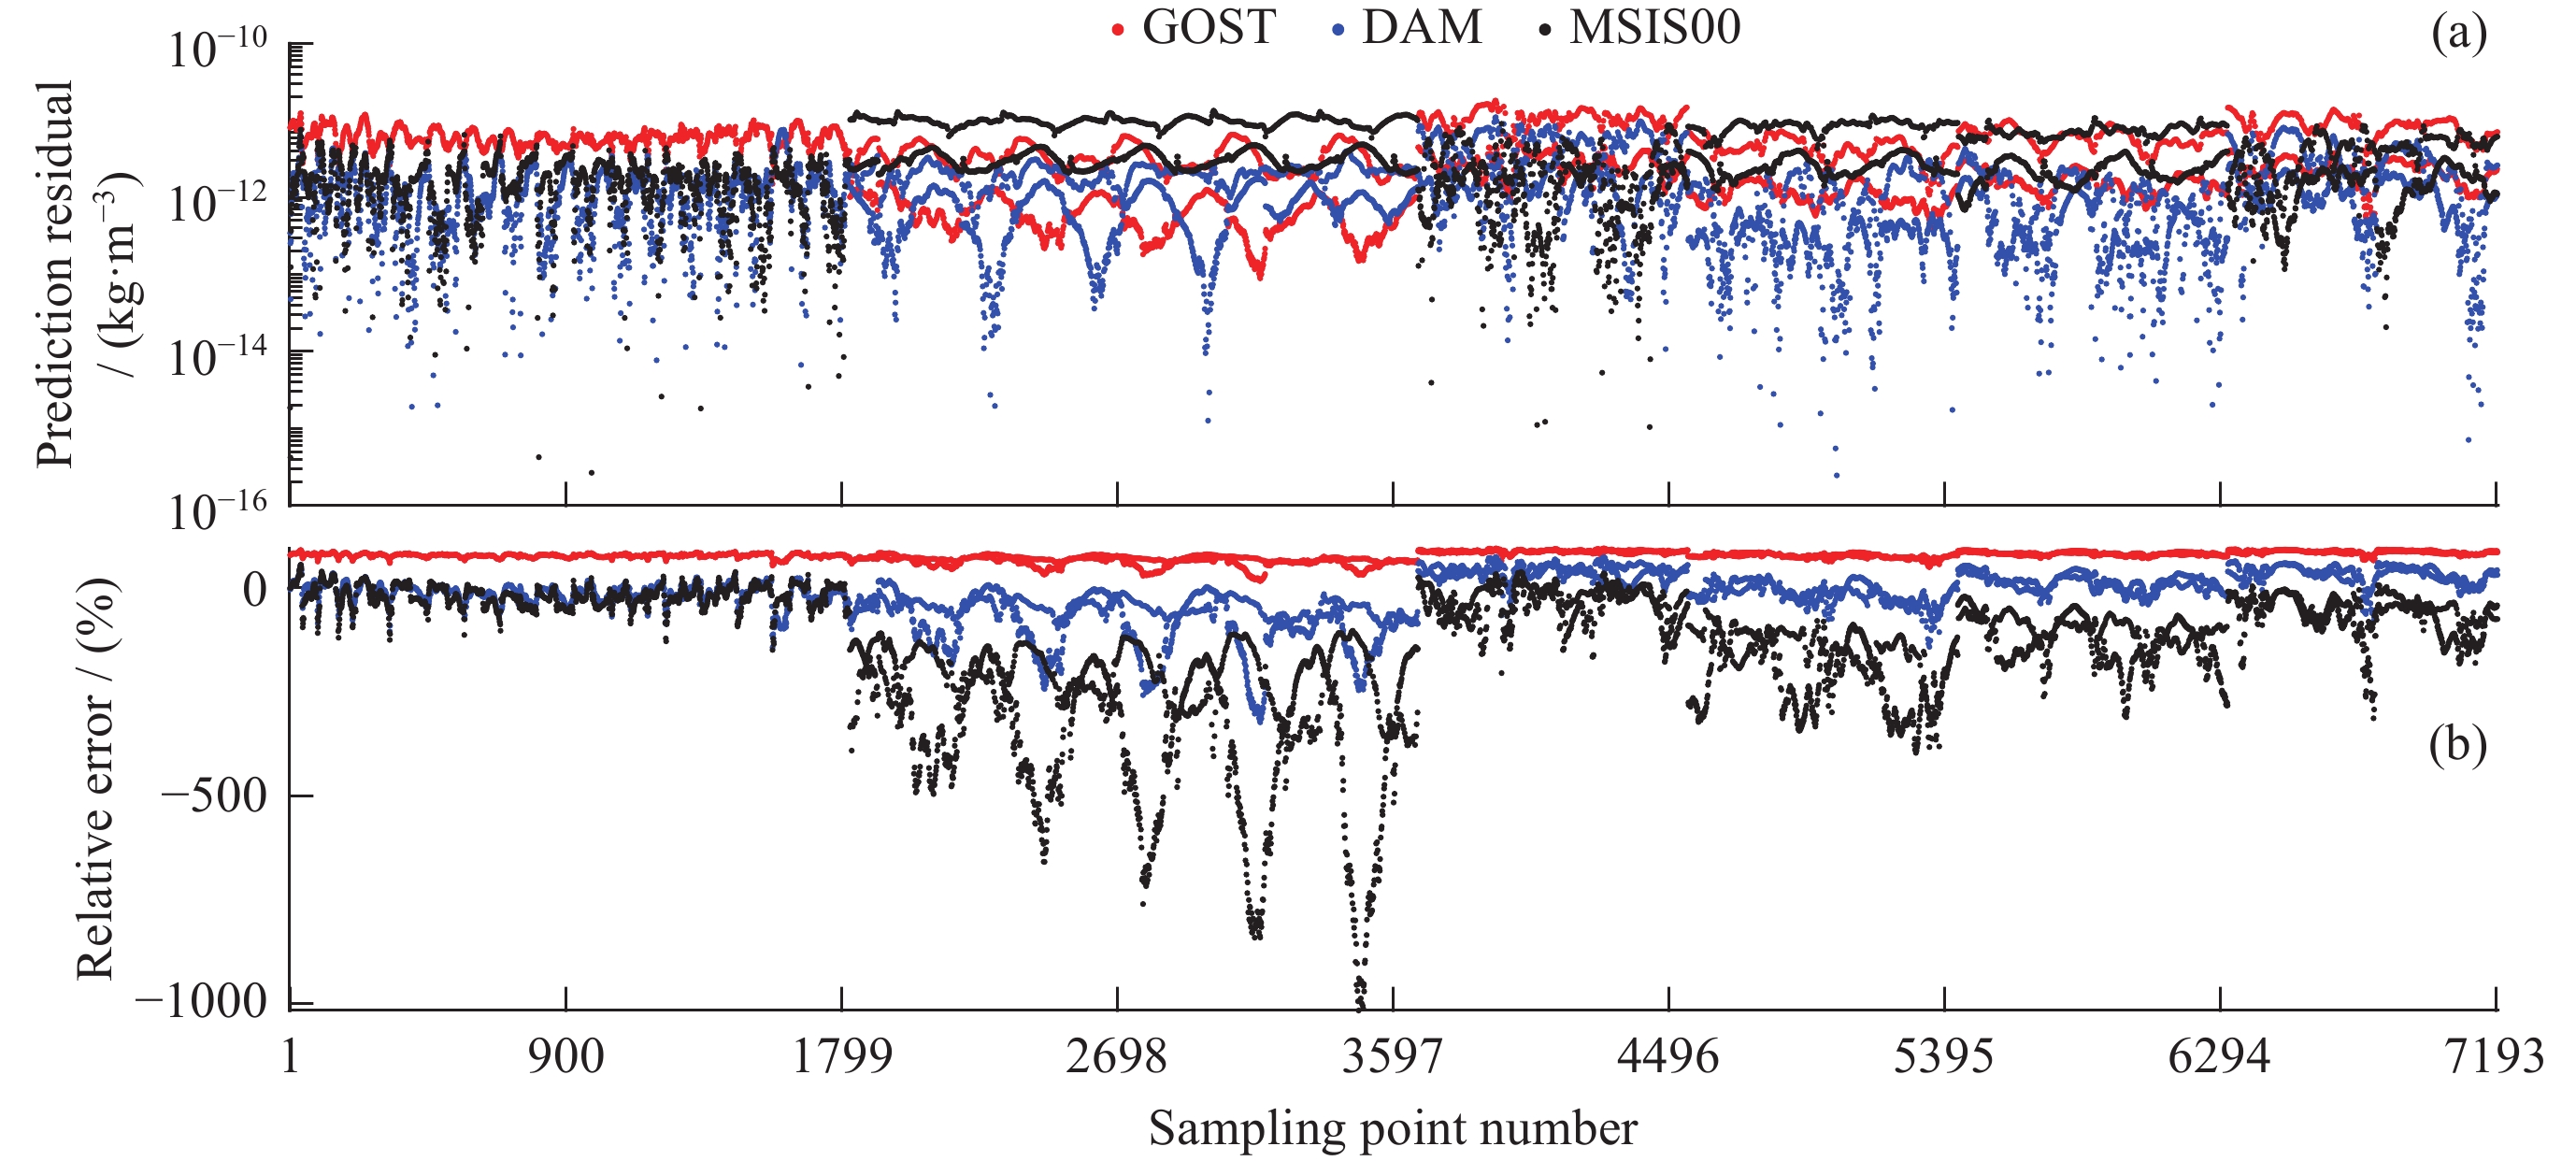
图 4 数据集2评估的GOST,DAM和MSIS00模型预报残差(a)和误差百分比(b)
Figure 4. Prediction residual (a) and error percentage (b) of GOST, DAM and MSIS00 model with evaluation data set 2
表 1 GOST模型参数(180<h<600 km)
Table 1. Parameters of GOST model
F0 75 100 125 150 175 200 250 a1 –1.5560×101 –1.5640×101 –1.522×101 –1.69752×101 –1.7304×101 –1.8266×101 –1.92782×101 a2 8.248×10⁻¹ 7.754×10⁻¹ 7.569×10⁻¹ 6.736×10⁻¹ 6.382×10⁻¹ 5.797×10⁻¹ 5.118×10⁻¹ a3 7.69132×101 6.79162×101 5.58165×101 8.5444×101 8.19596×101 1.009417×101 1.165792×101 d1 –1.721×10⁻¹ –1.721×10⁻¹ –1.721×10⁻¹ –1.721×10⁻¹ –1.721×10⁻¹ –1.721×10⁻¹ –1.721×10⁻¹ d2 5.756×10⁻³ 5.756×10⁻³ 5.756×10⁻³ 5.756×10⁻³ 5.756×10⁻³ 5.756×10⁻³ 5.756×10⁻³ d3 –3.635×10⁻⁶ –3.635×10⁻⁶ –3.635×10⁻⁶ –3.635×10⁻⁶ –3.635×10⁻⁶ –3.635×10⁻⁶ –3.635×10⁻⁶ b1 –8.607×10⁻¹ –7.54×10⁻¹ –5.7×10⁻¹ –4.76×10⁻¹ –2.92×10⁻¹ –3.113×10⁻¹ –3.307×10⁻¹ b2 7.861×10⁻³ 6.85×10⁻³ 5.25×10⁻³ 4.4×10⁻³ 2.80×10⁻³ 2.839×10⁻³ 2.878×10⁻³ b3 –5.711×10⁻⁶ –4.6×10⁻⁶ –3.0×10⁻⁶ –2.40×10⁻⁶ –8.0×10⁻⁶ –1.089×10⁻⁶ –1.378×10⁻⁶ c1 1.2791 1.2791 1.2903 1.2903 2.057×10⁻¹ 2.057×10⁻¹ 1.499×10⁻³ c2 –1.576×10⁻² –1.576×10⁻² –1.547×10⁻² –1.547×10⁻² –2.912×10⁻³ –2.911×10⁻³ –2.399×10⁻⁴ c3 6.499×10⁻⁵ 6.499×10⁻⁵ 5.964×10⁻⁵ 5.964×10⁻⁵ 1.739×10⁻⁵ 1.739×10⁻⁵ 7.006×10⁻⁶ c4 –5.145×10⁻⁸ –5.145×10⁻⁸ –4.503×10⁻⁸ –4.503×10⁻⁸ –8.565×10⁻⁹ –8.565×10⁻⁹ –5.999×10⁻¹⁰ e1 –2.152×10⁻¹ –2.162×10⁻¹ –1.486×10⁻¹ –1.495×10⁻¹ –8.19×10⁻² –8.286×10⁻² –2.048×10⁻¹ e2 4.167×10⁻³ 4.086×10⁻³ 3.263×10⁻³ 3.182×10⁻³ 2.358×10⁻³ 2.278×10⁻³ 3.596×10⁻³ e3 1.587×10⁻⁶ 1.27×10⁻⁶ 3.143×10⁻⁶ 2.825×10⁻⁶ 4.698×10⁻⁶ 4.381×10⁻⁶ –1.587×10⁻⁶ e4 –1.651×10⁻⁹ –1.587×10⁻⁹ –3.429×10⁻⁹ –3.365×10⁻⁹ –5.206×10⁻⁹ –5.143×10⁻⁹ 3.175×10⁻¹⁰ e5 –1.2×10⁻¹ –1.2×10⁻¹ –1.0×10⁻¹ –1.0×10⁻¹ –1.3×10⁻¹ –1.1×10⁻¹ –9.0×10⁻² e6 5.0×10⁻³ 2.5×10⁻² 2.083×10⁻² 2.75×10⁻² 4.389×10⁻² 3.81×10⁻² 3.117×10⁻² e7 1.5×10⁻² 7.5×10⁻³ 6.25×10⁻³ 3.75×10⁻³ 1.821×10⁻³ 1.178×10⁻³ 9.662×10⁻⁴ l1 –1.698×10⁻² –1.249×10⁻² –7.879×10⁻³ –4.882×10⁻³ –5.195×10⁻³ –5.017×10⁻³ –5.455×10⁻³ l2 1.448×10⁻⁴ 1.111×10⁻⁴ 7.258×10⁻⁵ 4.692×10⁻⁵ 4.664×10⁻⁵ 4.282×10⁻⁵ 4.273×10⁻⁵ l3 –9.535×10⁻⁸ –7.706×10⁻⁸ –3.658×10⁻⁸ –1.742×10⁻⁸ –2.164×10⁻⁸ –2.132×10⁻⁸ –2.273×10⁻⁸  下载: 导出CSV
表 2 GOST模型半周年效应相关参数
Table 2. Parameters related to the semi-annual effect
d A(d) d A(d) d A(d) 0 –0.028 130 0.013 260 0.015 10 –0.045 140 –0.037 270 0.07 20 –0.047 150 –0.086 280 0.115 30 –0.035 160 –0.128 290 0.144 40 –0.011 170 –0.162 300 0.155 50 0.022 180 –0.185 310 0.145 60 0.057 190 –0.199 320 0.120 70 0.090 200 –0.202 330 0.084 80 0.114 210 –0.193 340 0.044 90 0.125 220 –0.173 350 0.006 100 0.118 230 –0.140 360 –0.023 110 0.096 240 –0.096 370 –0.04 120 0.060 250 –0.042 - -
下载: 导出CSV
表 3 GOST与DAM模型系数
Table 3. Parameters comparison of GOST and DAM
参数 $ \mathrm{G}\mathrm{O}\mathrm{S}\mathrm{T} $ $ \mathrm{D}\mathrm{A}\mathrm{M} $ 参数 $ \mathrm{G}\mathrm{O}\mathrm{S}\mathrm{T} $ $ \mathrm{D}\mathrm{A}\mathrm{M} $ a1 18.266 –17.37078425 n0 1.5 1.5 a2 0.5797 0.54020803 n1 0.006 0.006 a3 10.09417 10.09417 e1 –0.08286 –0.086750778 d1 –0.1721 –0.1721 e2 0.002278 0.002907369 d2 0.005756 0.005756 e3 4.38×10⁻⁶ 5.43×10⁻⁶ d3 –3.64×10⁻⁶ –3.64×10⁻⁶ e4 –5.14×10⁻⁹ –3.98×10⁻⁹ l1 –0.005017 –0.005017 e5 –0.11 –0.11880196 l2 4.28×10⁻⁵ 4.28×10⁻⁵ e6 0.0381 0.030412034 l3 –2.13×10⁻⁸ –2.13×10⁻⁸ e7 0.001178 0.000911514 c1 0.2057 0.2057 b1 –0.3113 –0.385954838 c2 –0.002911 –0.002911 b2 0.002839 0.002566231 c3 1.74×10⁻⁵ 1.74×10⁻⁵ b3 –1.09×10⁻⁶ –1.34×10⁻⁶ c4 –8.57×10⁻⁹ –8.57×10⁻⁹ $ {\varphi }_{B} $ 0.5585 0.5585 注 黑色字体表示建模确定的 12 个待估参数。
下载: 导出CSV
表 4 基于校正数据集评估的地磁扰动期模型预报性能
Table 4. Performance of each model in disturbed period based on correction data set
模型名称 相对误差均值μ/(%) 相对误差标准差σ/(%) GOST 84.99 7.66 MSIS00 –57.84 108.20 DAM 24.94 38.38
下载: 导出CSV
表 5 基于数据集 1 评估的地磁扰动期各模型预报性能
Table 5. Performance of each model in disturbed period based on evaluation data set 1
模型名称 相对误差均值μ/(%) 相对误差标准差σ/(%) GOST 64.32 20.22 MSIS00 –176.72 161.35 DAM –14.83 63.70
下载: 导出CSV
表 6 基于数据集 2 评估的地磁扰动期各模型预报性能
Table 6. Performance of each model in disturbed period based on evaluation data set 2
模型名称 相对误差均值μ/(%) 相对误差标准差σ/(%) GOST 77.44 11.10 MSIS00 –136.74 155.91 DAM –14.14 56.31
下载: 导出CSV
-
[1] PRIESTER W, RÖEMER M, VOLLAND H. The physical behavior of the upper atmosphere deduced from satellite drag data[J]. Space Science Reviews, 1967, 6(6): 707-780 [2] HARRIS I, PRIESTER W. Time-dependent structure of the upper atmosphere[J]. Journal of the Atmospheric Sciences, 1962, 19(4): 286-301 doi: 10.1175/1520-0469(1962)019<0286:TDSOTU>2.0.CO;2 [3] JACCHIA L G. Static diffusion models of the upper atmosphere with empirical temperature profiles[J]. Smithsonian Contributions to Astrophysics, 1965, 8(9): 213-257 doi: 10.5479/si.00810231.8-9.213 [4] BOWMAN B R, TOBISKA W K, MARCOS F A, et al. A new empirical thermospheric density model JB2008 using new solar and geomagnetic indices[C]//Proceedings of the AIAA/AAS Astrodynamics Specialist Conference and Exhibit. Honolulu: AIAA, 2008 [5] MARCOS F A. Accuracy of atmospheric drag models at low satellite altitudes[J]. Advances in Space Research, 1990, 10(3/4): 417-422 [6] GRANHOLM G R. Near-real time atmospheric density model correction using space catalog data[R]. Cambridge: Massachusetts Institute of Technology, 2000 [7] 吴连大. 人造卫星与空间碎片的轨道和探测[M]. 北京: 中国科学技术出版社, 2011WU Lianda. Orbiting and Detection of Artificial Satellites and Space Debris[M]. Beijing: Science and Technology of China Press, 2011 [8] ZHANG Y, YU J J, CHEN J Y, et al. An empirical atmospheric density calibration model based on long short-term memory neural network[J]. Atmosphere, 2021, 12(7): 925 doi: 10.3390/atmos12070925 [9] 李勰, 唐歌实, 李正, 等. 基于温度参数的经验密度模式修正方法[J]. 载人航天, 2015, 21(1): 48-52,90 doi: 10.3969/j.issn.1674-5825.2015.01.009LI Xie, TANG Geshi, LI Zheng, et al. A method for calibrating empirical density model based on temperature parameters[J]. Manned Spaceflight, 2015, 21(1): 48-52,90 doi: 10.3969/j.issn.1674-5825.2015.01.009 [10] RUAN H B, LEI J H, DOU X K, et al. An exospheric temperature model based on CHAMP observations and TIEGCM simulations[J]. Space Weather, 2018, 16(2): 147-156 doi: 10.1002/2017SW001759 [11] 刘卫, 龚建村, 刘四清, 等. HASDM修正方法分析与评估[J]. 空间科学学报, 2019, 39(5): 638-647 doi: 10.11728/cjss2019.05.638LIU Wei, GONG Jiancun, LIU Siqing, et al. Analysis and evaluation of high accuracy satellite drag model[J]. Chinese Journal of Space Science, 2019, 39(5): 638-647 doi: 10.11728/cjss2019.05.638 [12] QIAN L Y, BURNS A, EMERY B A, et al. The NCAR TIE-GCM: a community model of the coupled thermosphere/ionosphere system[M]//HUBA J, SCHUNK R, KHAZANOV G. Modeling the Ionosphere–Thermosphere System. Washington: John Wiley & Sons, 2014: 73-84 [13] BOUGHER S W, BLELLY P L, COMBI M, et al. Neutral upper atmosphere and ionosphere modeling[J]. Space Science Reviews, 2008, 139(1/2/3/4): 107-141 [14] DICKINSON R E, RIDLEY E C, ROBLE R G. A three-dimensional general circulation model of the thermosphere[J]. Journal of Geophysical Research: Space Physics, 1981, 86(A3): 1499-1512 doi: 10.1029/JA086iA03p01499 [15] SUTTON E K. A new method of physics-based data assimilation for the quiet and disturbed thermosphere[J]. Space Weather, 2018, 16(6): 736-753 doi: 10.1002/2017SW001785 [16] DOORNBOS E. Thermospheric Density and Wind Determination from Satellite Dynamics[M]. Heidelberg: Springer, 2012 [17] EMMERT J T, DROB D P, PICONE J M, et al. NRLMSIS 2.0: A whole-atmosphere empirical model of temperature and neutral species densities[J]. Earth and Space Science, 2021, 8(3): e2020EA001321 [18] BRUINSMA S, BONIFACE C. The operational and research DTM-2020 thermosphere models[J]. Journal of Space Weather and Space Climate, 2021, 11: 47 doi: 10.1051/swsc/2021032 [19] EMMERT J T. Thermospheric mass density: a review[J]. Advances in Space Research, 2015, 56(5): 773-824 doi: 10.1016/j.asr.2015.05.038 [20] CEFOLA P, VOLKOV I, SUEVALOV V. Description of the russian upper atmosphere density model GOST-2004[C]//37 th COSPAR Scientific Assembly. Montréal: COSPAR, 2008 [21] VALLADO D A, MCCLAIN W D. Fundamentals of Astrodynamics and Applications[M]. Dordrecht: Kluwer Academic Publishers, 2001 [22] 刘卫, 王荣兰, 刘四清, 等. 典型热层密度模式误差分析[J]. 空间科学学报, 2017, 37(5): 538-546 doi: 10.11728/cjss2017.05.538LIU Wei, WANG Ronglan, LIU Siqing, et al. Error analysis of typical atmospheric density model[J]. Chinese Journal of Space Science, 2017, 37(5): 538-546 doi: 10.11728/cjss2017.05.538 [23] 刘卫. 热层大气模型动态修正建模与应用[D]. 北京: 中国科学院大学, 2022LIU Wei. Modeling and application of Dynamic Calibration Atmosphere[D]. Beijing: University of Chinese Academy of Sciences, 2022 [24] 刘卫, 刘四清, 龚建村, 等. 基于高斯分布的密度误差对航天器轨道的影响分析[J]. 空间碎片研究, 2019, 19(2): 10-17LIU Wei, LIU Siqing, GONG Jiancun, et al. Analysis of effect of gauss distribution density error on spacecraft orbit[J]. Space Debris Research, 2019, 19(2): 10-17 -
-

 下载:
下载:

计量
- 文章访问数: 1113
- HTML全文浏览量: 657
- PDF下载量: 65
-
被引次数:
0(来源:Crossref)
0(来源:其他)

