


An Improved HVQ Algorithm for Compression and Rendering of Space Environment Volume Data with Multi-correlated Variables
doi: 10.11728/cjss2023.04.2022-0020 cstr: 32142.14.cjss2023.04.2022-0020
-
Abstract: Volume visualization can not only illustrate overall distribution but also inner structure and it is an important approach for space environment research. Space environment simulation can produce several correlated variables at the same time. However, existing compressed volume rendering methods only consider reducing the redundant information in a single volume of a specific variable, not dealing with the redundant information among these variables. For space environment volume data with multi-correlated variables, based on the HVQ-1d method we propose a further improved HVQ method by compositing variable-specific levels to reduce the redundant information among these variables. The volume data associated with each variable is divided into disjoint blocks of size 43 initially. The blocks are represented as two levels, a mean level and a detail level. The variable-specific mean levels and detail levels are combined respectively to form a larger global mean level and a larger global detail level. To both global levels, a splitting based on a principal component analysis is applied to compute initial codebooks. Then, LBG algorithm is conducted for codebook refinement and quantization. We further take advantage of progressive rendering based on GPU for real-time interactive visualization. Our method has been tested along with HVQ and HVQ-1d on high-energy proton flux volume data, including > 5, > 10, > 30 and > 50 MeV integrated proton flux. The results of our experiments prove that the method proposed in this paper pays the least cost of quality at compression, achieves a higher decompression and rendering speed compared with HVQ and provides satisficed fidelity while ensuring interactive rendering speed.
-
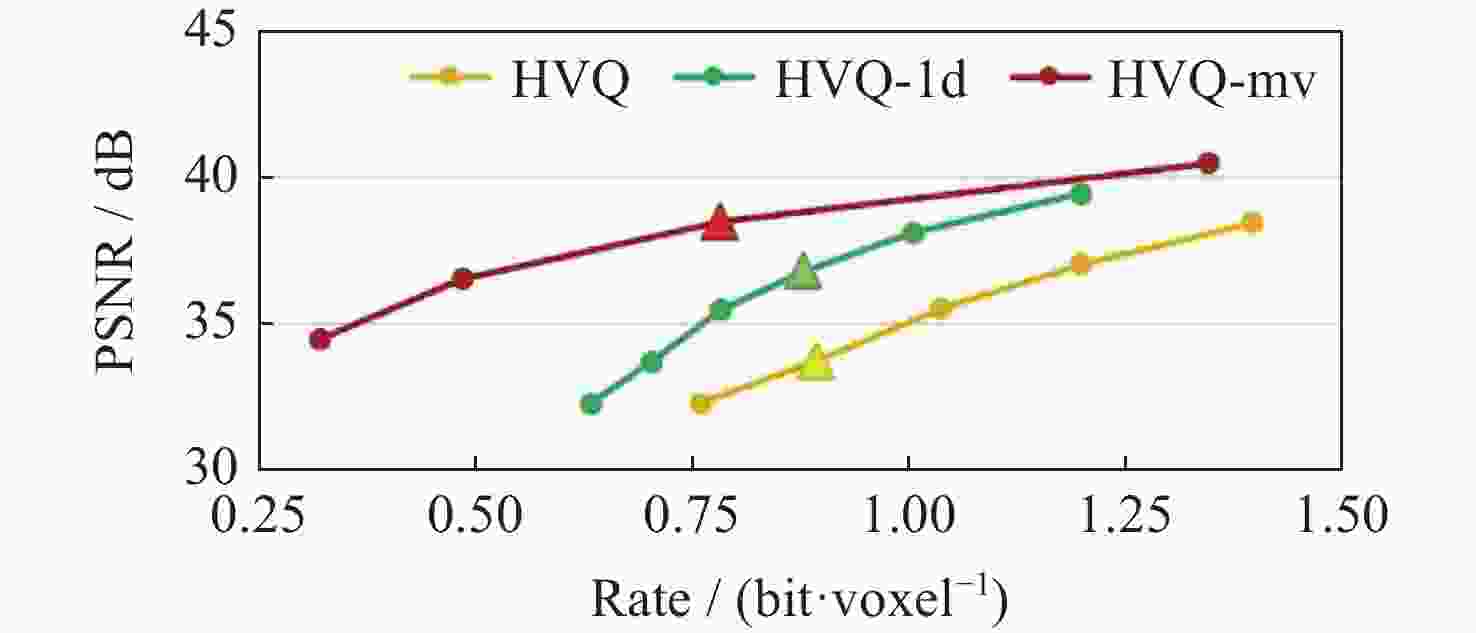
Figure 2. Rate-distortion curves for all variables of PRB with HVQ, HVQ-1 d and HVQ-mv (Triangles label the points of HVQ, HVQ-1 d and HVQ-mv at rates 0.89, 0.88 and 0.78)
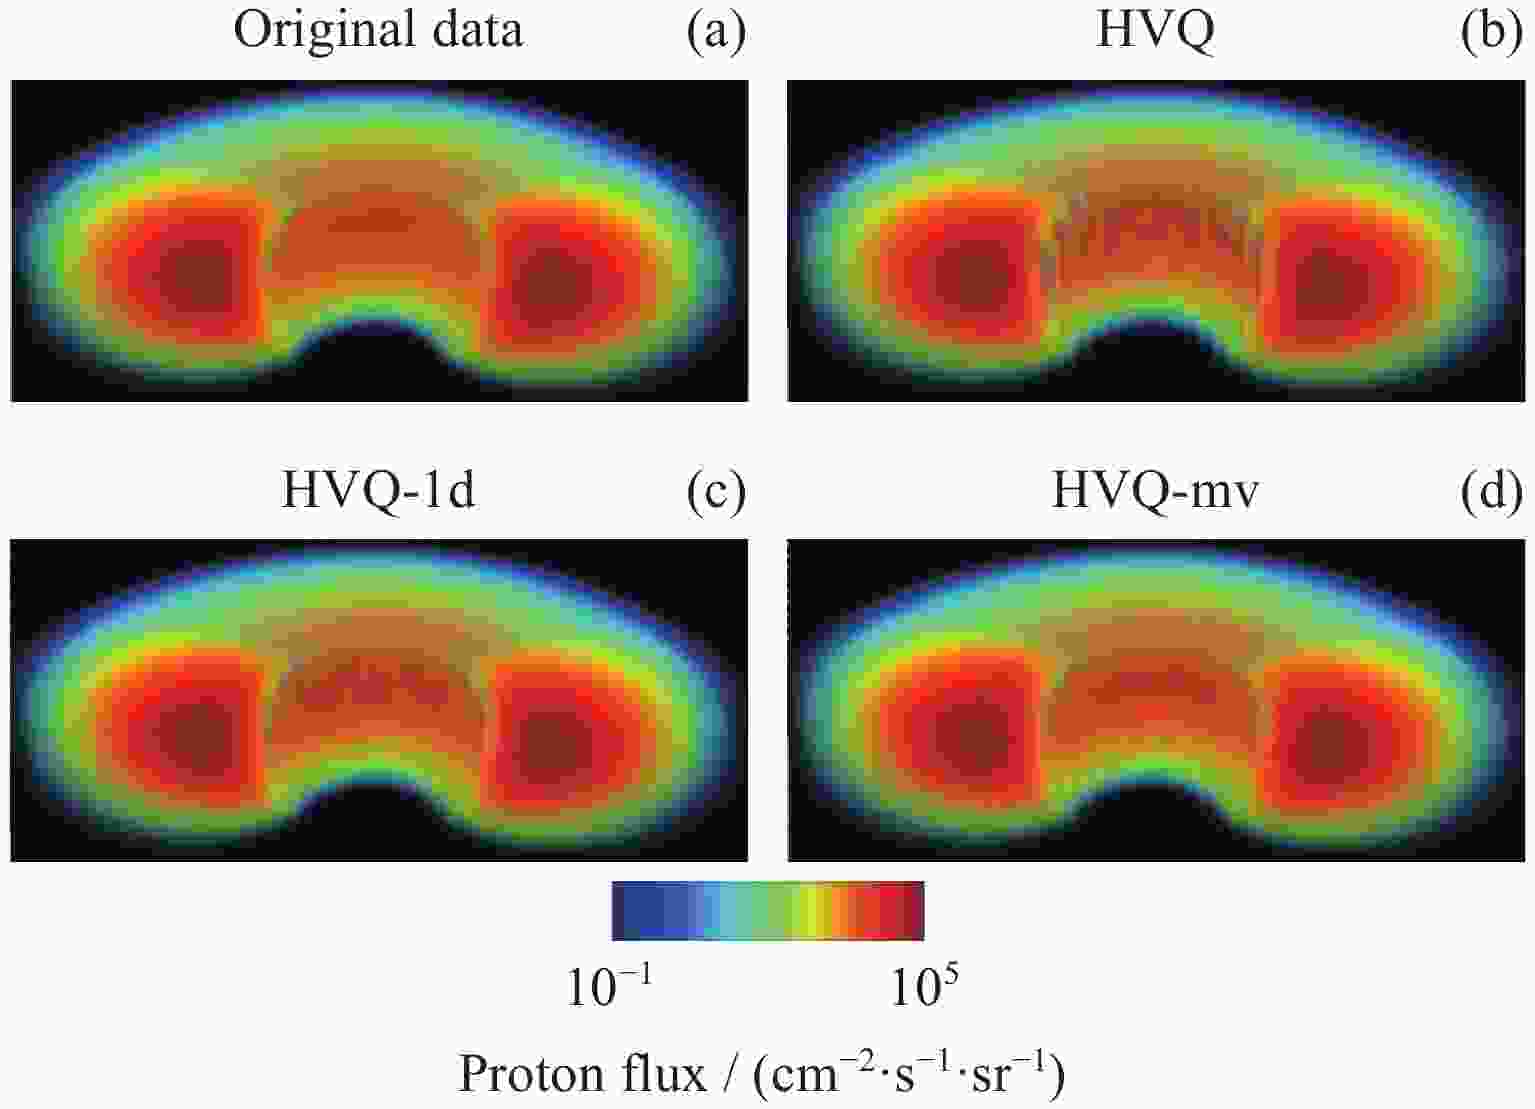
Figure 3. Compression quality comparison of rendering > 5 MeV flux of PRB using HVQ, HVQ-1 d and HVQ-mv
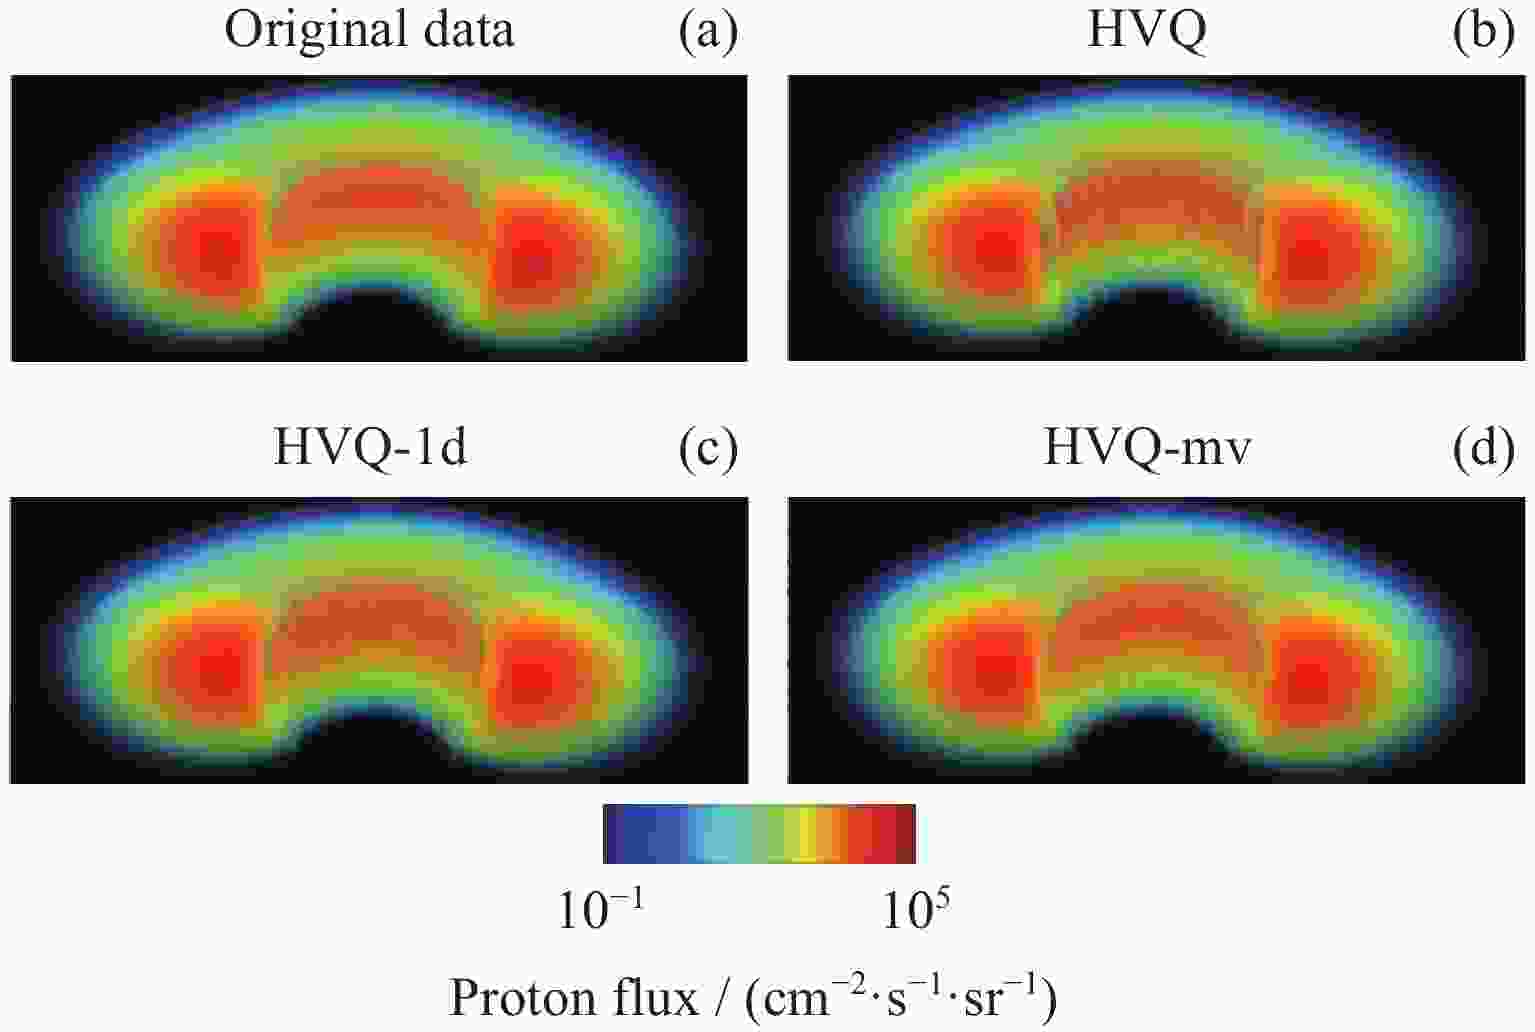
Figure 4. Compression quality comparison of rendering > 10 MeV flux of PRB using HVQ, HVQ-1 d and HVQ-mv
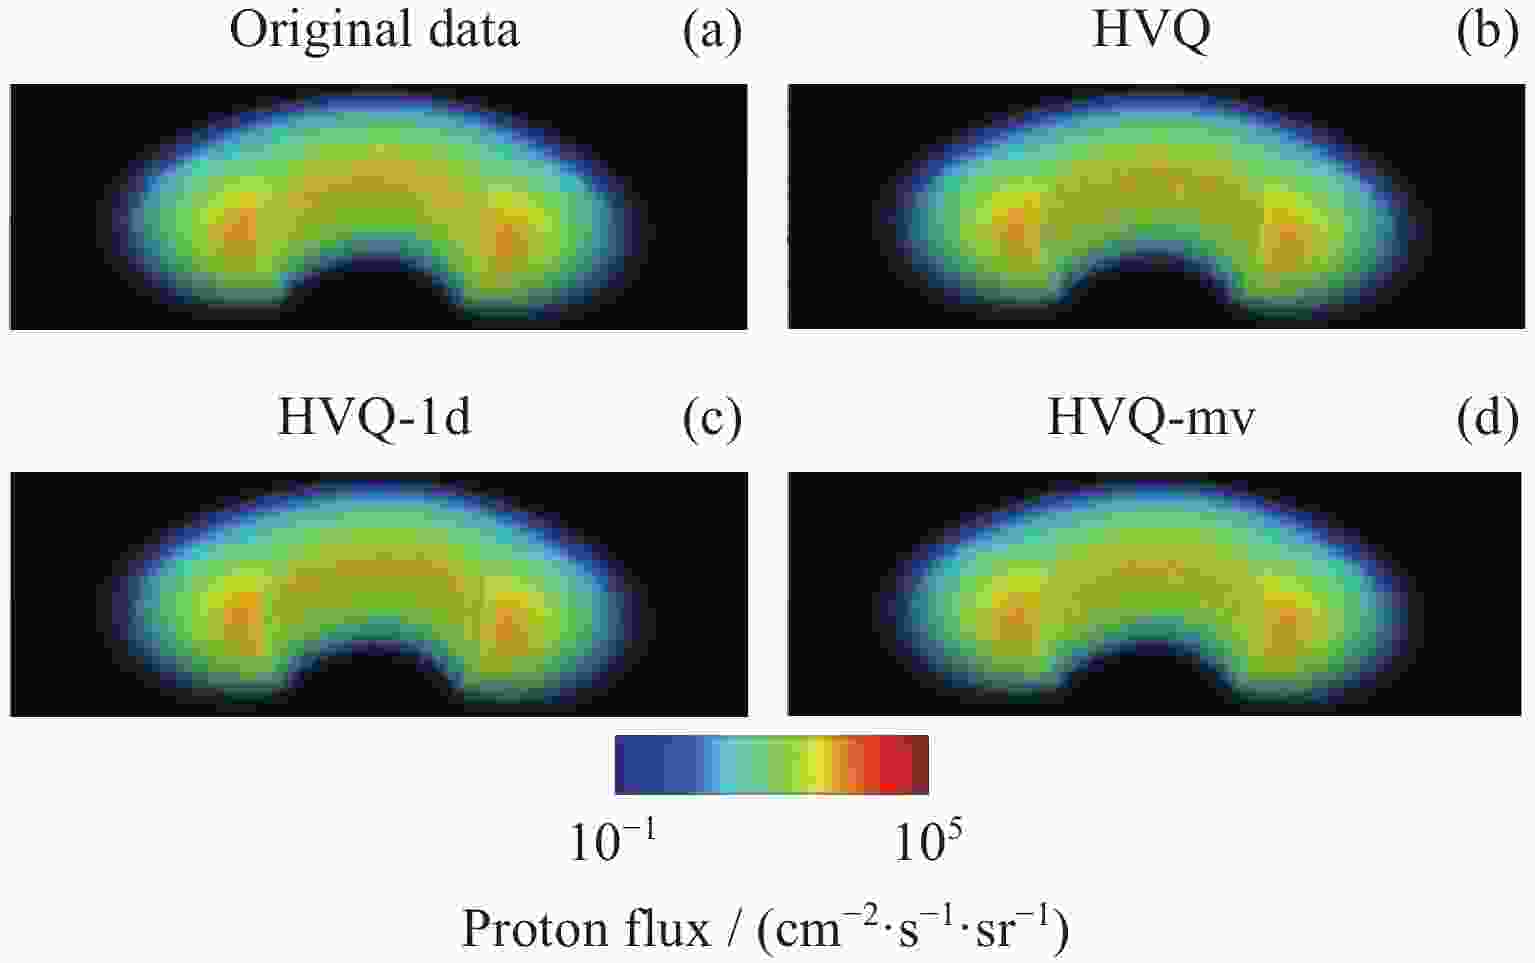
Figure 5. Compression quality comparison of rendering > 30 MeV flux of PRB using HVQ, HVQ-1 d and HVQ-mv
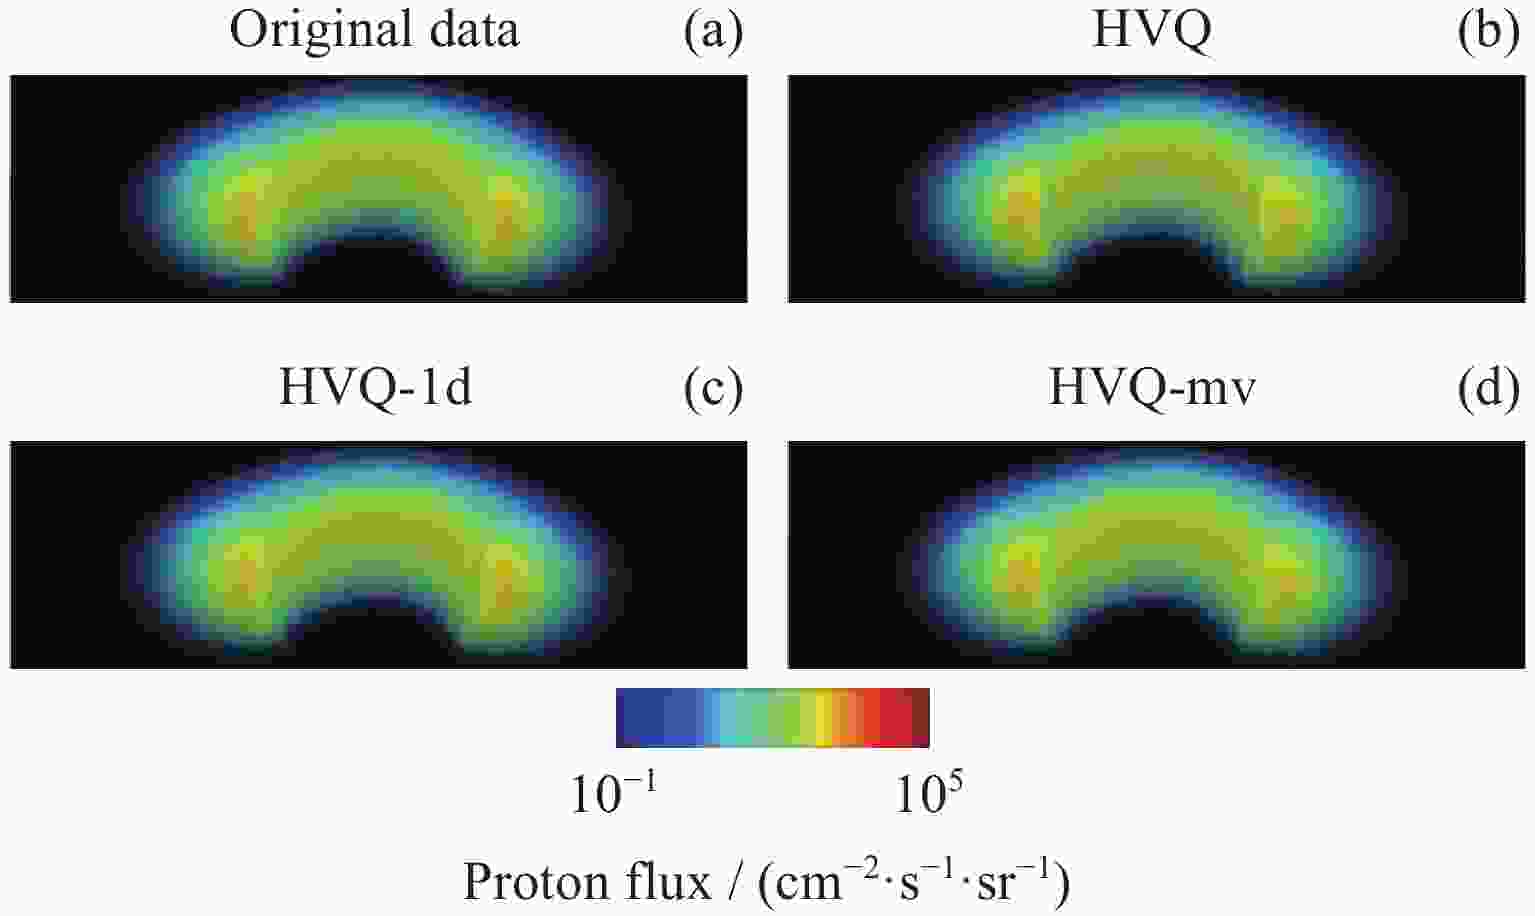
Figure 6. Compression quality comparison of rendering > 50 MeV flux of PRB using HVQ, HVQ-1 d and HVQ-mv
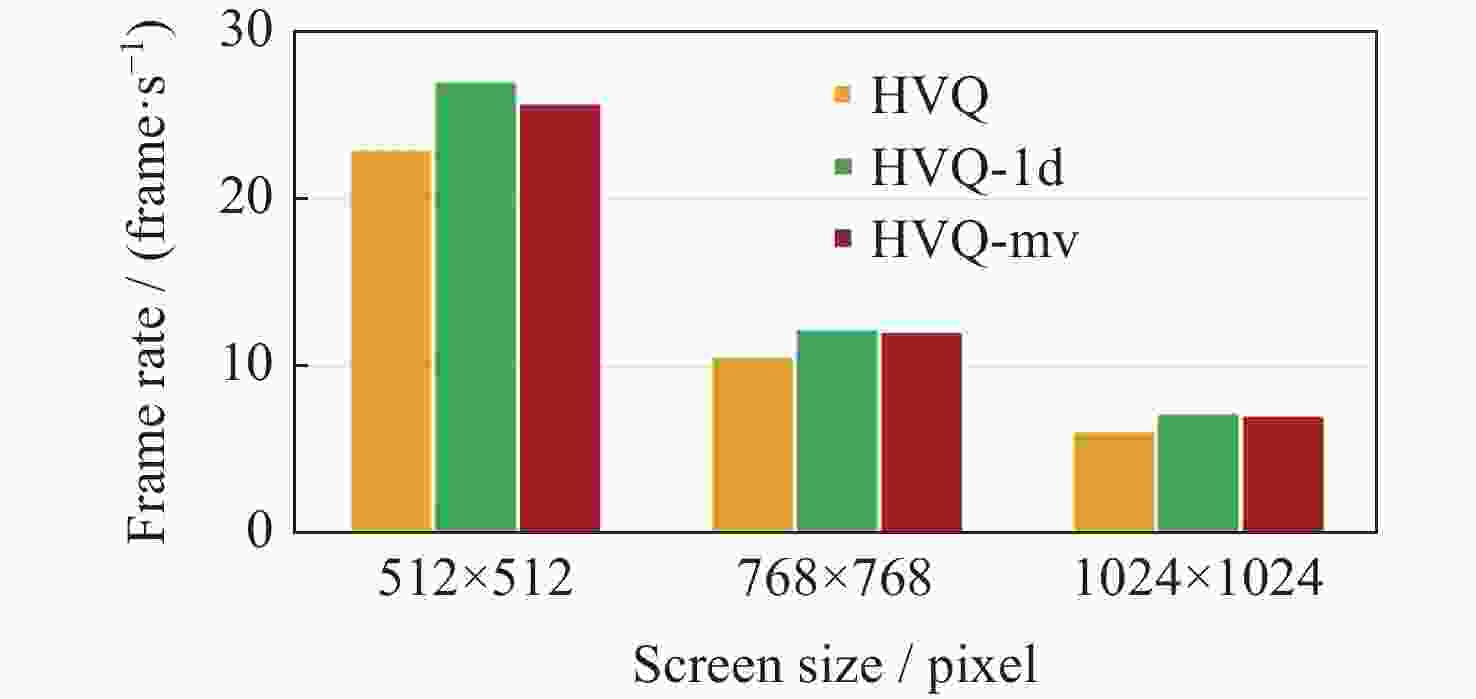
Figure 7. Efficiency comparison of rendering PRB directly from volumes compressed by HVQ, HVQ-1 d and HVQ-mv
-
[1] BAO L L, CAI Y X, CUI Y M, et al. Compression and rendering of space environment volume data based on improved HVQ algorithm[J]. Journal of Physics:Conference Series, 2020, 1627: 012025 doi: 10.1088/1742-6596/1627/1/012025 [2] BAO L L, CAI Y X, LIN R L, et al. A weight based hierarchical vector quantization algorithm for space environment volume data[J]. Chinese Journal of Space Science, 2021, 41(3): 425-430 doi: 10.11728/cjss2021.03.425 [3] PIROTTI F, BROVELLI M A, PRESTIFILIPPO G, et al. An open source virtual globe rendering engine for 3 D applications: NASA world wind[J]. Open Geospatial Data, Software and Standards, 2017, 2: 4 doi: 10.1186/s40965-017-0016-5 [4] WANG S, WANG H Y, WU Y D, et al. Improved VolumeLIC rendering technology of 3 D vector field based on GPU acceleration[J]. Journal of Computer-Aided Design & Computer Graphics, 2016, 28(5): 723-732 [5] WANG C, ZHANG X G, XU X F, et al. The lunar and deep space environment exploration in China[J]. Journal of Deep Space Exploration, 2019, 6(2): 105-118 [6] WU Z B, YU J Q. Vector quantization: a review[J]. Frontiers of Information Technology & Electronic Engineering, 2019, 20(4): 507-524 [7] FOUT N, MA K L. Transform coding for hardware-accelerated volume rendering[J]. IEEE Transactions on Visualization and Computer Graphics, 2007, 13(6): 1600-1607 doi: 10.1109/TVCG.2007.70516 [8] NING P, HESSELINK L. Vector quantization for volume rendering[C]//Proceedings of 1992 Workshop on Volume Visualization. Boston: ACM, 1992: 69-74 [9] SCHNEIDER J, WESTERMANN R. Compression domain volume rendering[C]//Proceedings of IEEE Visualization. Seattle: IEEE, 2003: 293-300 [10] ZHAO L P, YUE G X, XIAO D G, et al. 2011 A content-based classified hierarchical vector quantization algorithm for volume compression[J]. Journal of Software, 2011, 6(2): 322-330 [11] YU S, ZHANG S Z, WANG K Q, et al. An efficient and fast GPU based algorithm for visualizing large volume of 4 D data from virtual heart simulations[J]. Biomedical Signal Processing and Control, 2017, 35: 8-18 doi: 10.1016/j.bspc.2017.01.015 [12] LINDE Y, BUZO A, GRAY R. An algorithm for vector quantizer design[J]. IEEE Transactions on Communications, 1980, 28(1): 84-95 doi: 10.1109/TCOM.1980.1094577 [13] MIAO J, LI Z T, REN T L, et al. Statistical analysis on four kinds of space weather events during solar cycles 21~24[J]. Chinese Journal of Space Science, 2021, 41(6): 849-857 doi: 10.11728/cjss2021.06.849 -
-

 下载:
下载:


计量
- 文章访问数: 630
- HTML全文浏览量: 245
- PDF下载量: 20
-
被引次数:
0(来源:Crossref)
0(来源:其他)

