


磁暴期间OI 135.6 nm气辉经纬及高度分布的变化特征
doi: 10.11728/cjss2023.05.2023-0022 cstr: 32142.14.cjss2023.05.2023-0022
Variation in the Longitude-latitude Distribution and Latitude-altitude Distribution of OI 135.6 nm Airglow during Magnetic Storms
-
摘要: 利用GUVI探测器观测的OI 135.6 nm气辉辐射数据,研究了2003年10月和11月两次持续时间不同的强磁暴期间气辉辐射强度经纬度分布及纬度–高度分布的变化。结果表明,全球大部分区域内OI 135.6 nm气辉辐射强度在磁暴期间会随着Dst指数的降低而增强,与磁暴的剧烈程度呈现准正相关关系。从纬度上看,气辉辐射强度的增强会由磁静期的磁赤道两侧附近向高纬地区延伸至南北半球50°附近,增幅基本在80%以上,最大可超过200%,且经纬度分布在磁暴期间的变化情况呈现出南北不对称性和纬向不对称性;从高度上看,气辉辐射强度的增强会由磁静期的300~400 km(即电离层F2层高度)扩散至其他高度,特别是在100~200 km(即低热层高度)的部分纬度上会出现相比其他高度更为显著的增强,增幅超过300%;气辉辐射出现增强的时间与磁暴相位基本同步。Abstract: Variation in the latitude-longitude distribution and latitude-height distribution of airglow emission intensity during two intense magnetic storms in October and November 2003 were investigated using OI 135.6 nm airglow emission data observed by the GUVI detector. The results show that the intensity of OI 135.6 nm airglow emission in most regions of the world increases with a decrease in the Dst index during the magnetic storms and shows a quasi-positive correlation with the intensity of magnetic storms. Horizontally, the enhancement of airglow emission extends from both sides of the magnetic equator during the magnetic quiescence to the high latitudes to near 50° in the northern and southern hemispheres, and the increase is basically more than 80%, and the maximum can exceed 200%, and the variation of latitude and longitude distribution during the magnetic storms show north-south and latitudinal asymmetry. Vertically, the enhancement of the airglow emission spreads from 300 km to 400 km (i.e., F2 layer height) to other heights, especially at some latitudes between 100 km to 200 km (i.e., low thermosphere height), which is more significant than other heights, with an increase of more than 300%; the time of the enhancement of the airglow emission is basically synchronized with the magnetic storm phase.
-
Key words:
- FUV airglow /
- GUVI /
- Magnetic storms /
- Longitude-latitude distribution /
- Altitude distribution
-
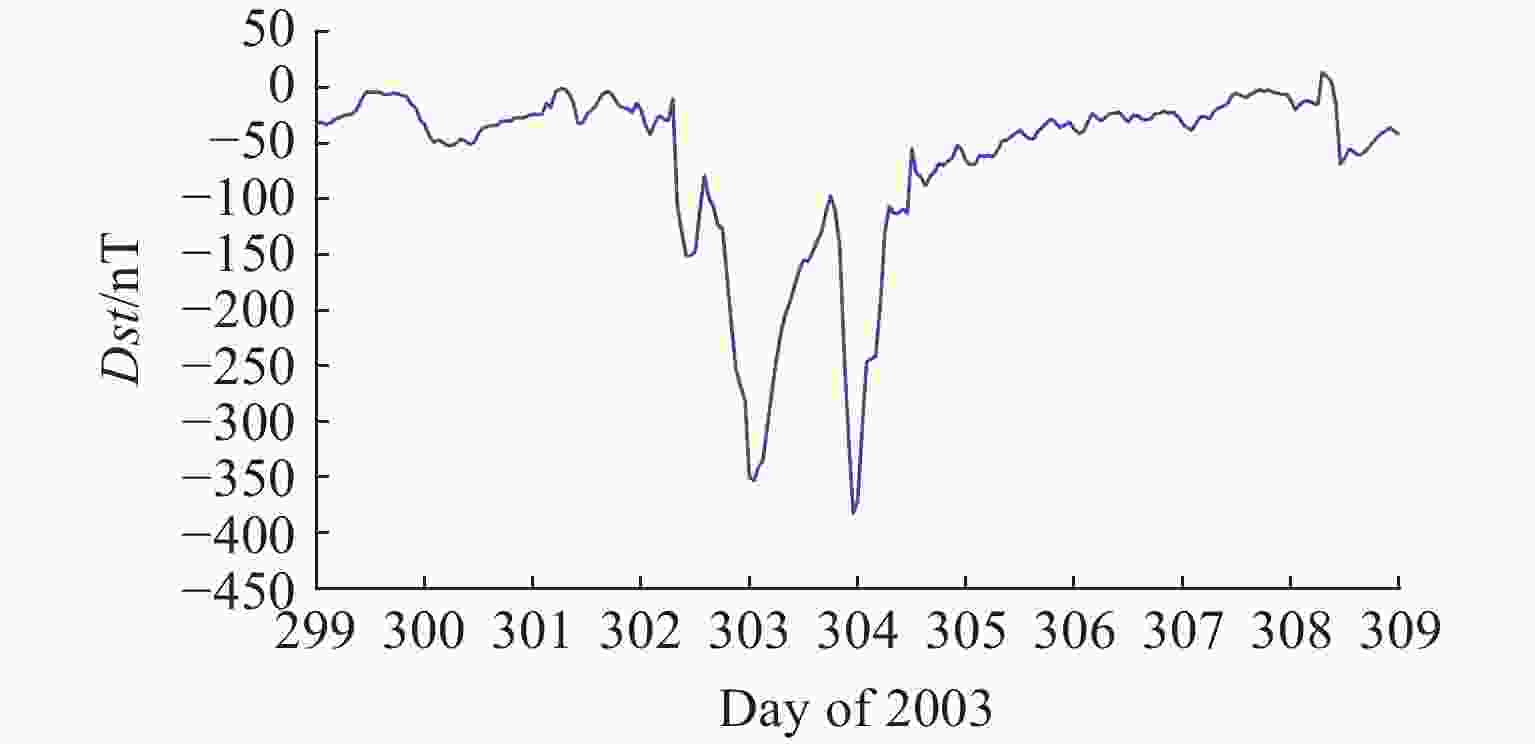
图 1 2003年10月26日(第299日)至11月4日(第308日)Dst指数的变化情况
Figure 1. Variation of the Dst index from 26 October (Day 299) to 4 November (Day 308) in 2003
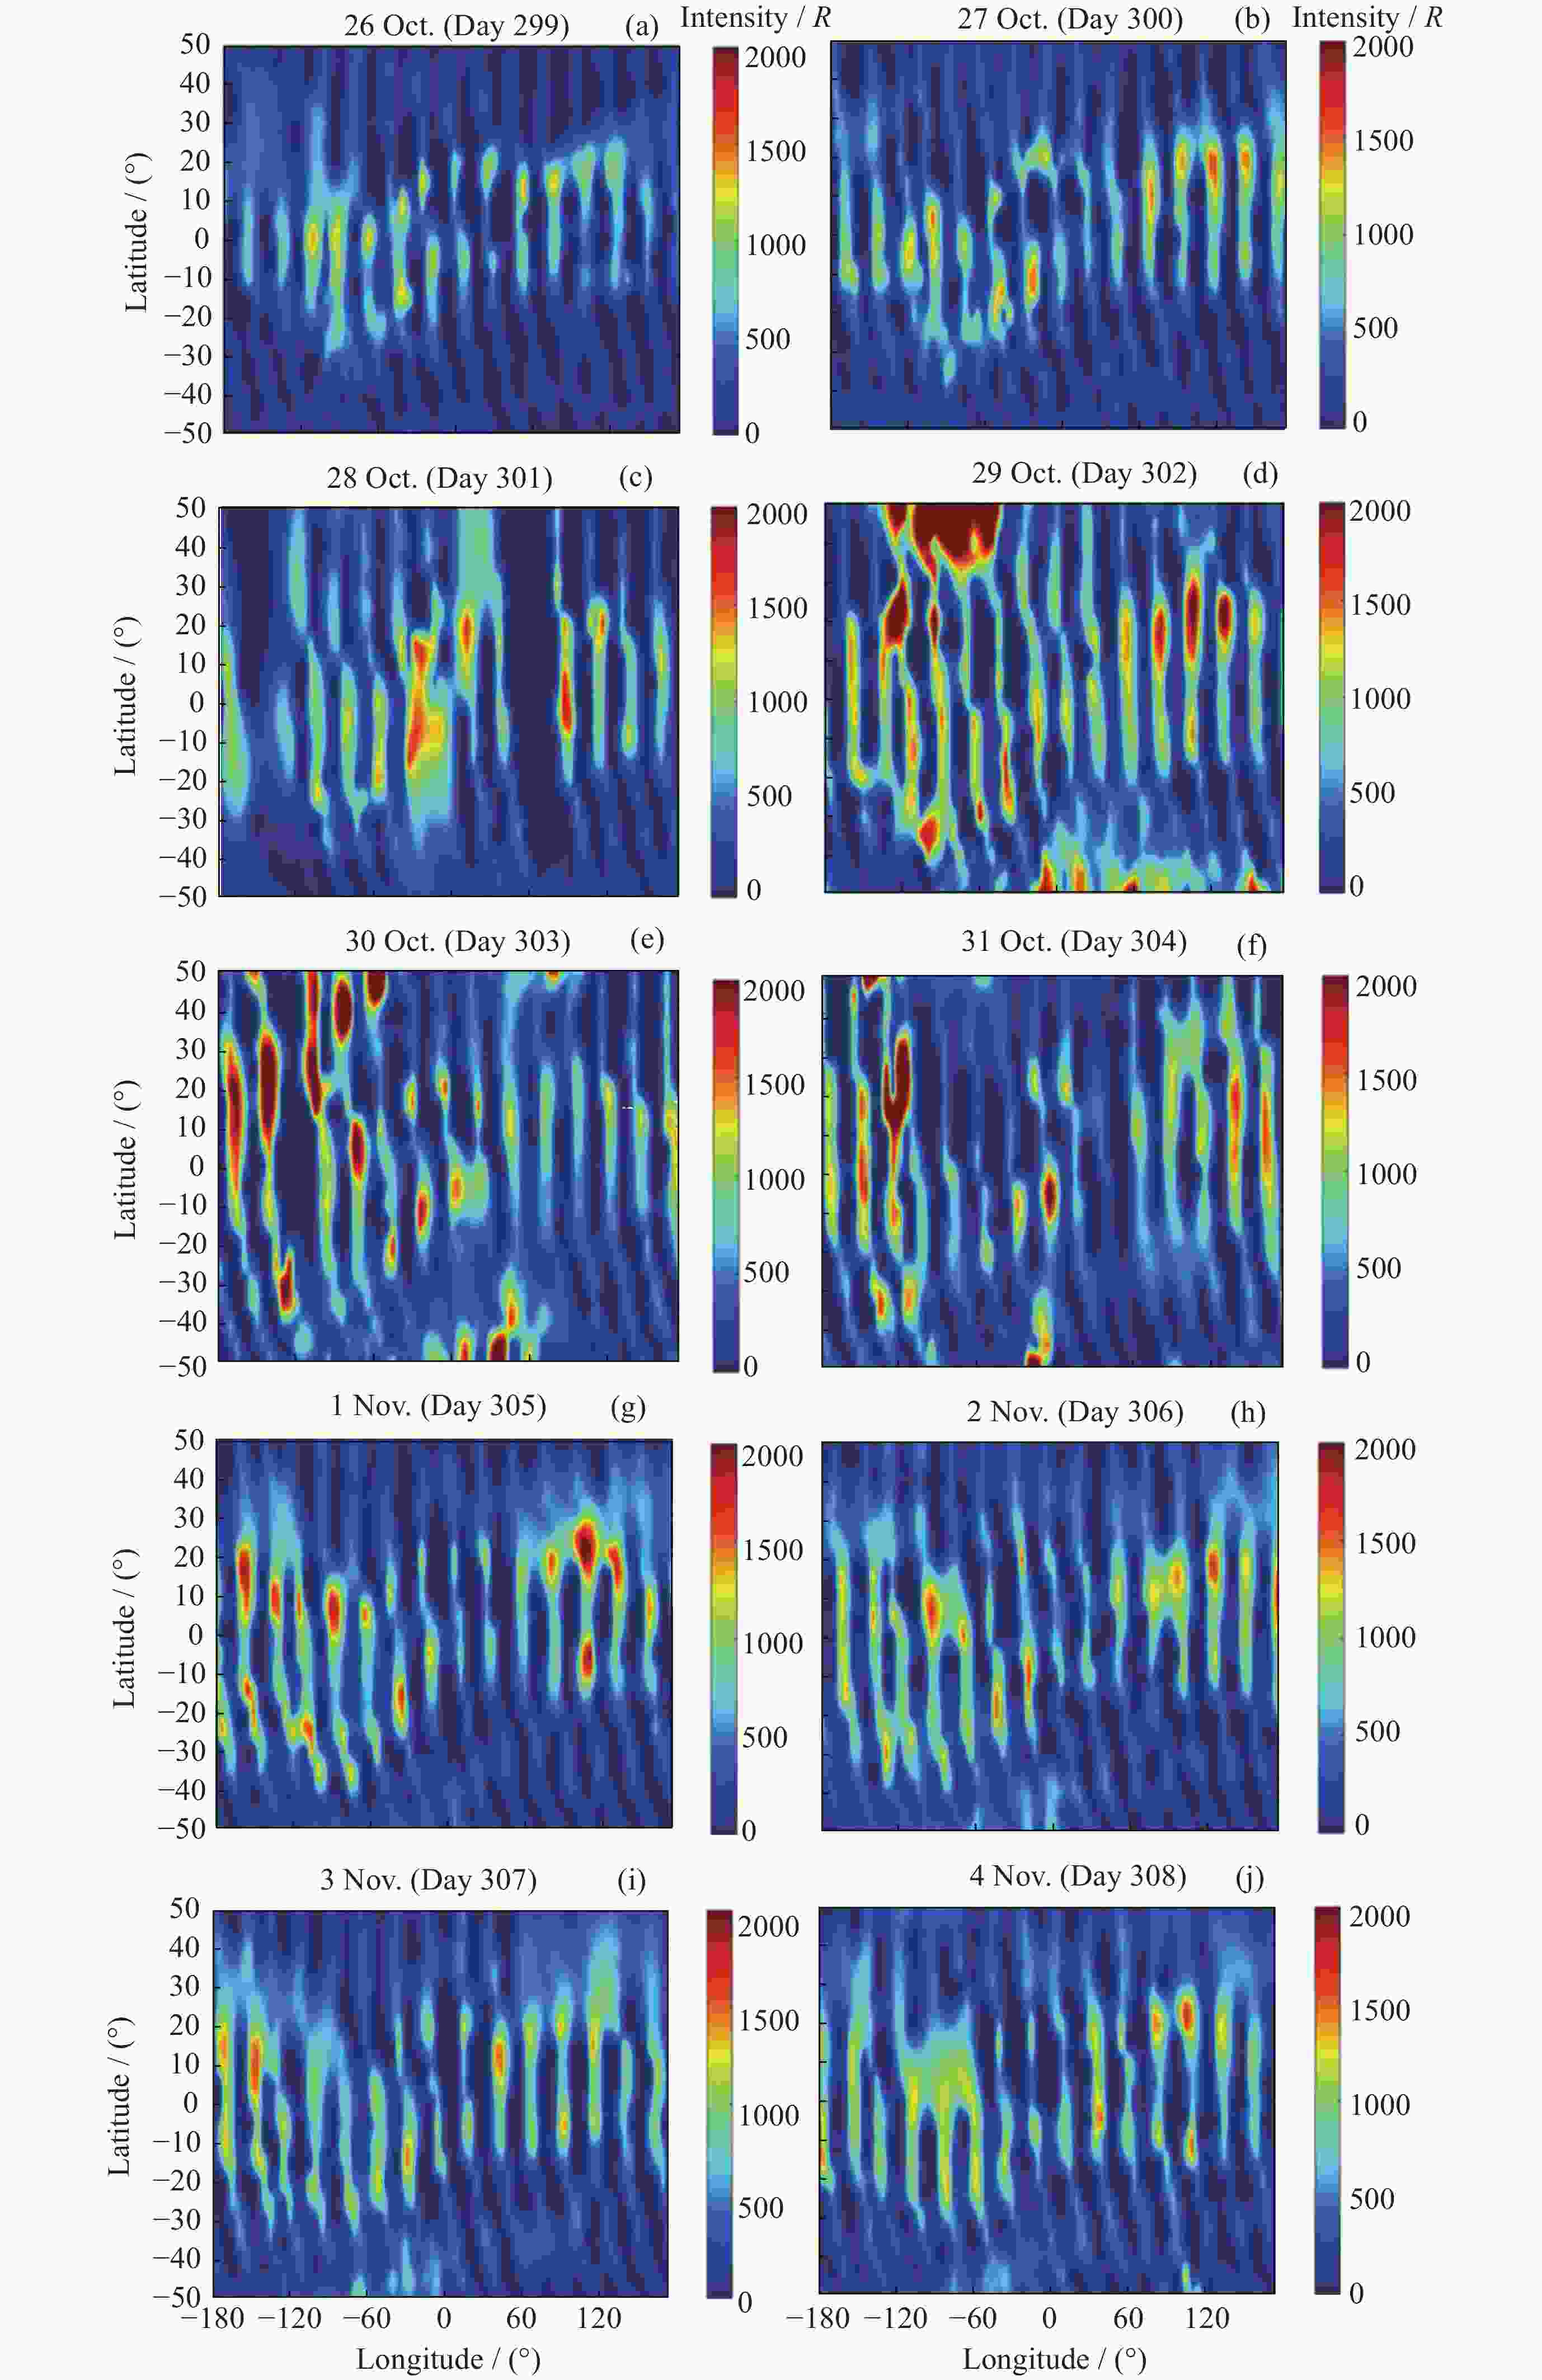
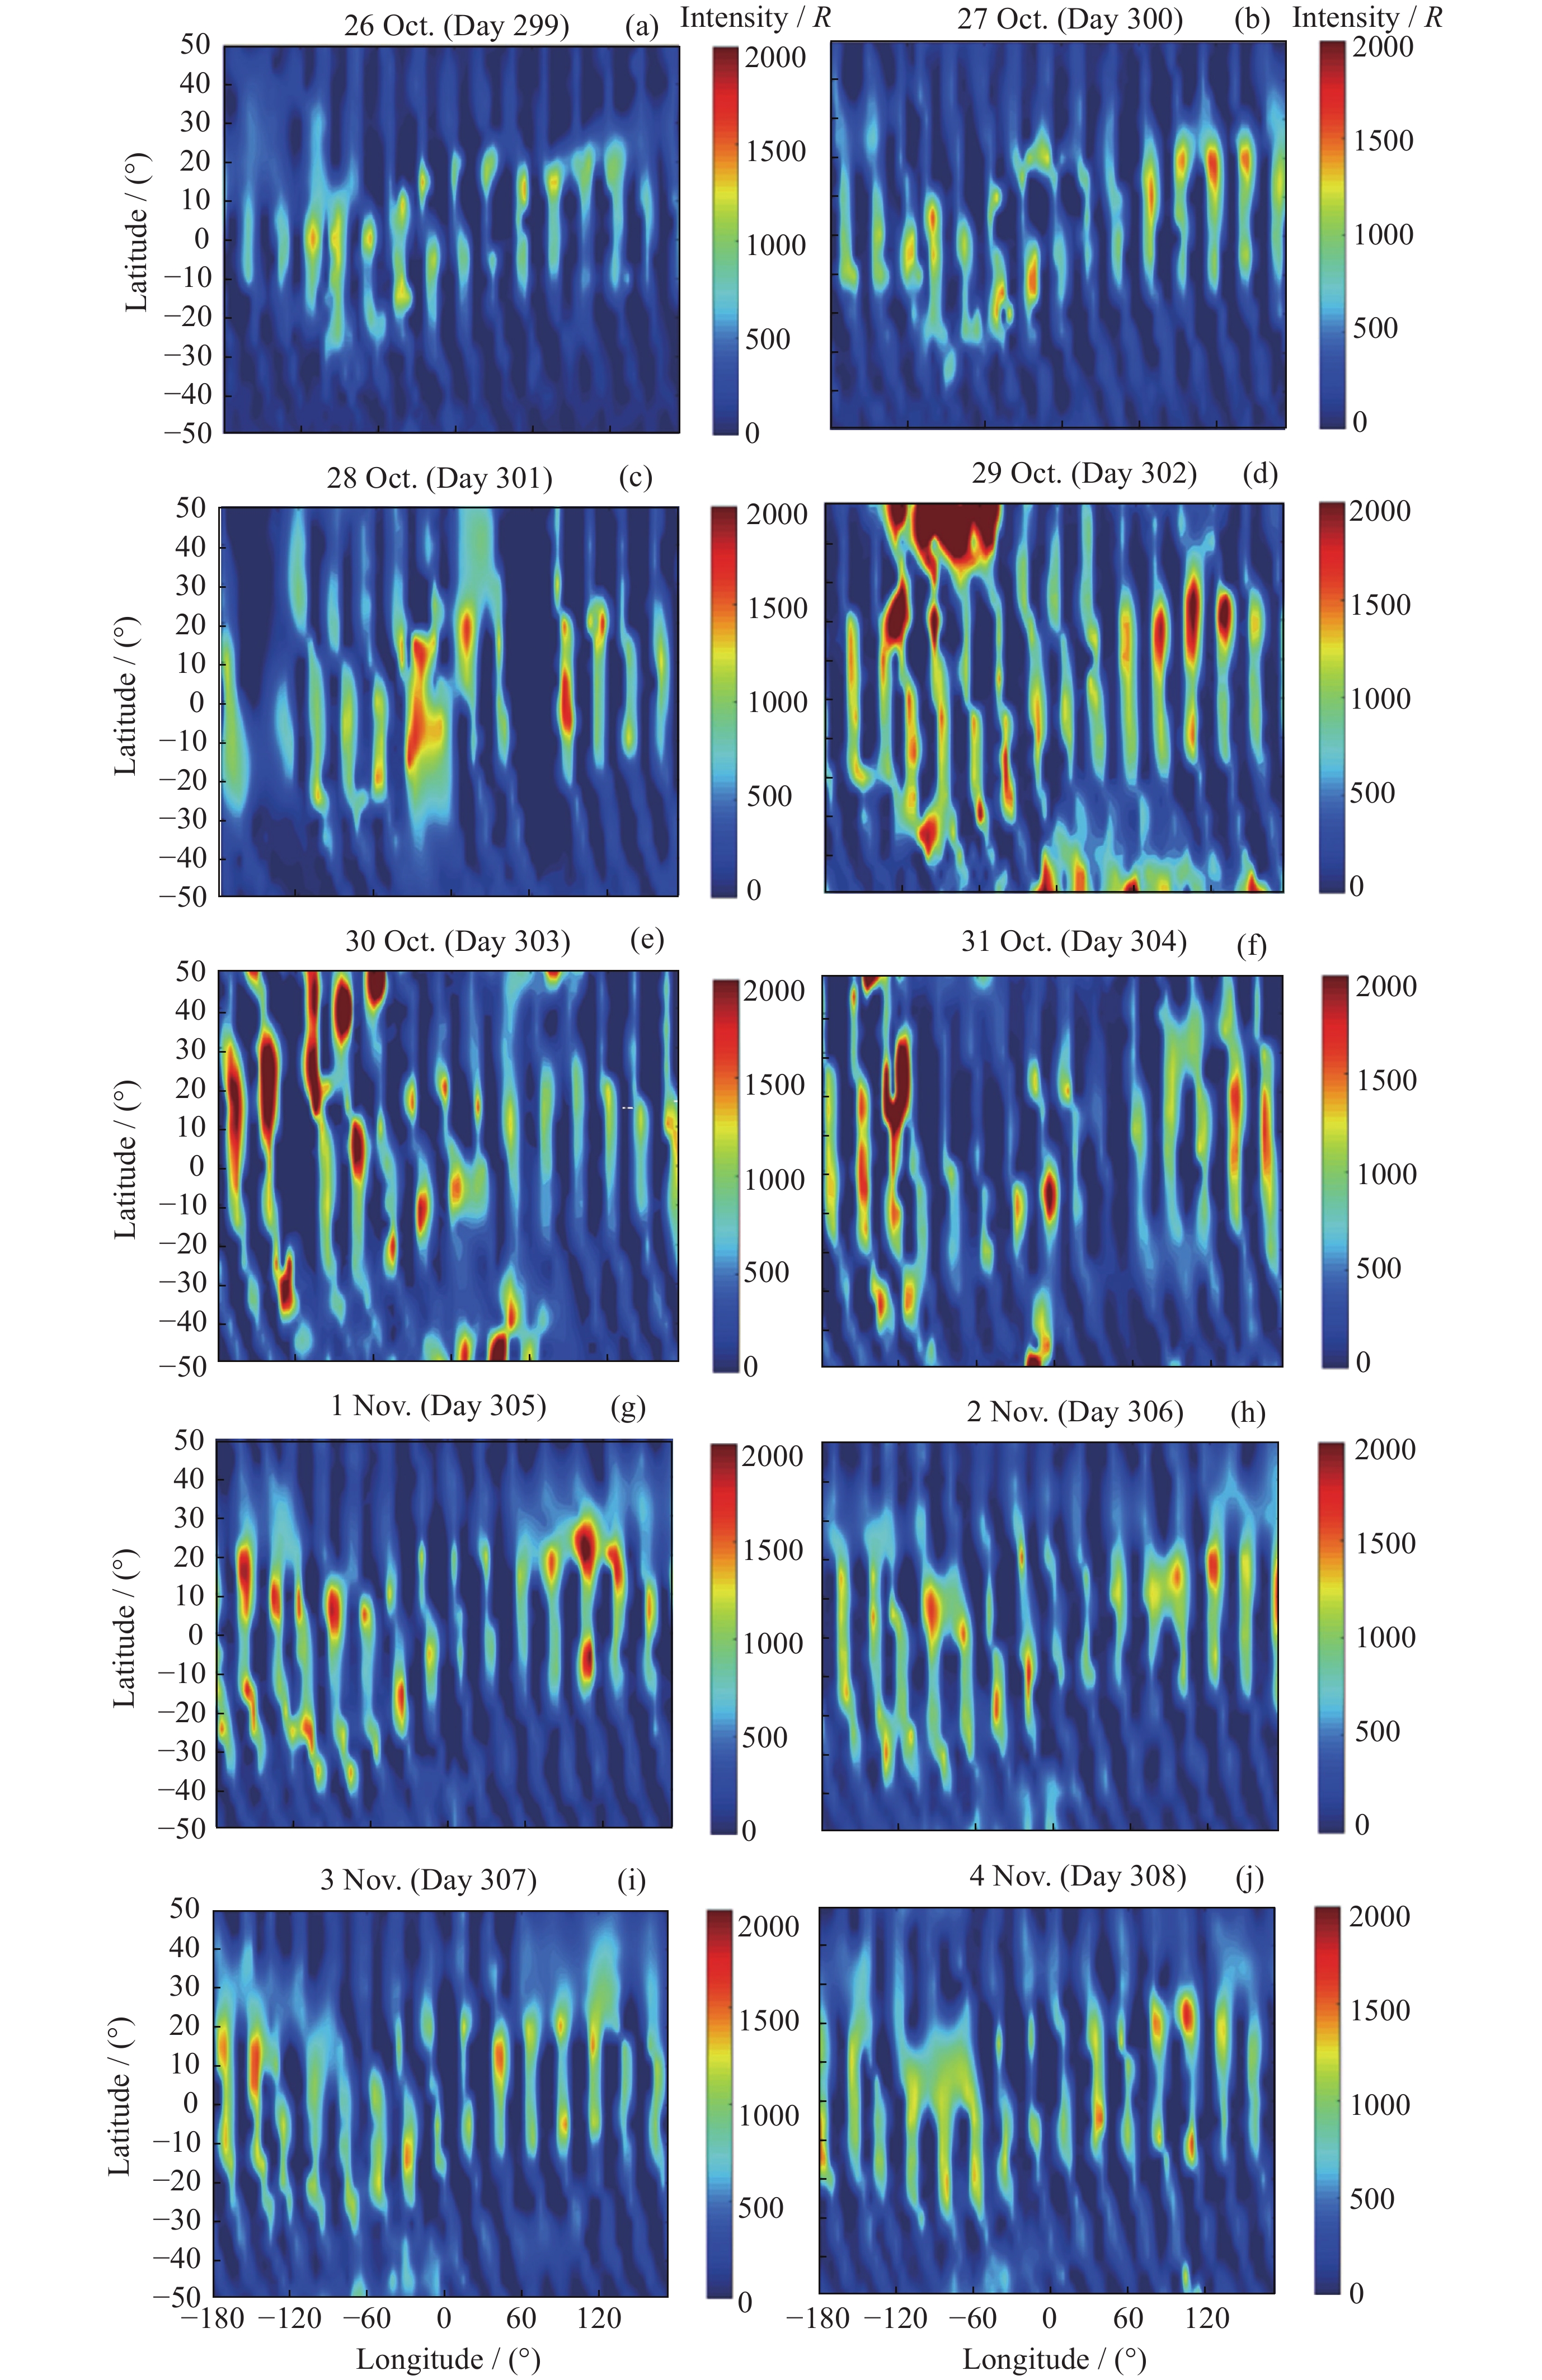
图 2 2003年10月26日至11月4日OI 135.6 nm气辉辐射强度的经纬度分布情况
Figure 2. Longitude and latitude distributions of OI 135.6 nm airglow emission intensity from 26 October to 4 November in 2003
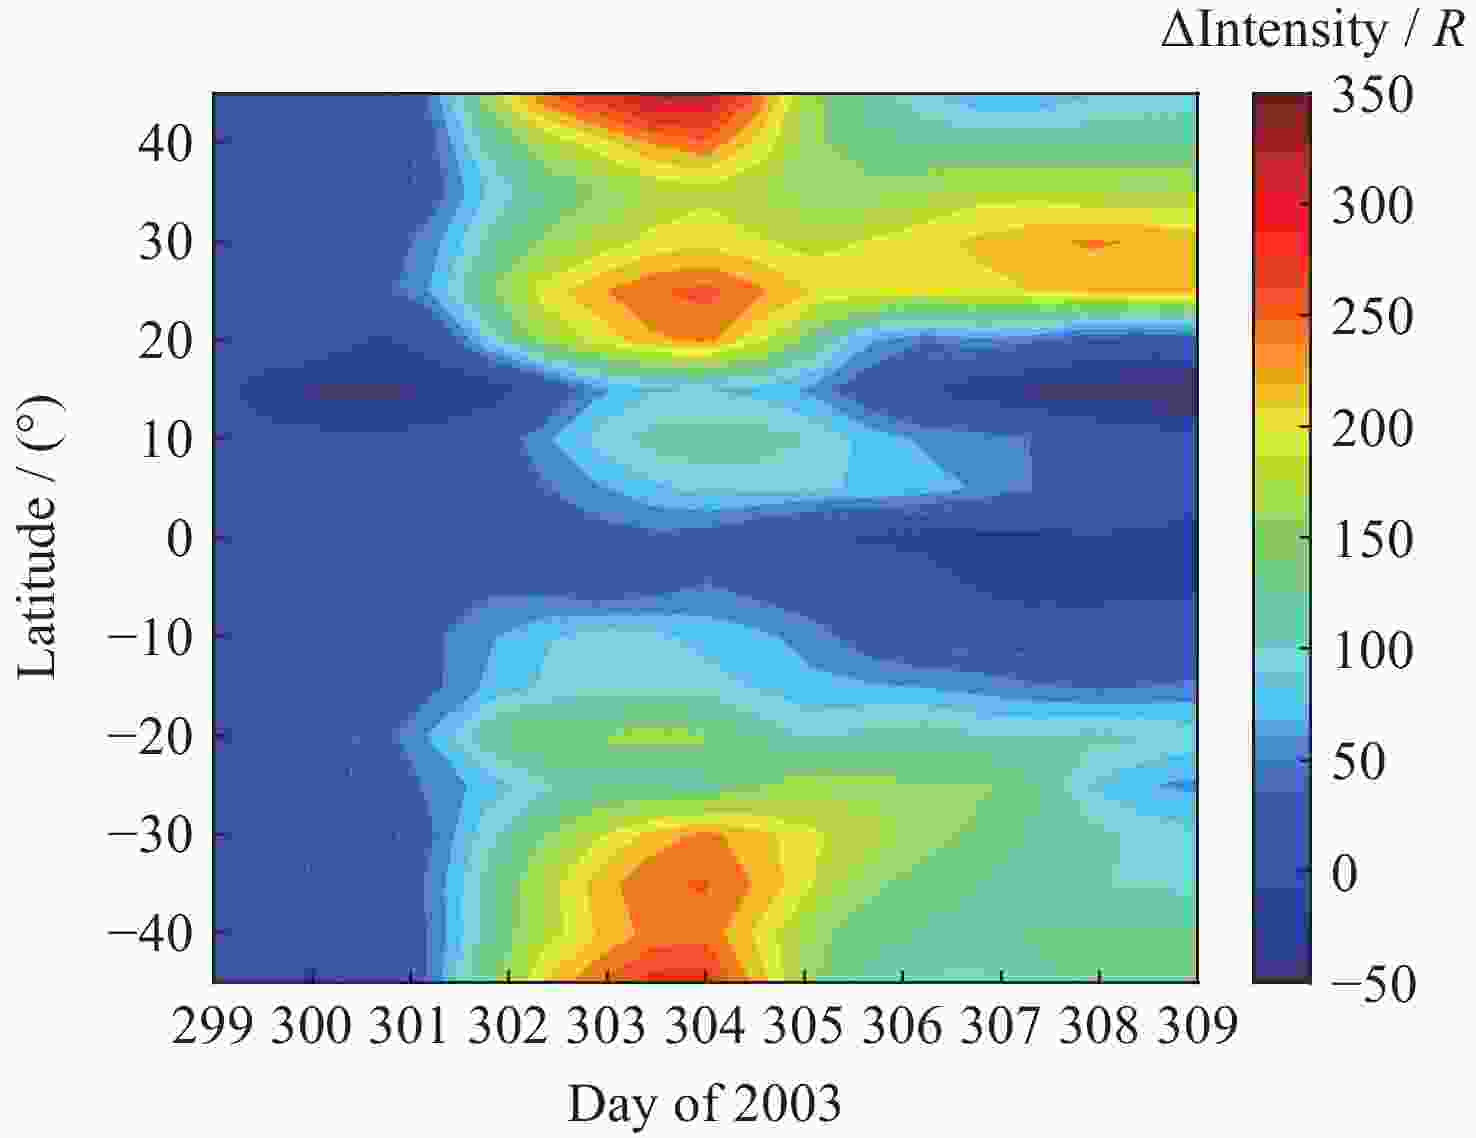
图 3 不同纬度OI 135.6 nm气辉辐射强度相较于磁静期的变化量在2003年10月26日至11月4日的变化情况
Figure 3. Variation of OI 135.6 nm airglow emission intensity at different latitudes compared to the magnetostatic period from 26 October to 4 November in 2003
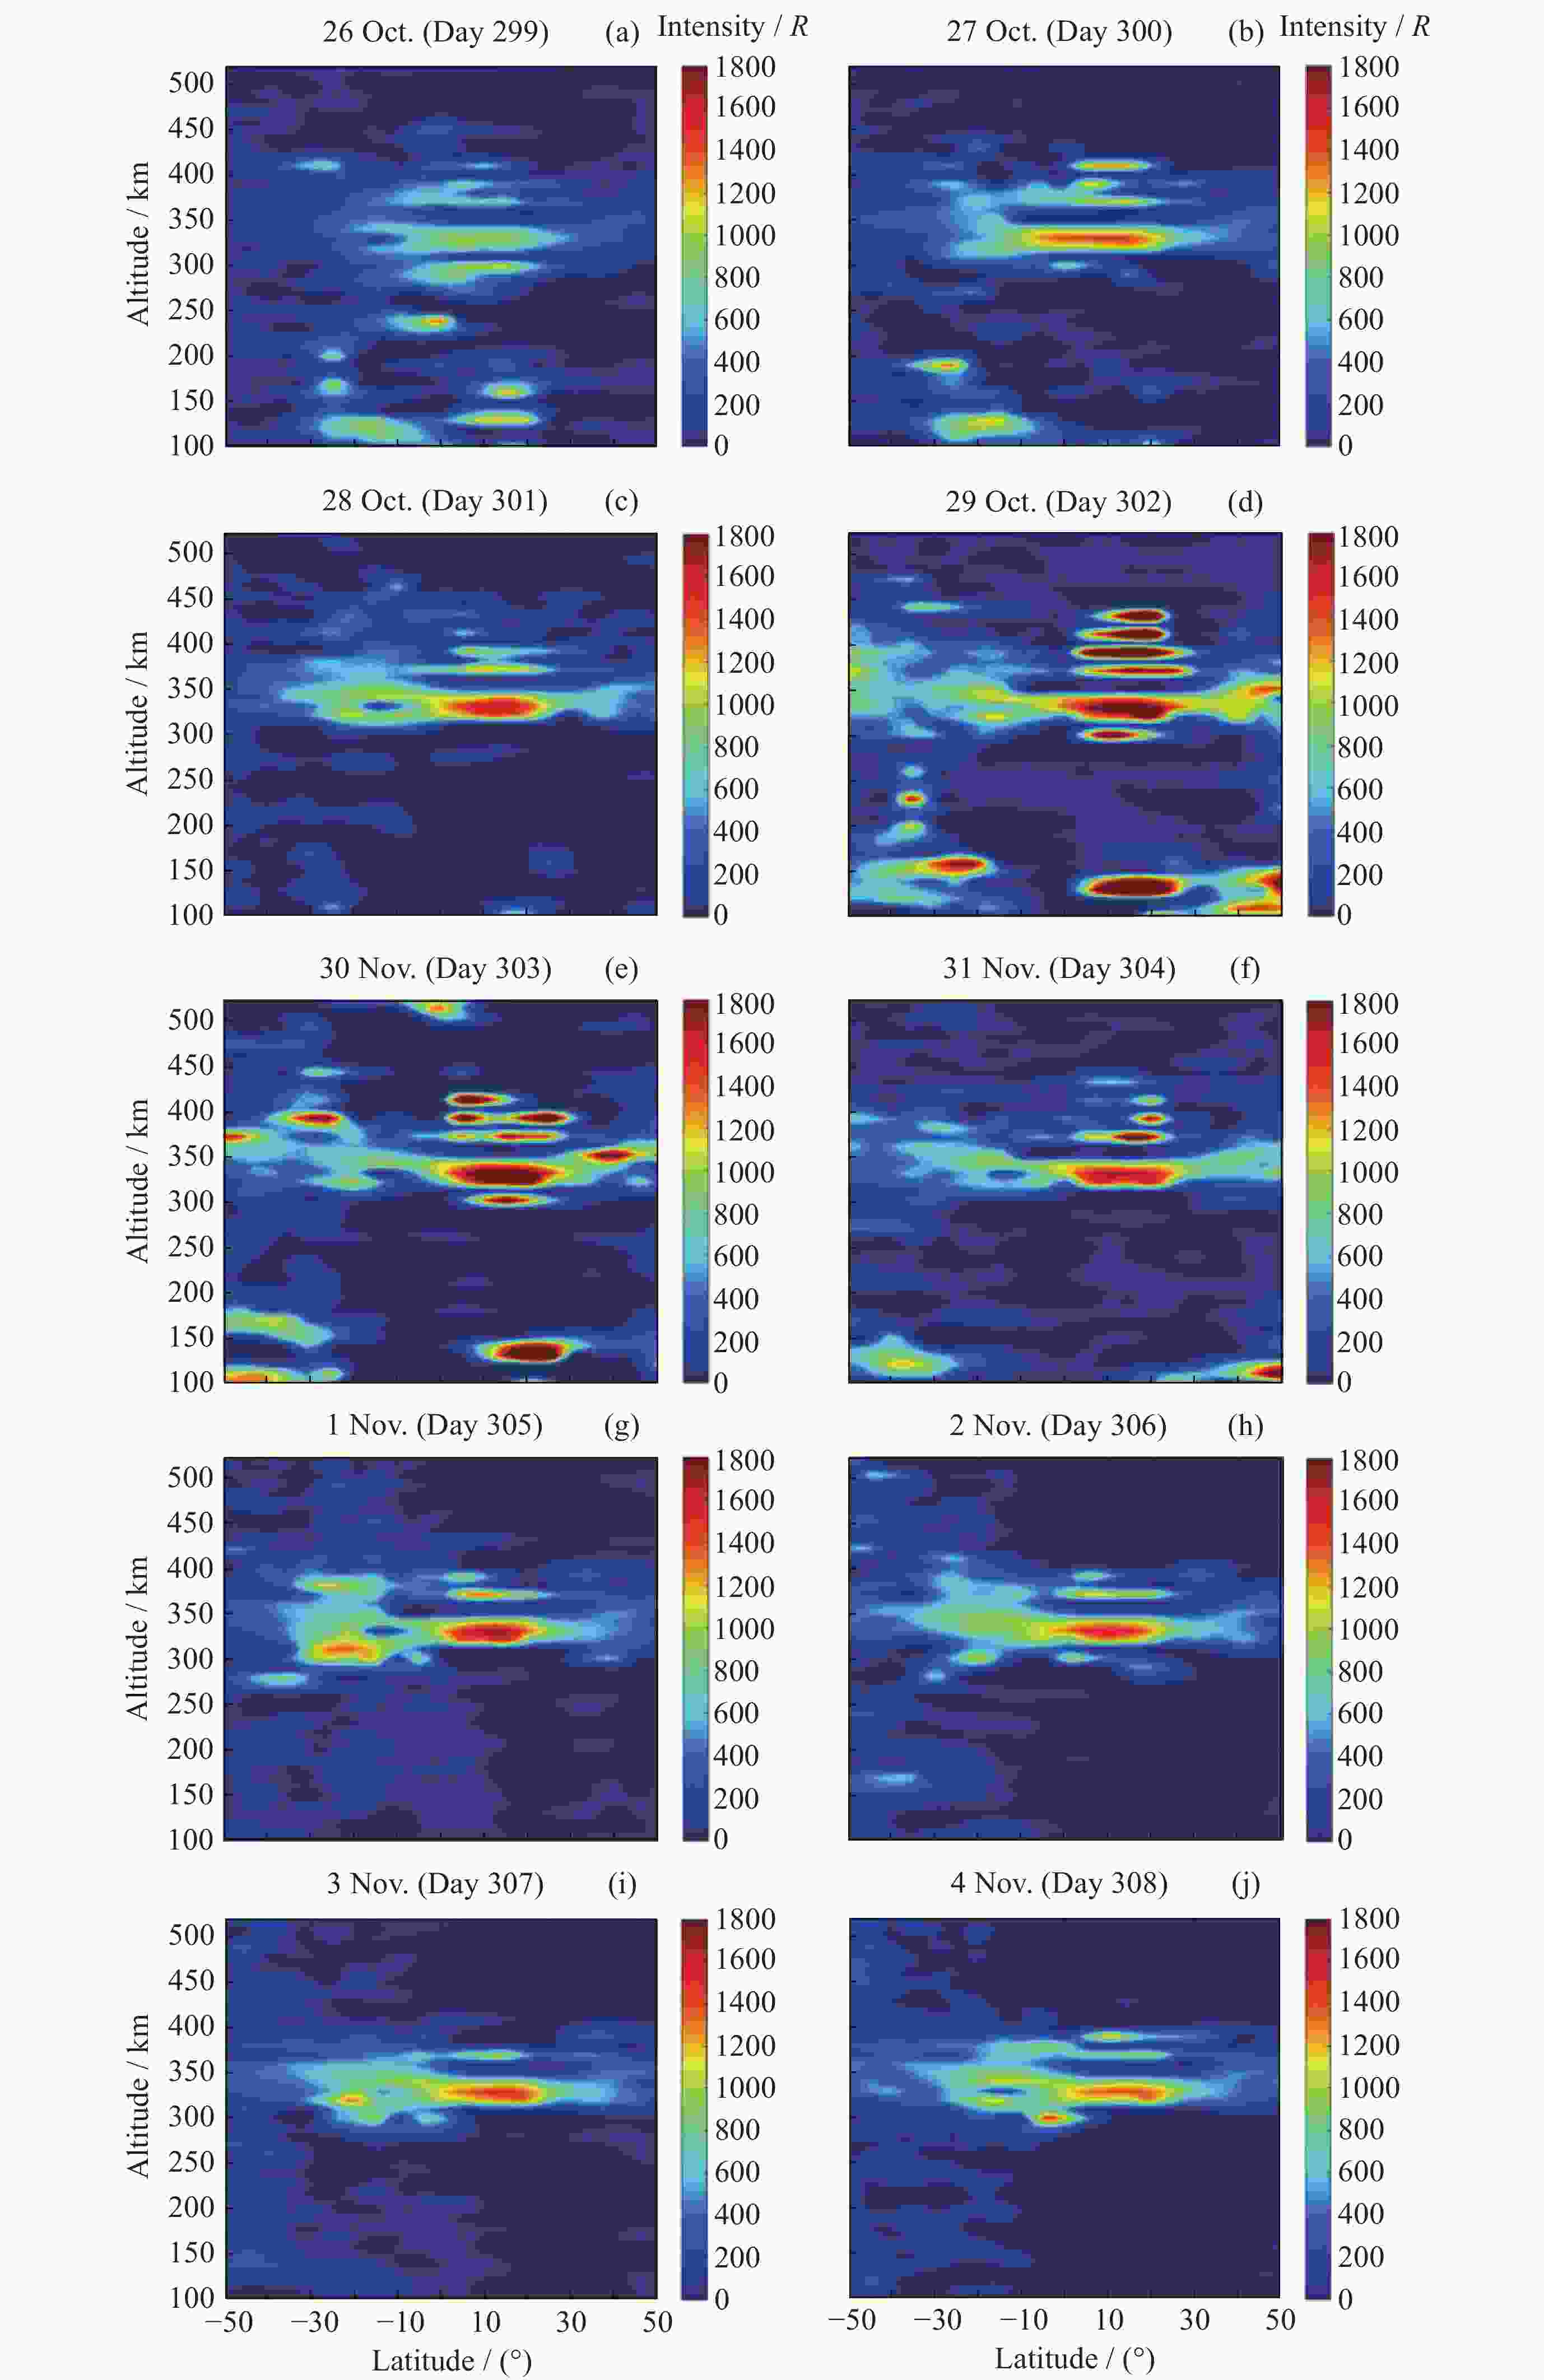
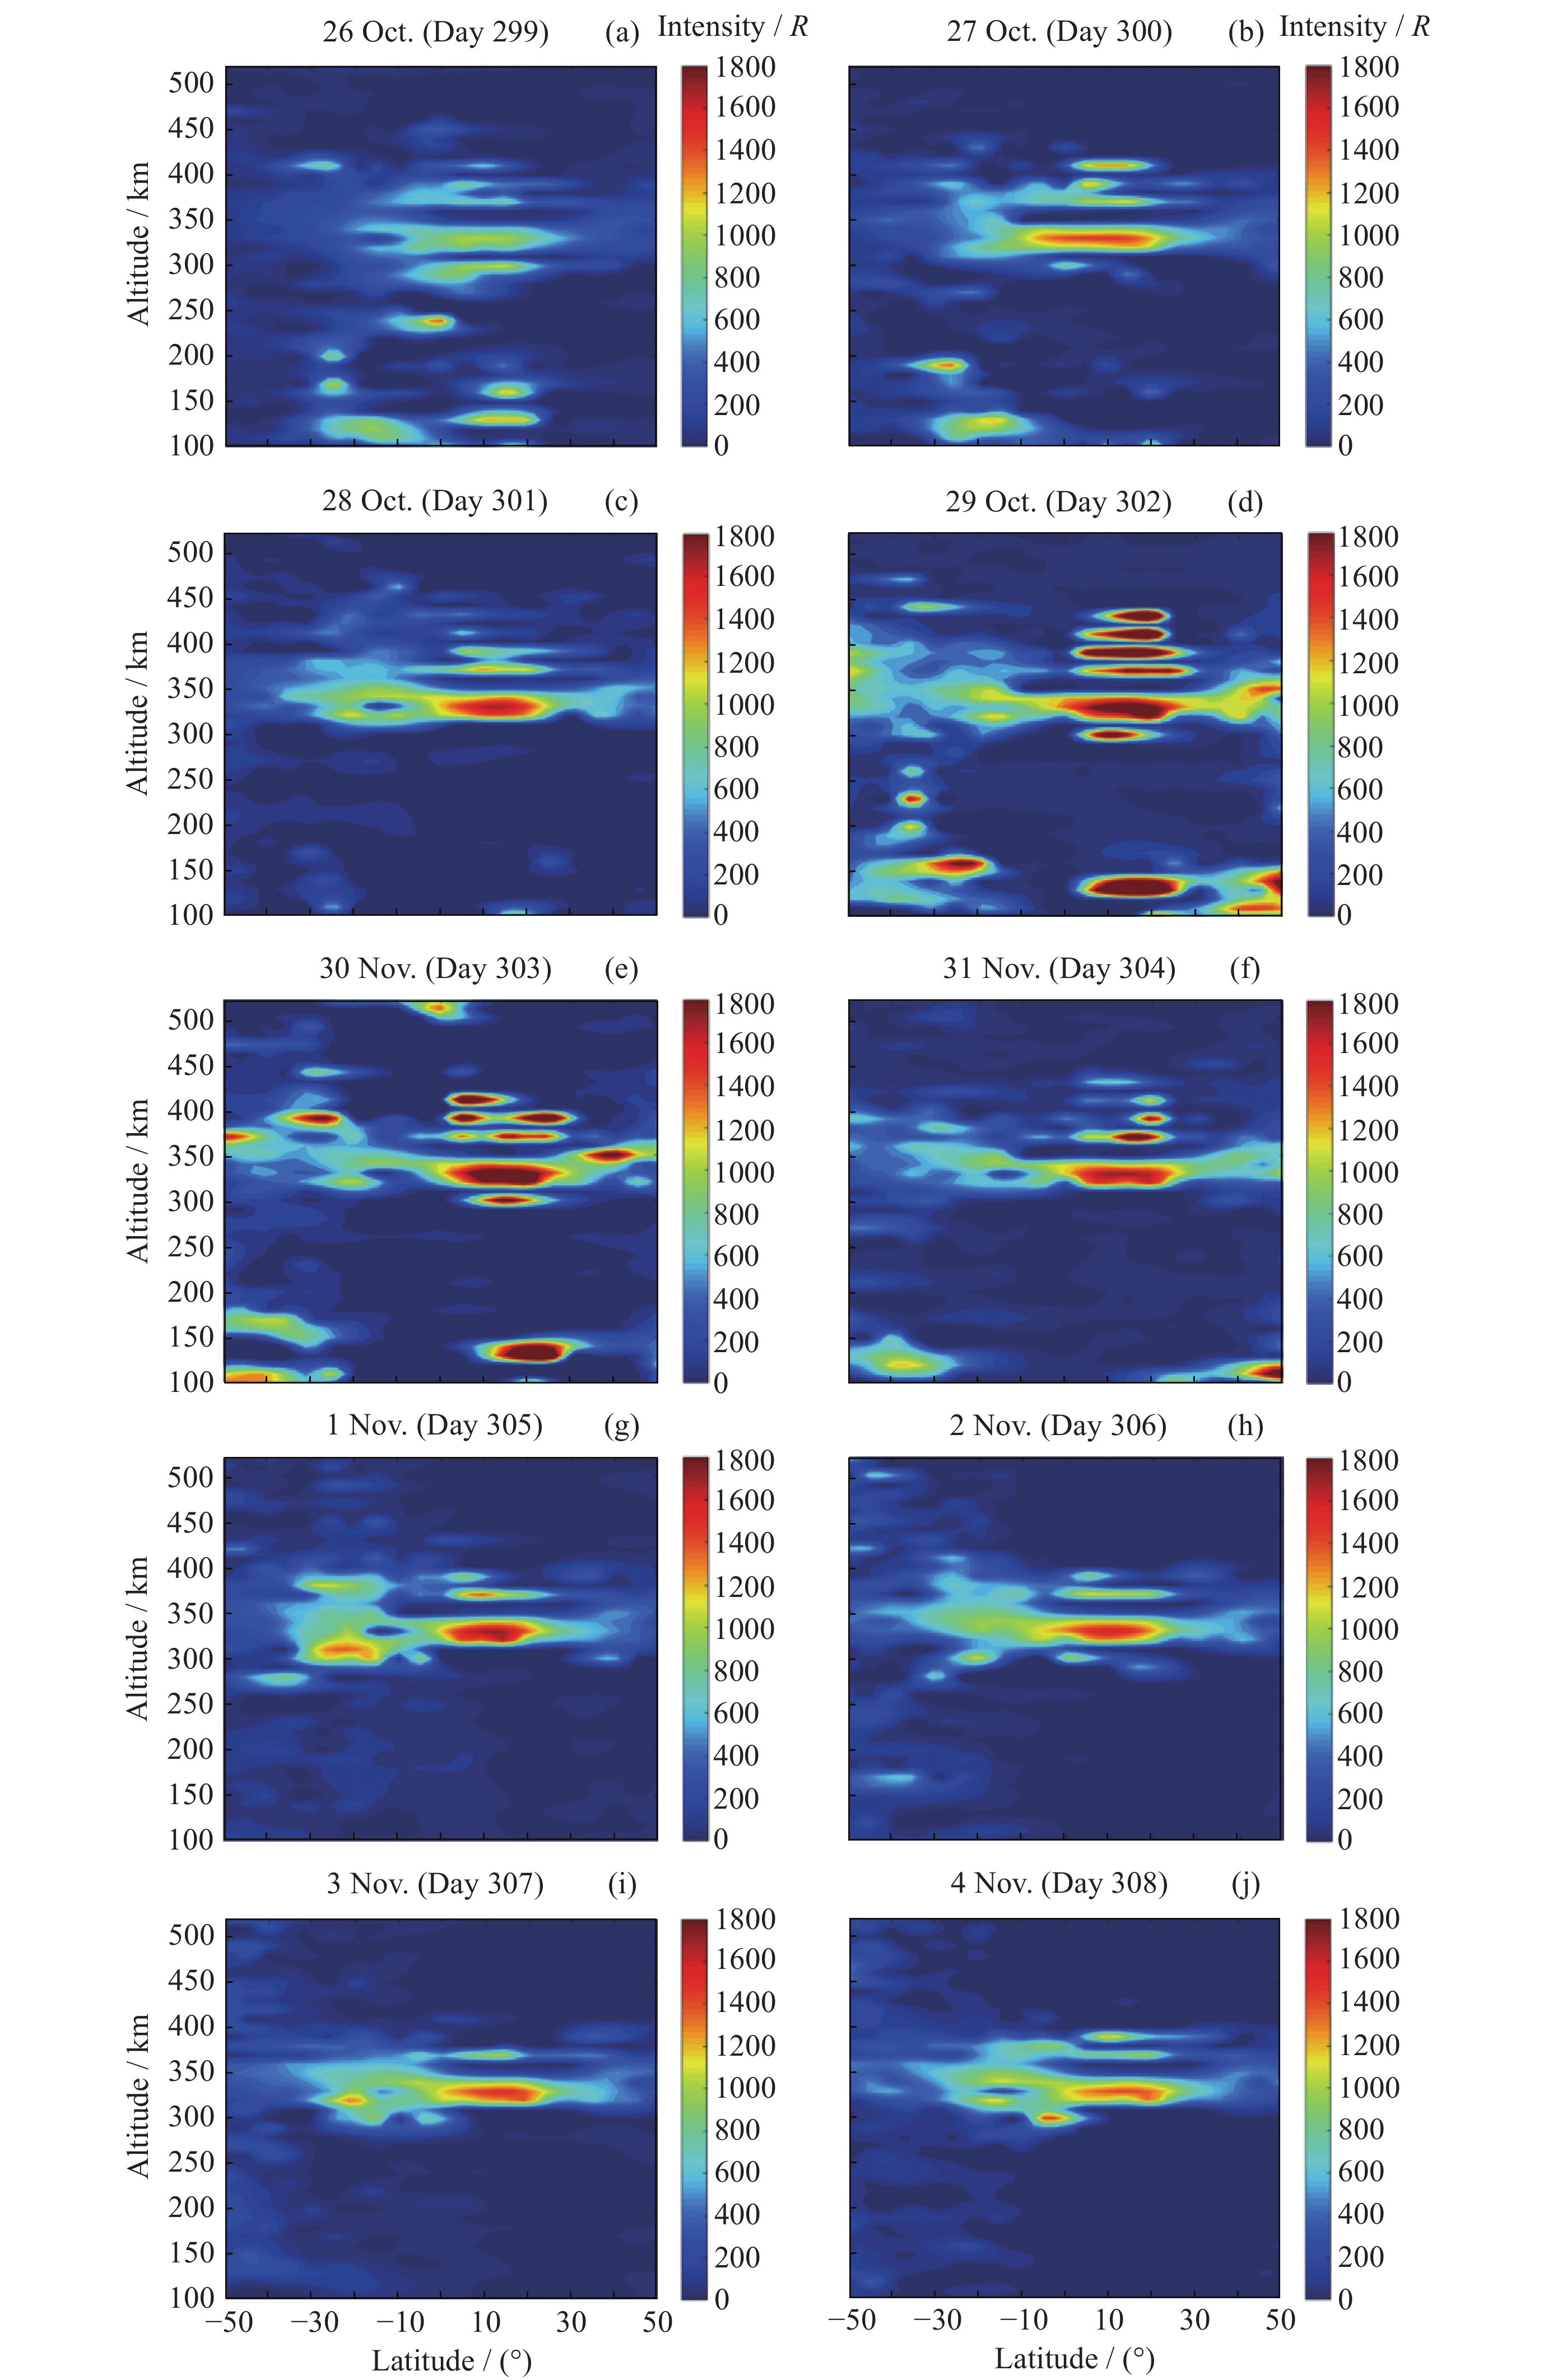
图 4 2003年10月26日至11月4日OI 135.6 nm气辉辐射强度的纬度–高度分布情况
Figure 4. Latitude-altitude distributions of OI 135.6 nm airglow emission intensity from 26 October to 4 November in 2003

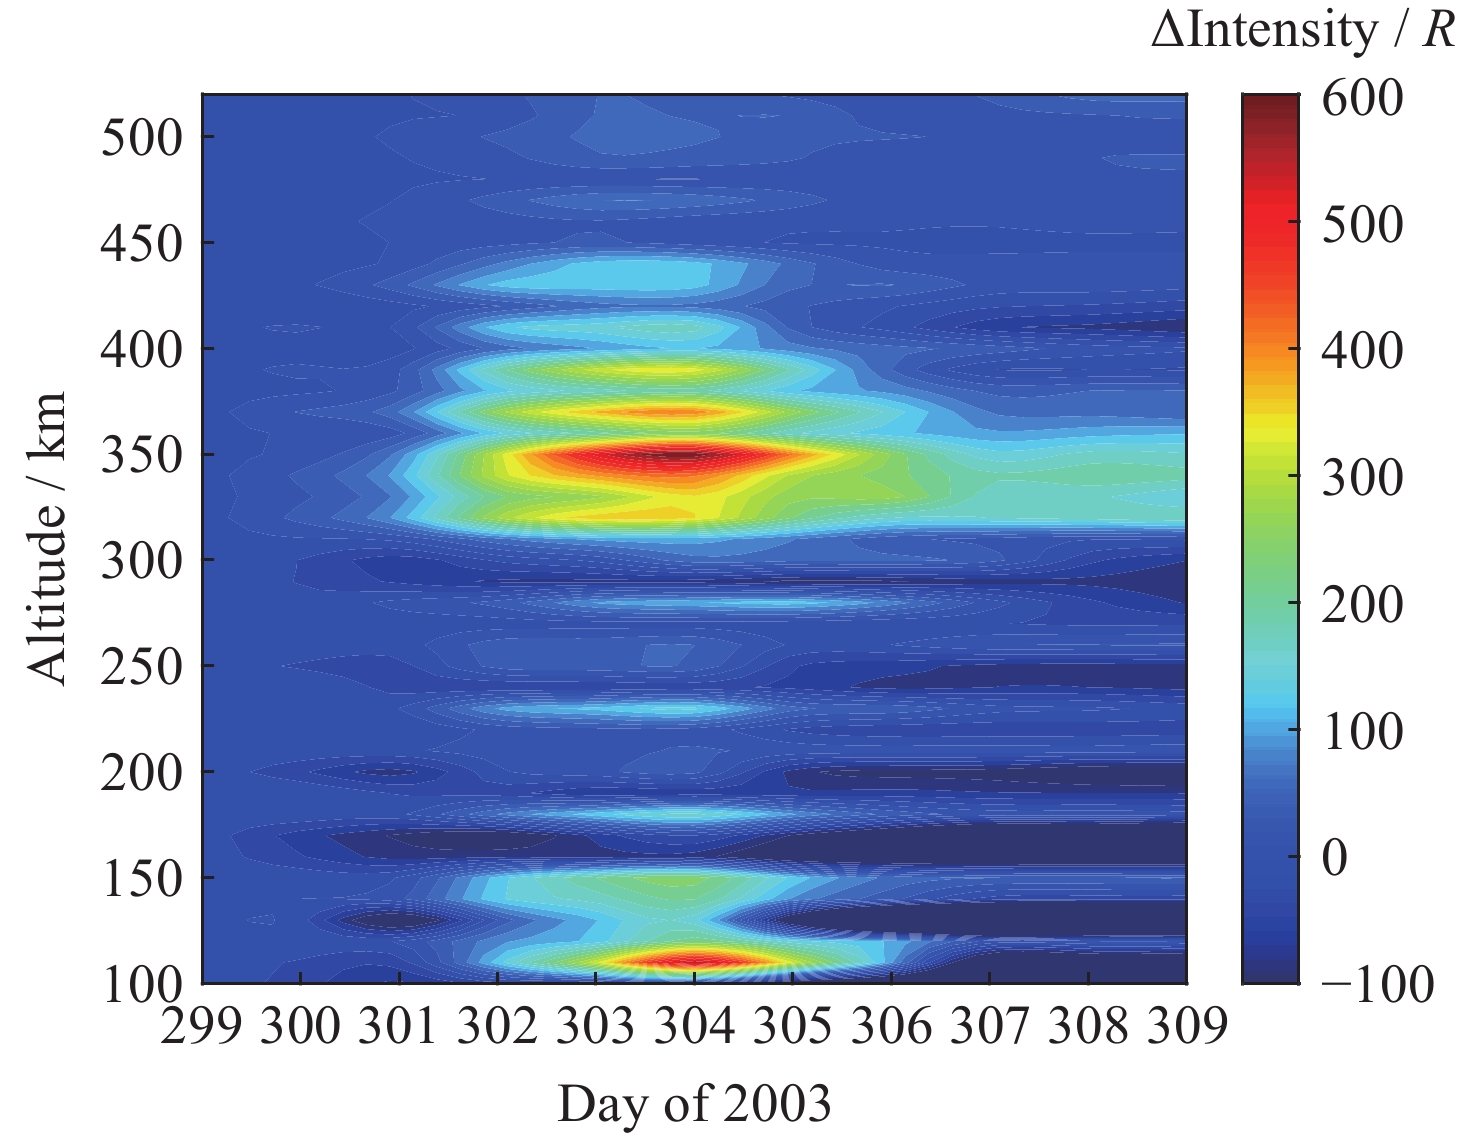
图 5 不同高度OI 135.6 nm气辉辐射强度相较于磁静期的变化量在2003年10月26日至11月4日的变化情况
Figure 5. Variation of OI 135.6 nm airglow emission intensity at different altitudes compared to the magnetostatic period from 26 October to 4 November in 2003
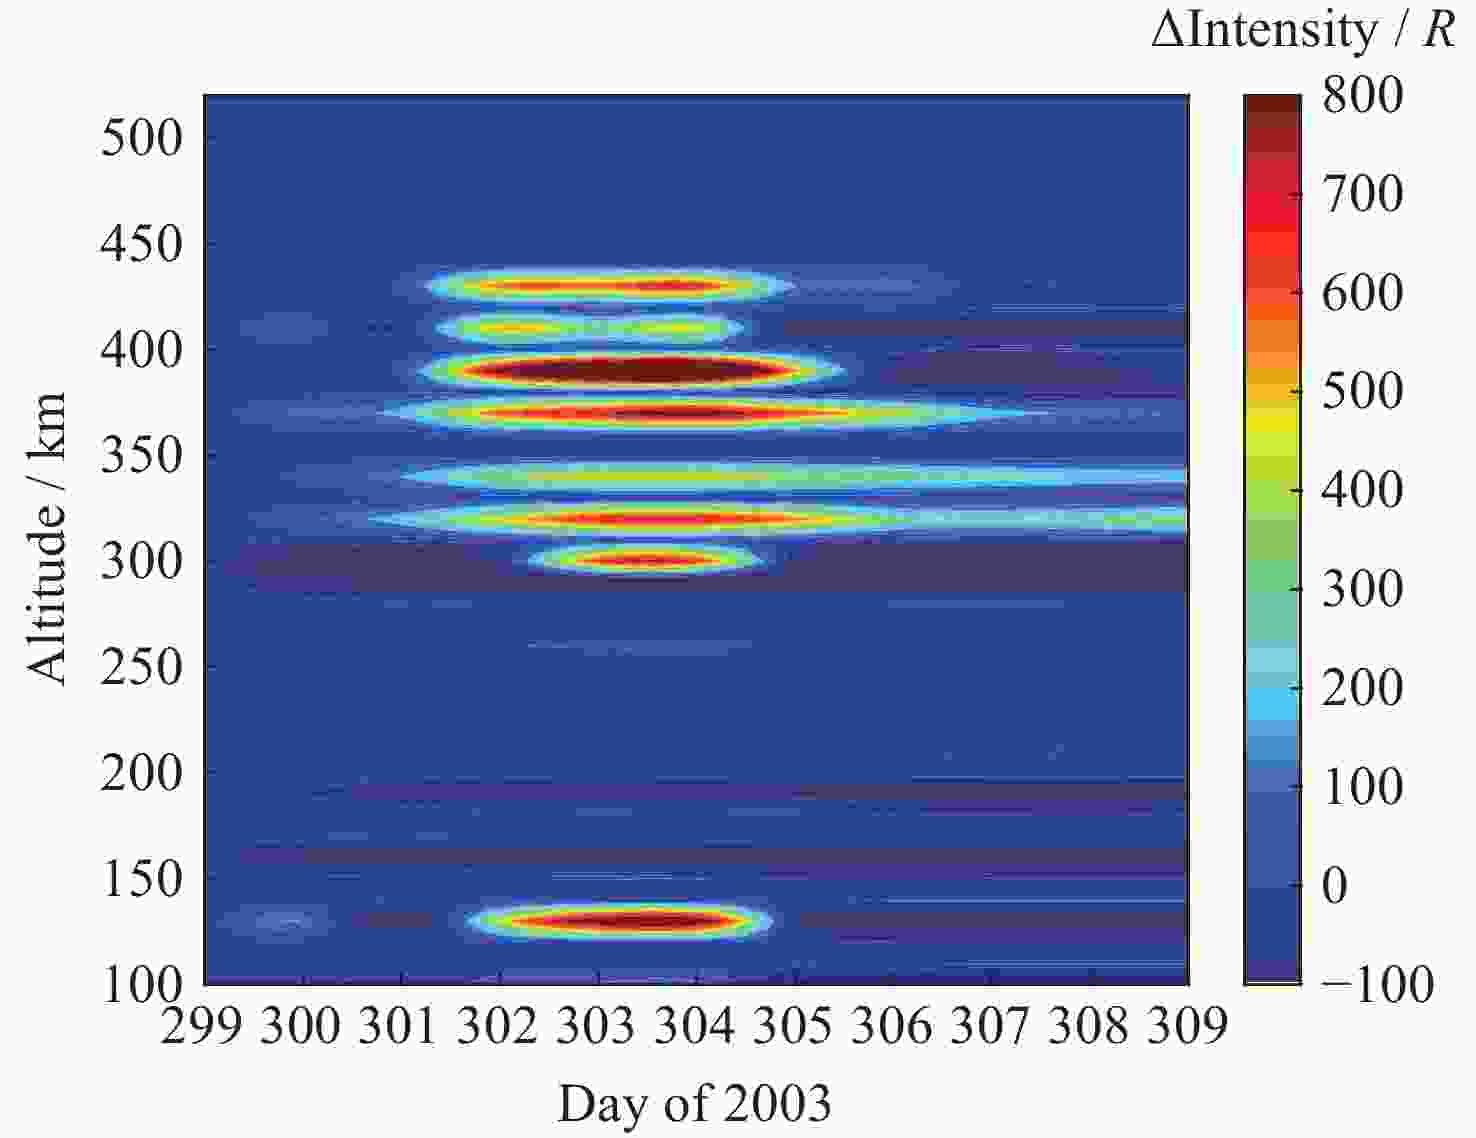
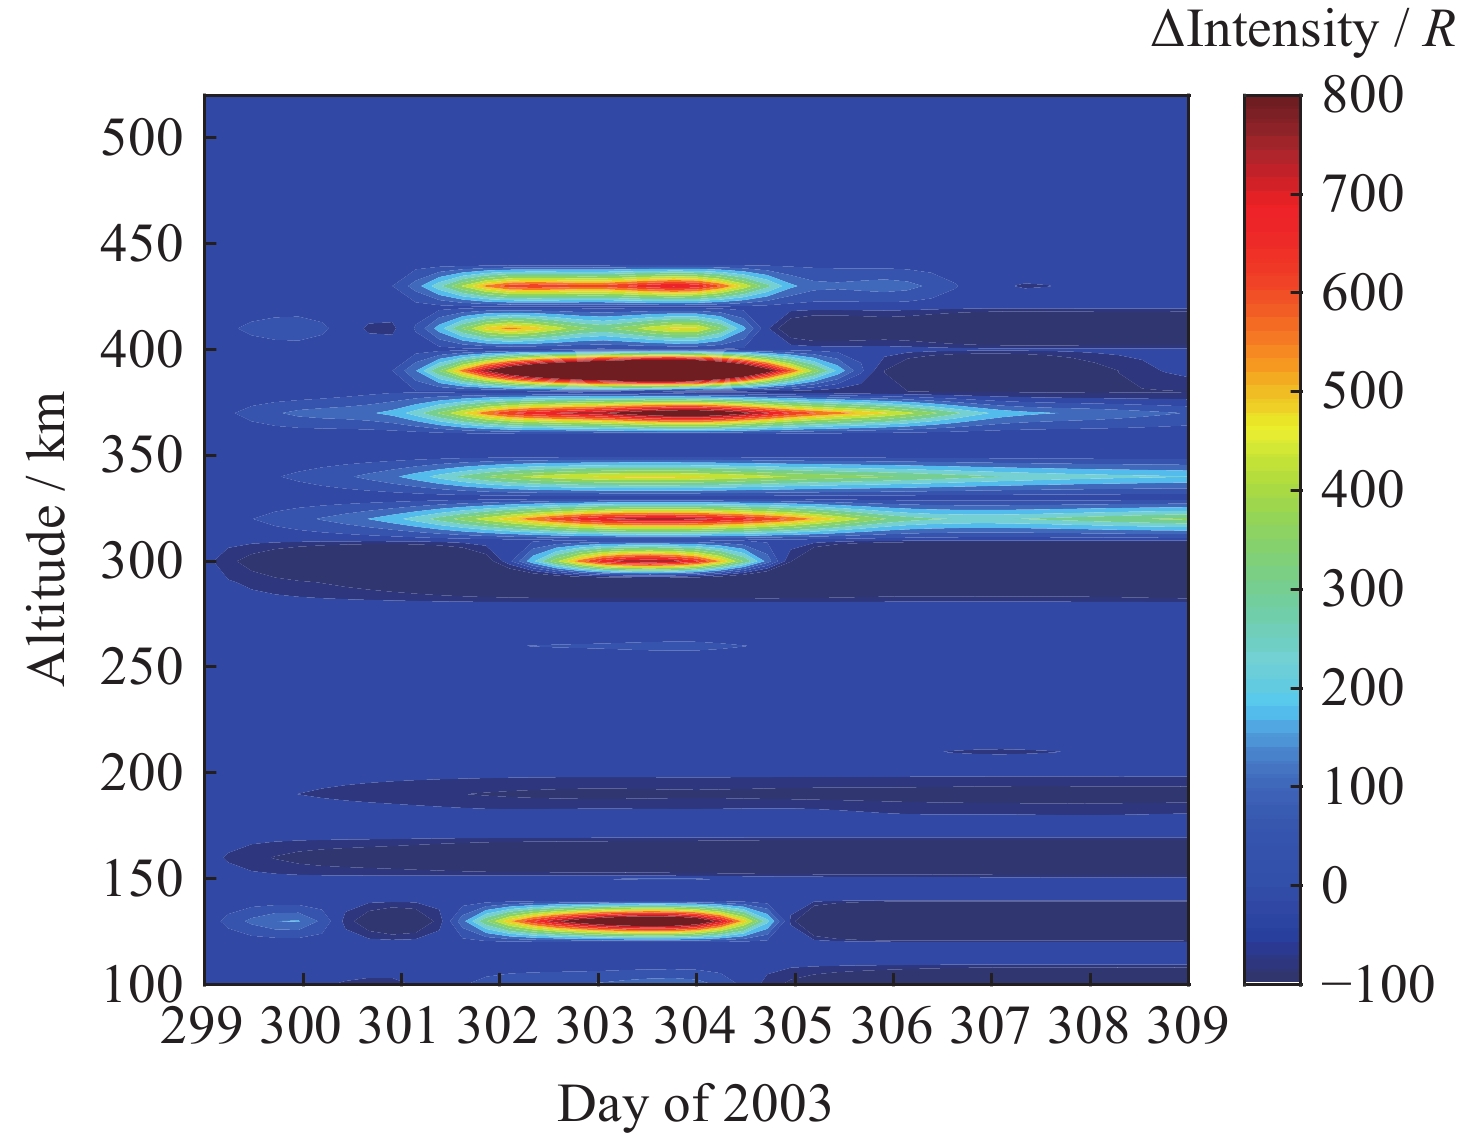
图 6 不同高度10°-30°N范围内 OI 135.6 nm气辉辐射强度的平均值相较于磁静期的变化量在2003年10月26日至11月4日的变化情况
Figure 6. Variation of the mean OI 135.6 nm airglow emission intensity in the range 10°N to 30°N at different altitudes compared to the magnetostatic period from 26 October to 4 November in 2003
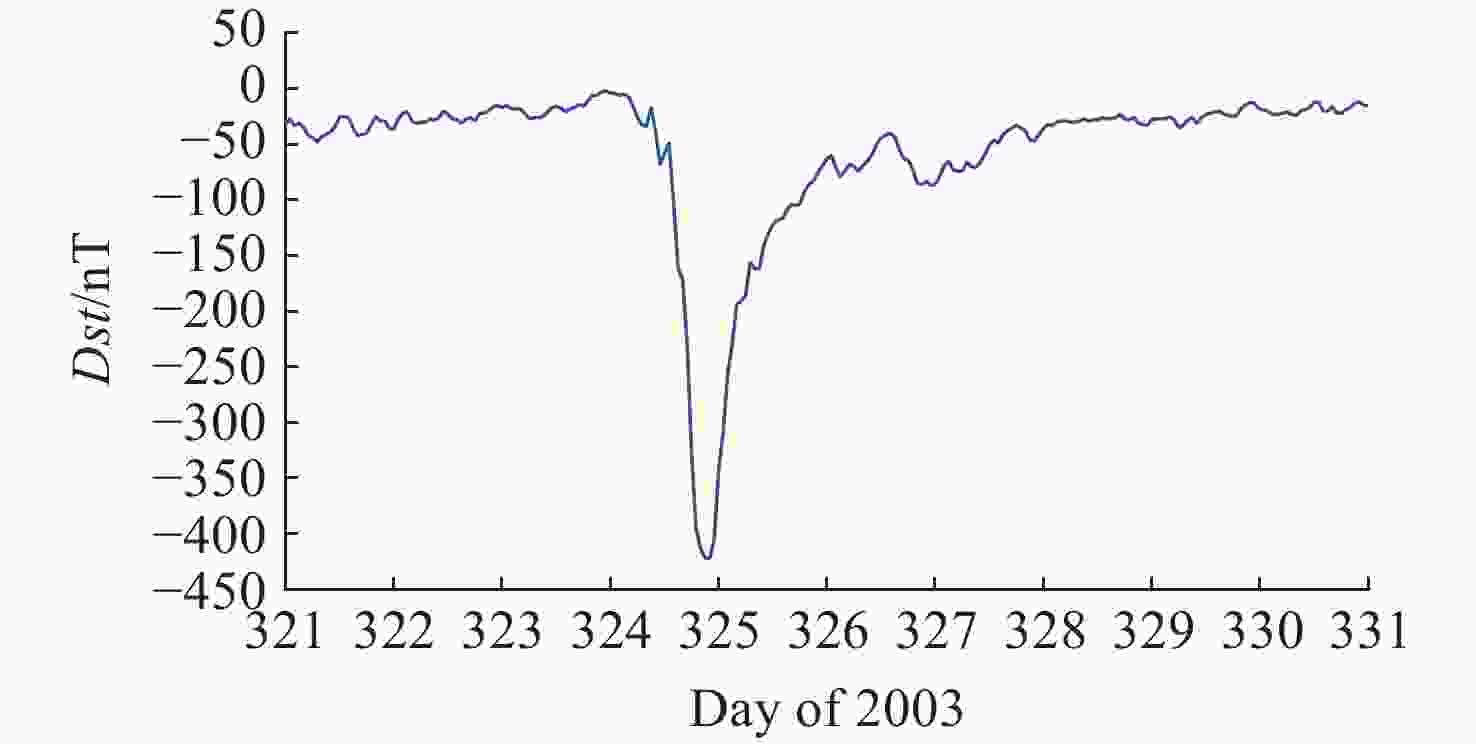
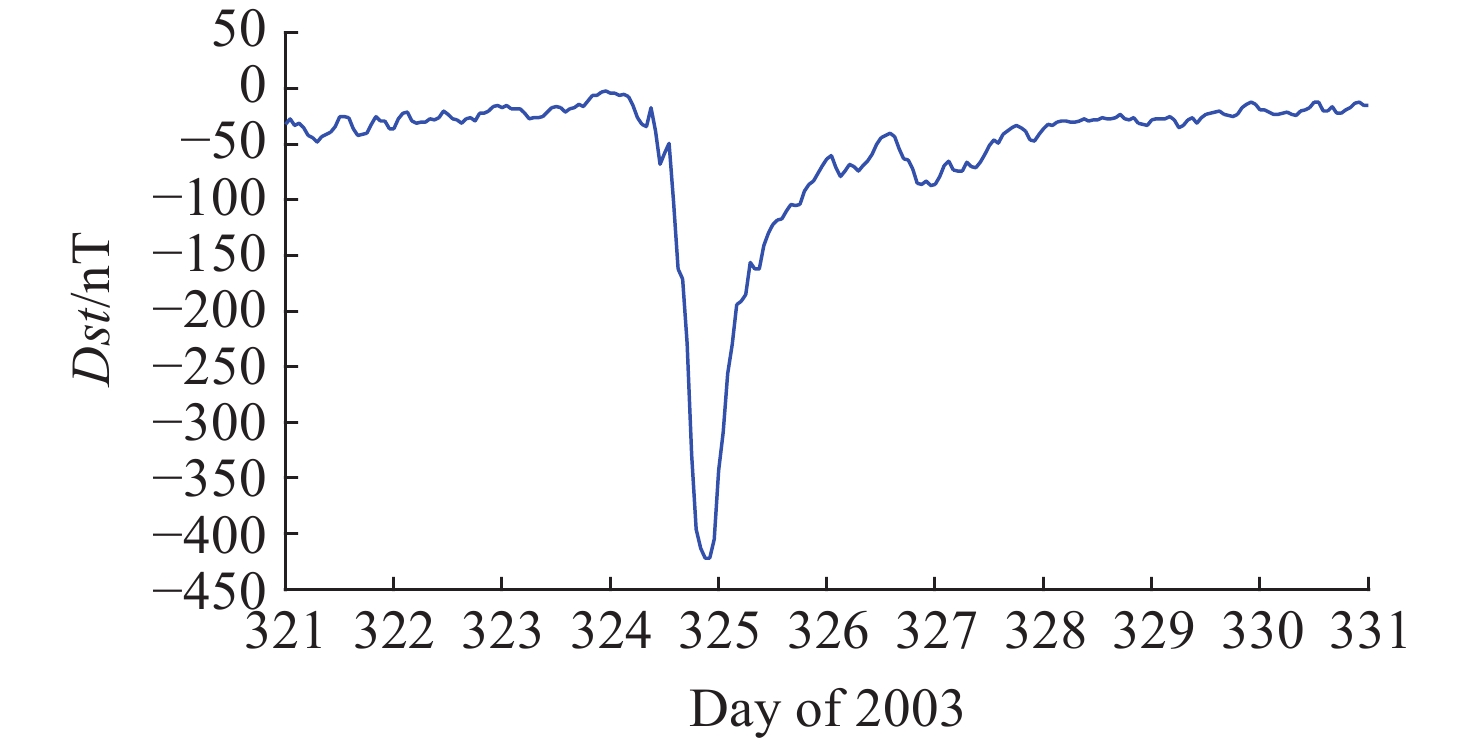
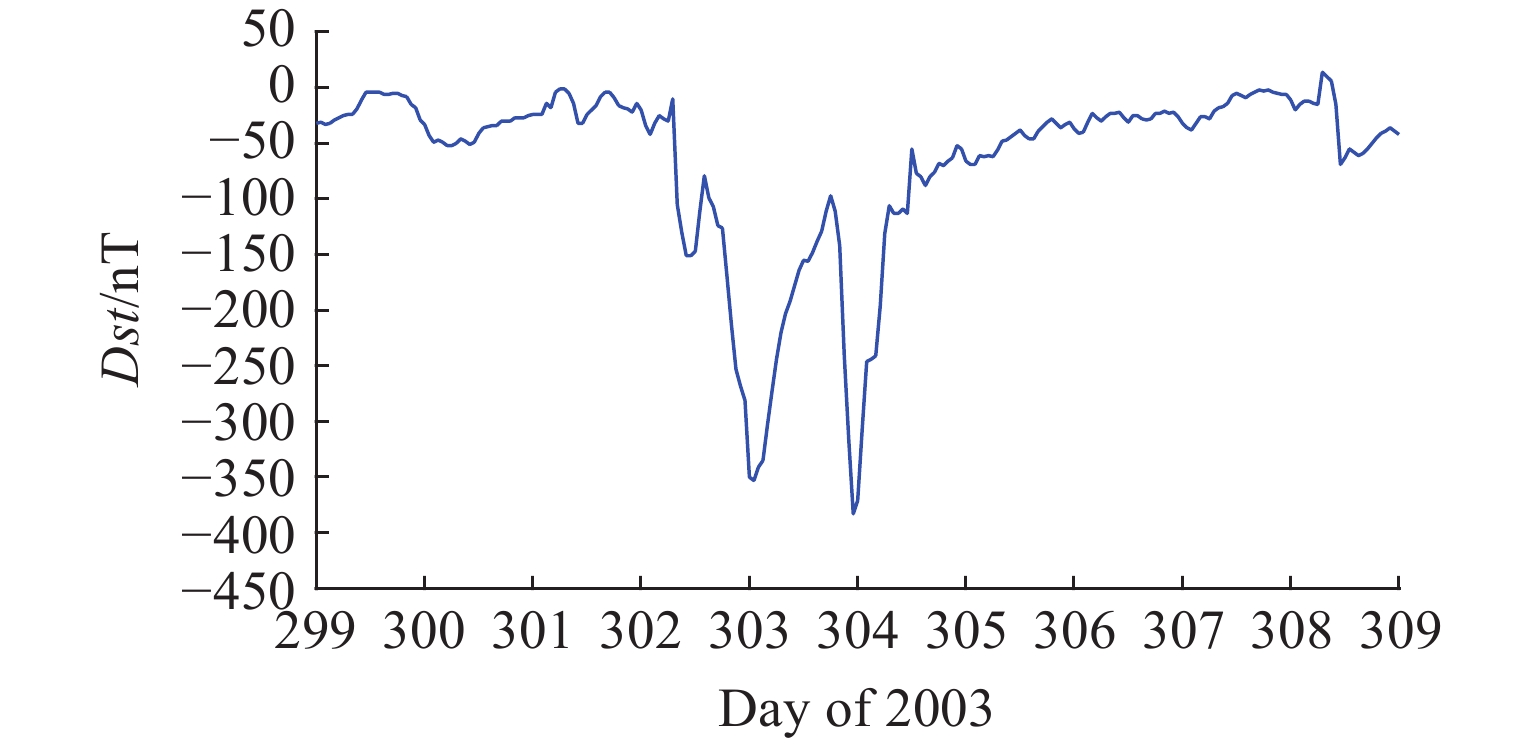
图 7 2003年11月17日(第321日)至11月26日(第330日)Dst指数的变化情况
Figure 7. Variation of the Dst index from 17 November (Day 321) to 26 November (Day 330) in 2003

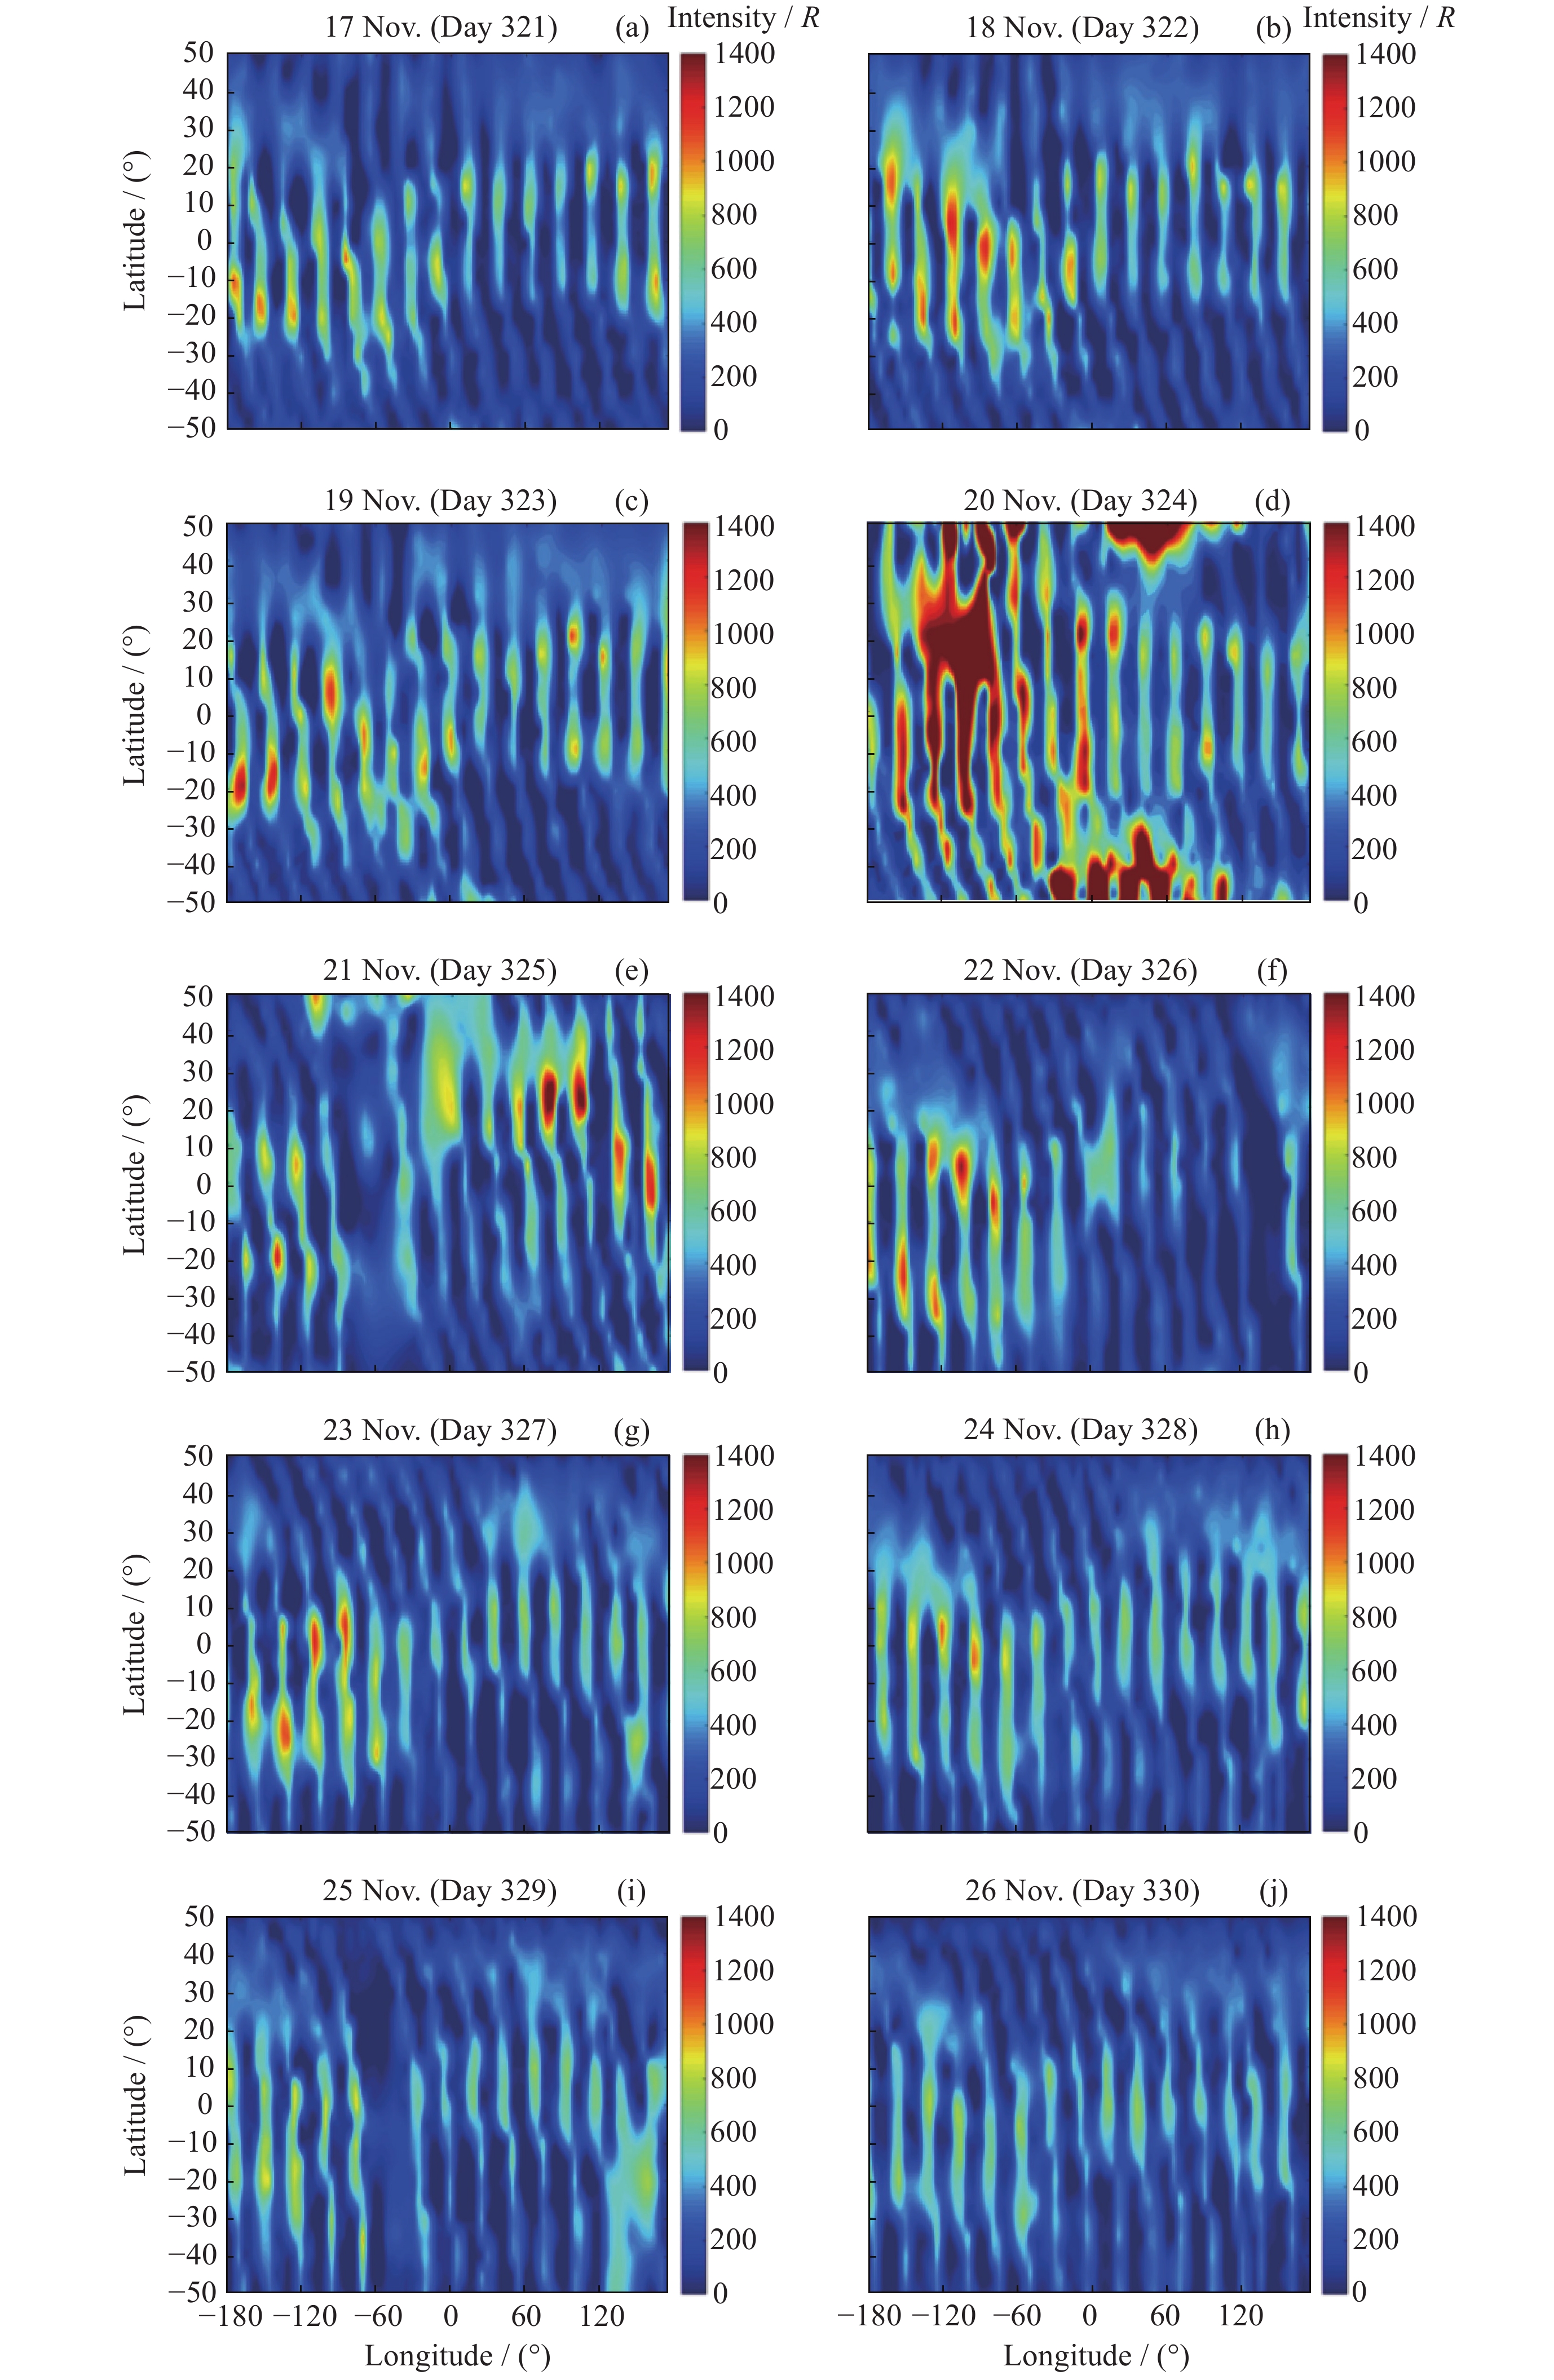
图 8 2003年11月17-26日OI 135.6 nm气辉辐射强度的经纬度分布情况
Figure 8. Longitude and latitude distributions of OI 135.6 nm airglow emission intensity from 17 to 26 November in 2003
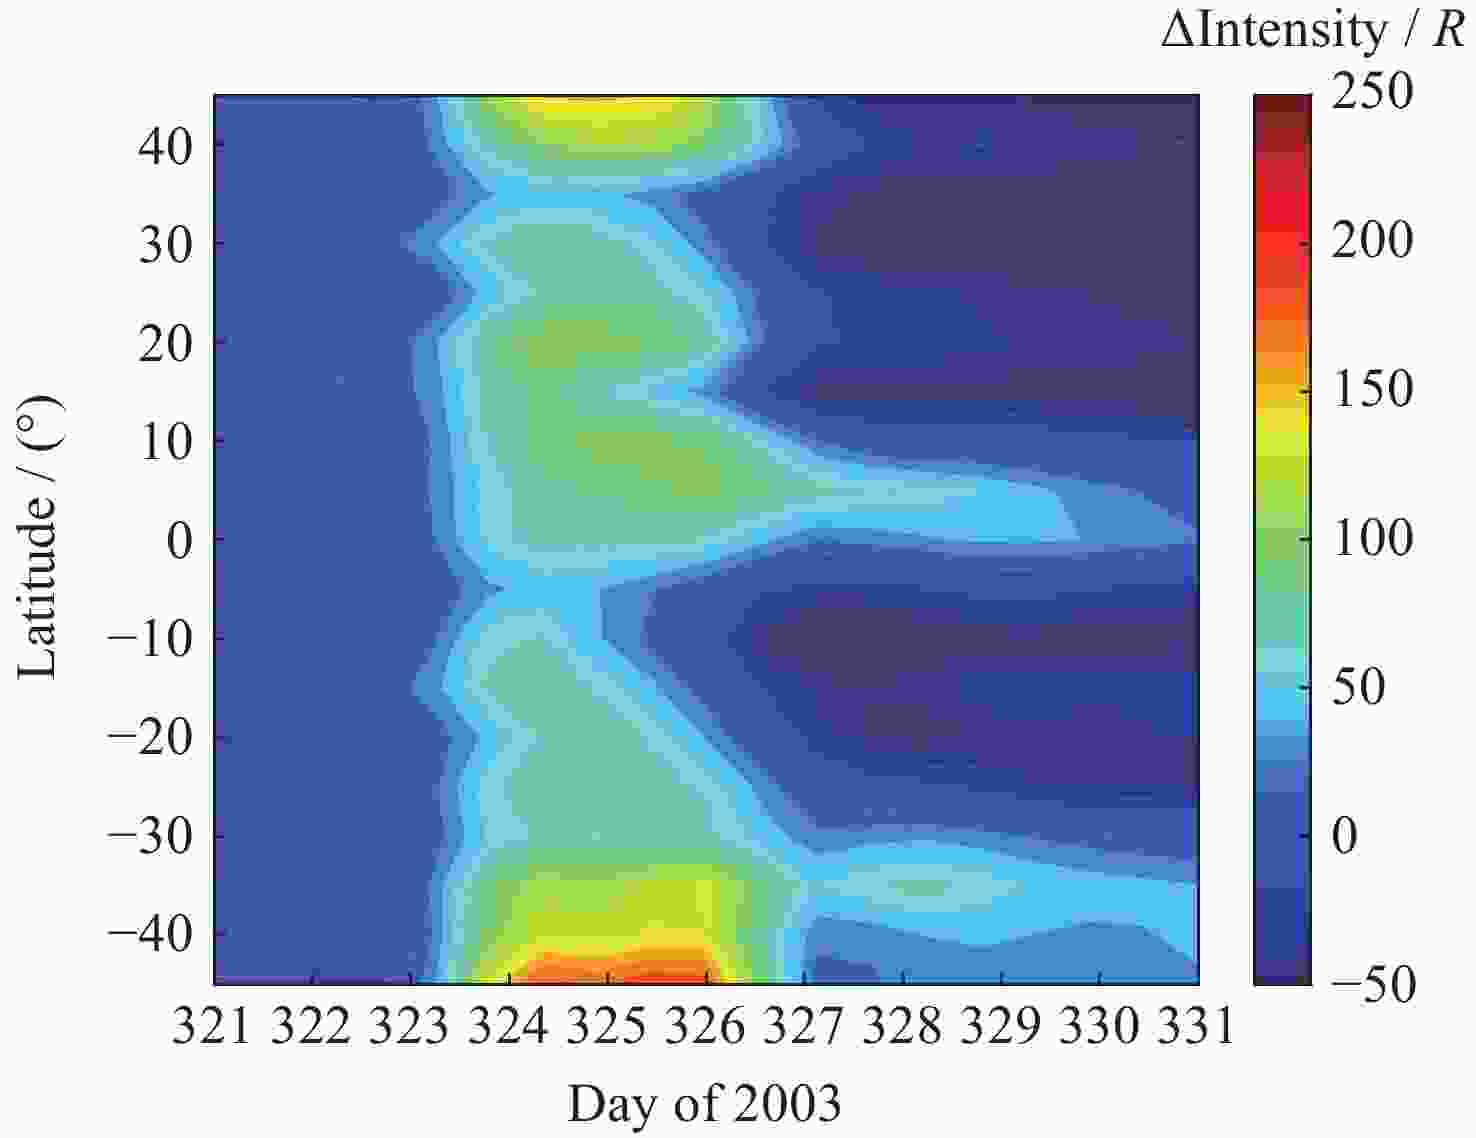
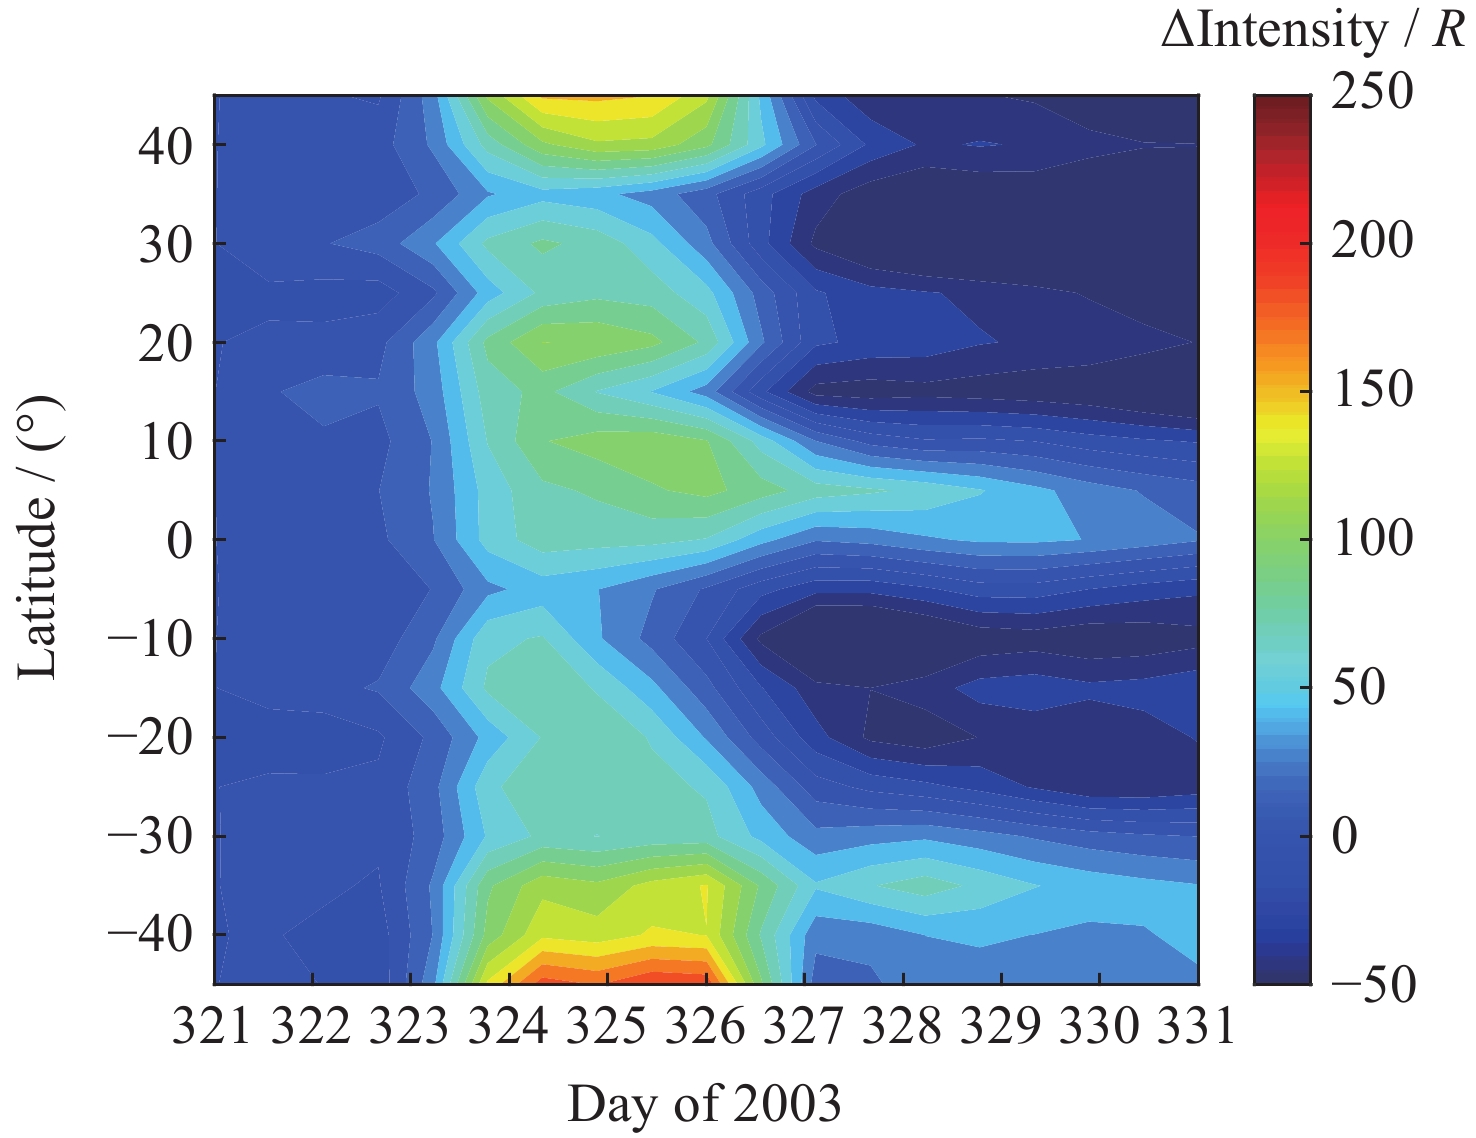
图 9 不同纬度OI 135.6 nm气辉辐射强度相较于磁静期的变化量在2003年11月17-26日的变化情况
Figure 9. Variation of OI 135.6 nm airglow emission intensity at different latitudes compared to the magnetostatic period from 17 to 26 November in 2003
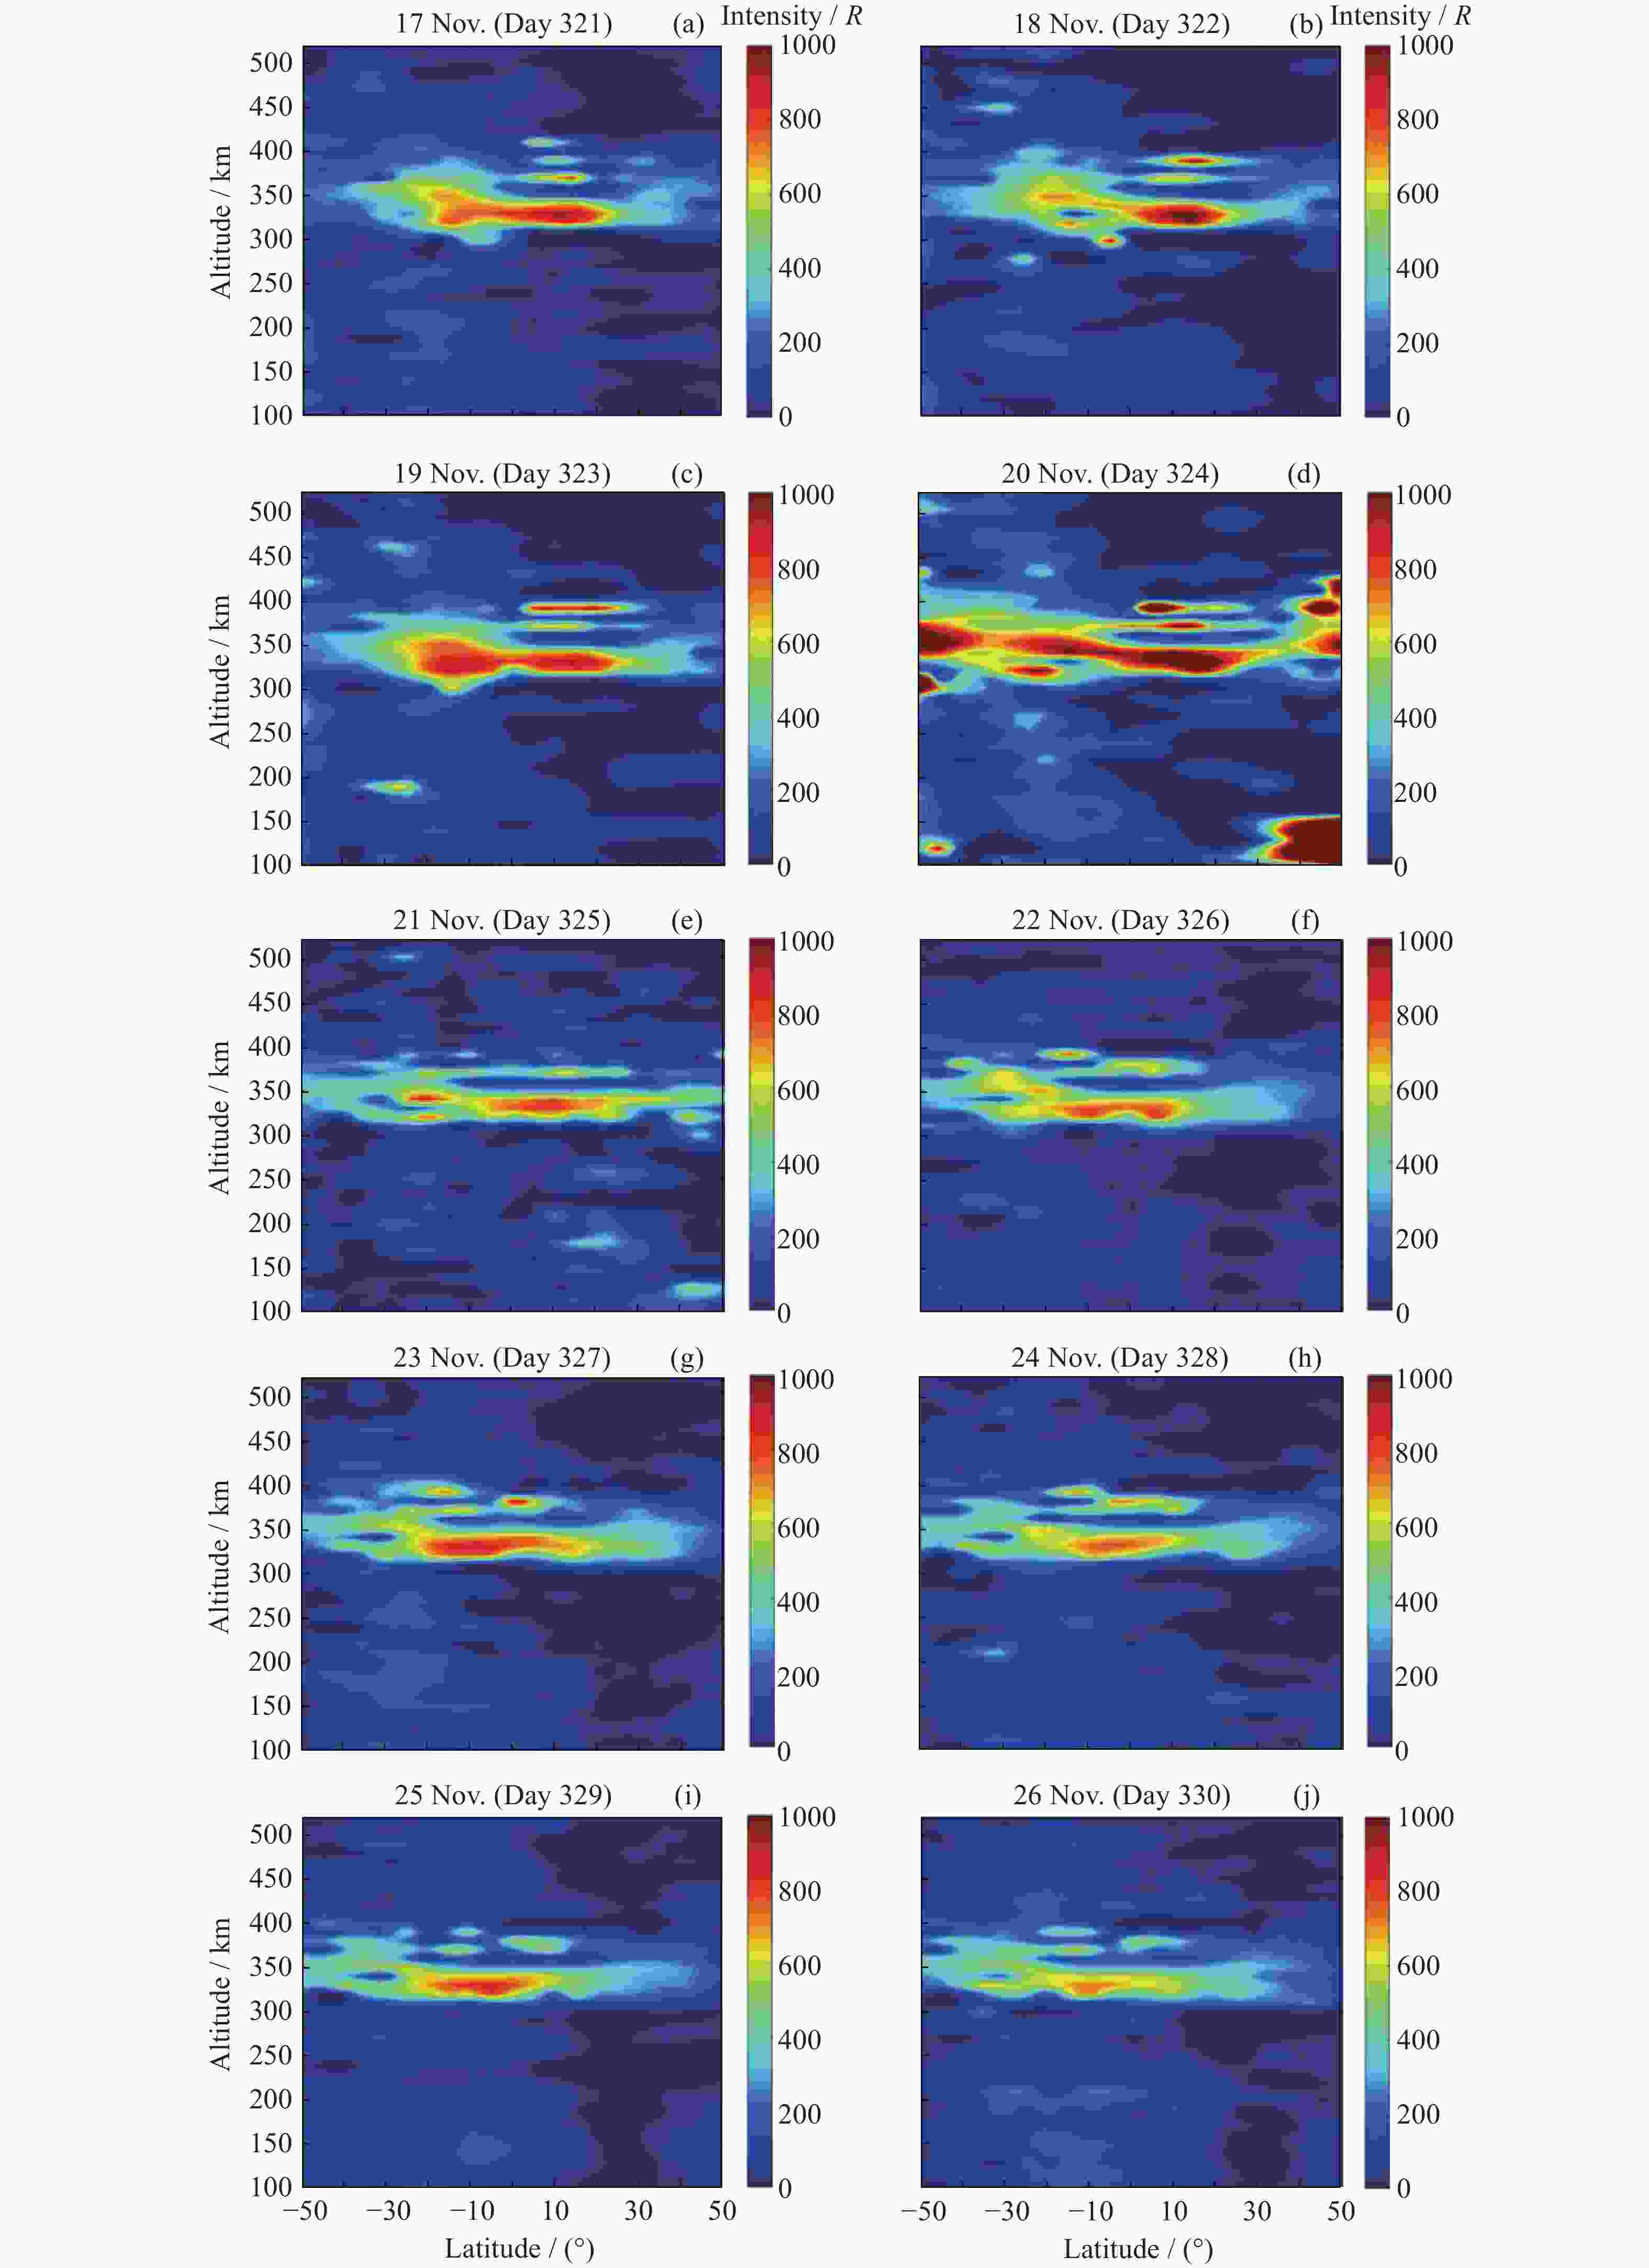
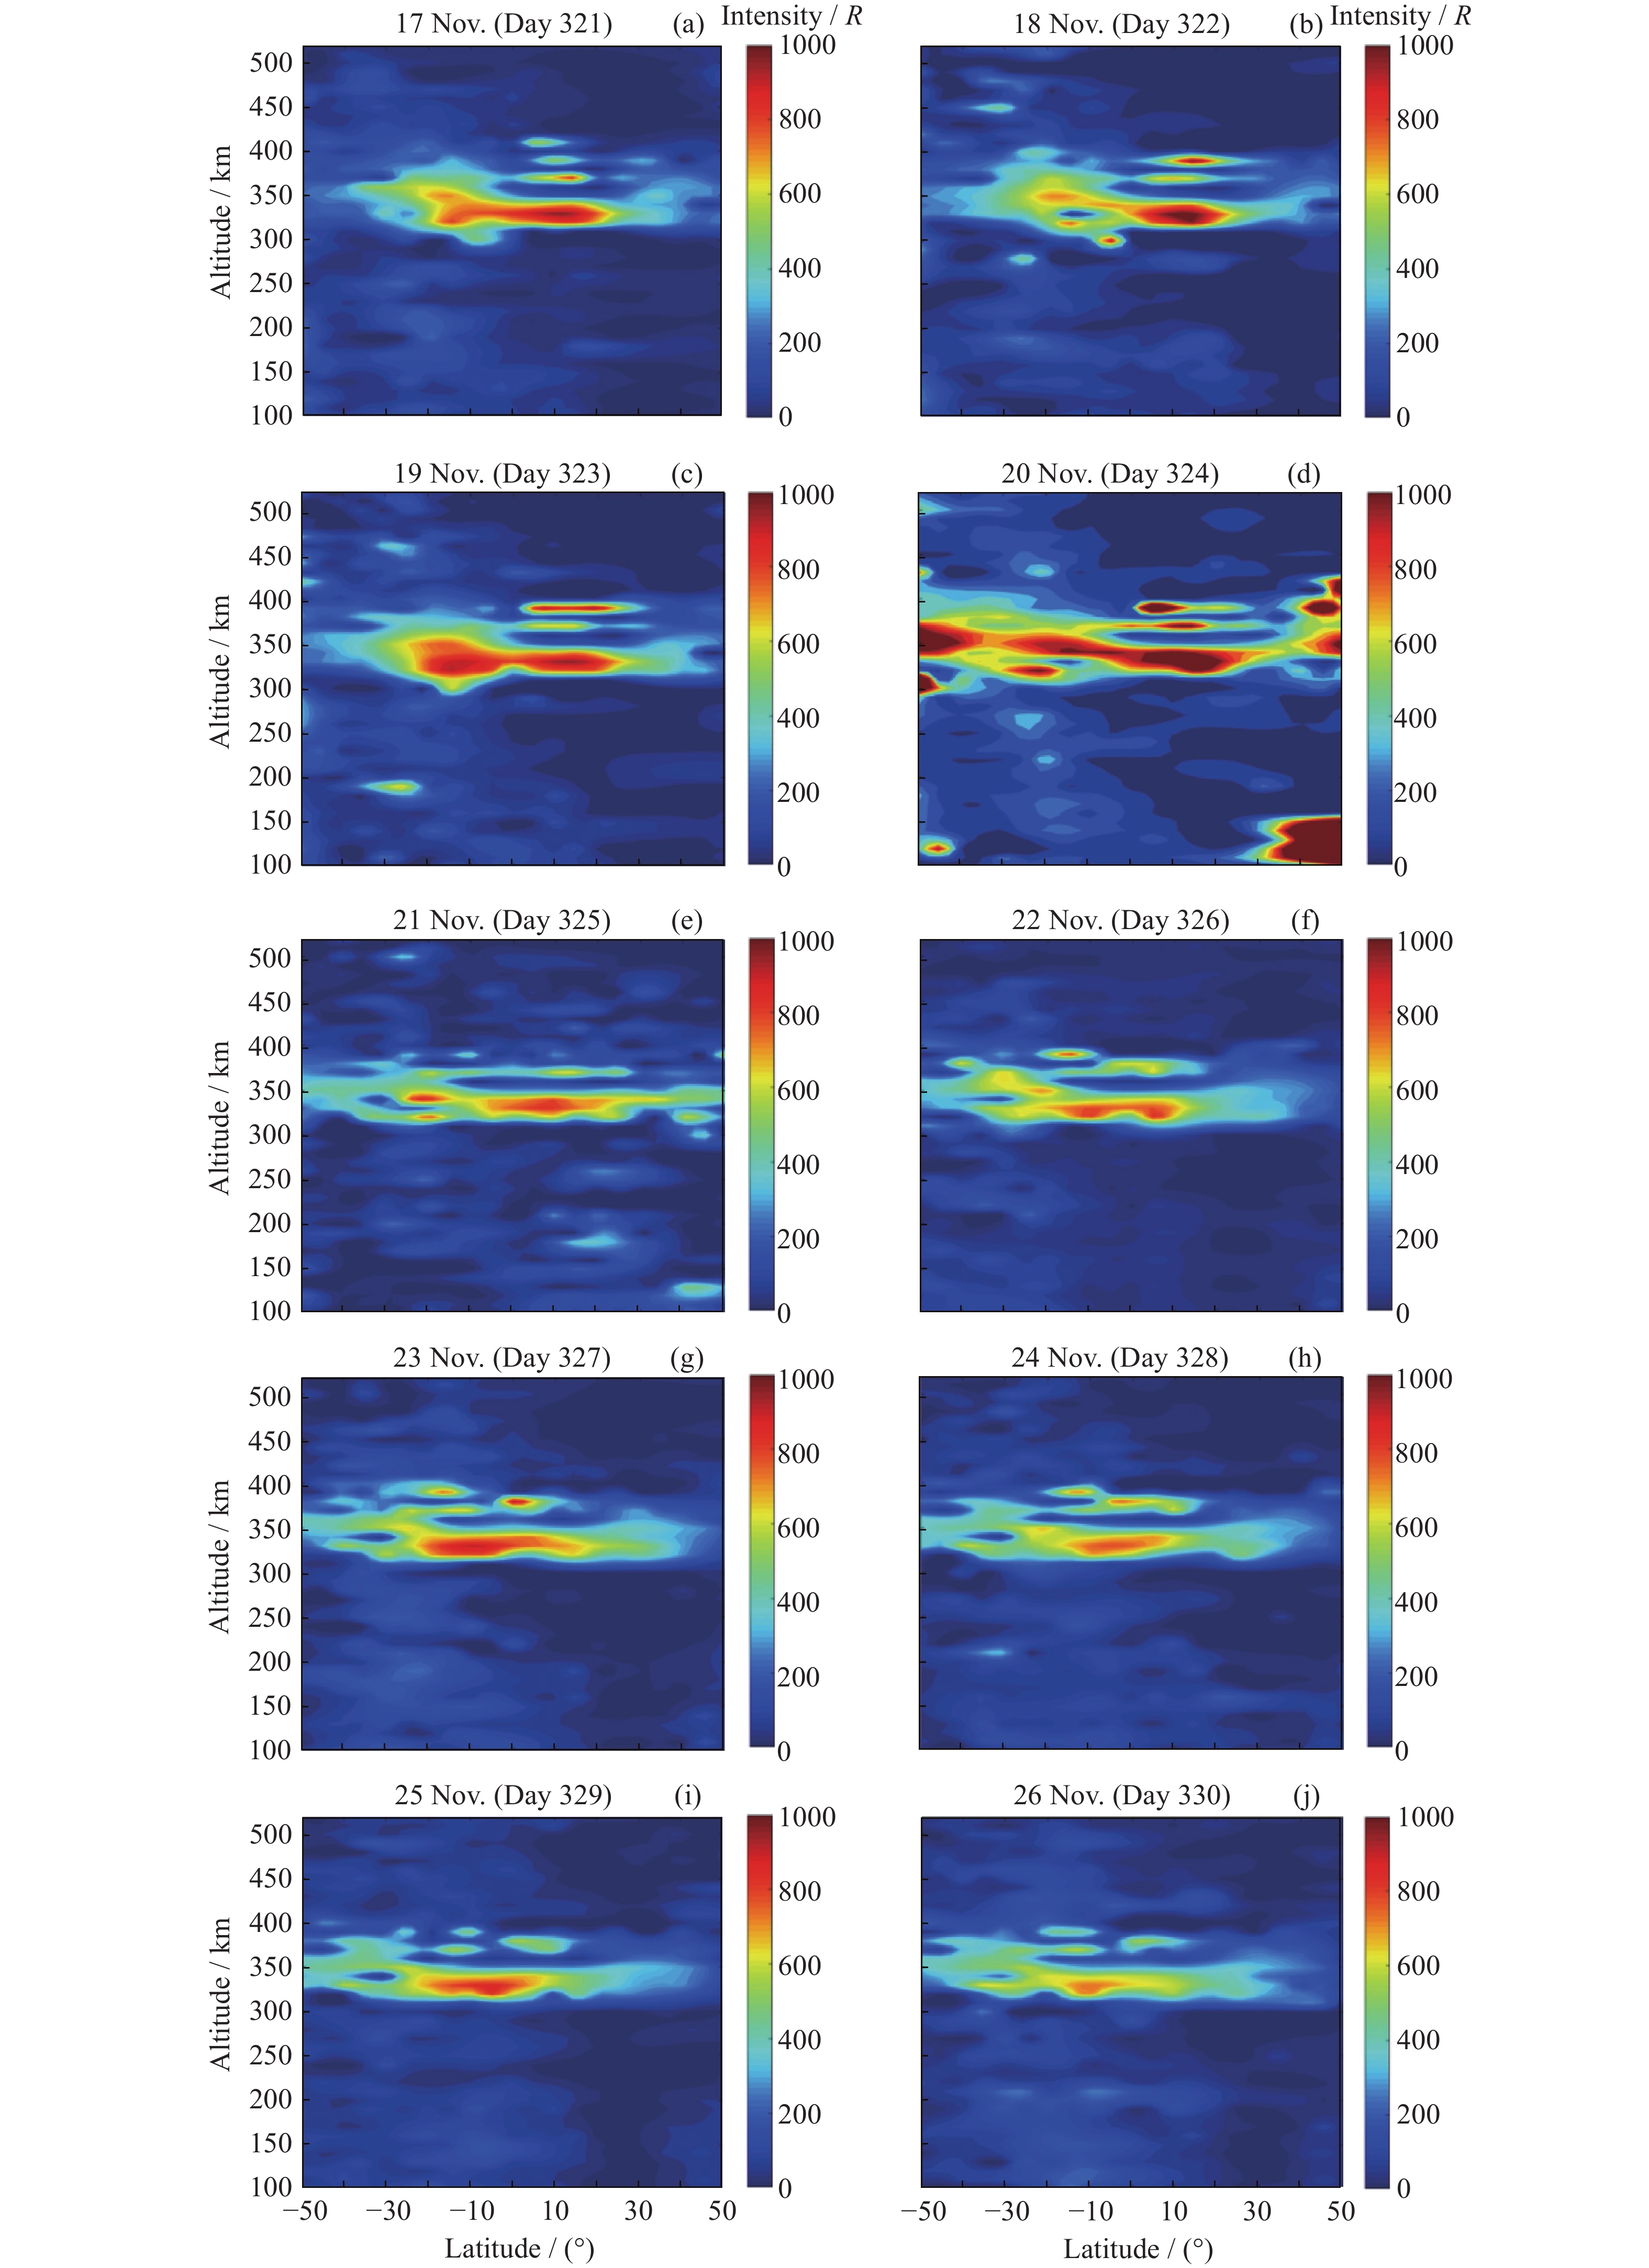
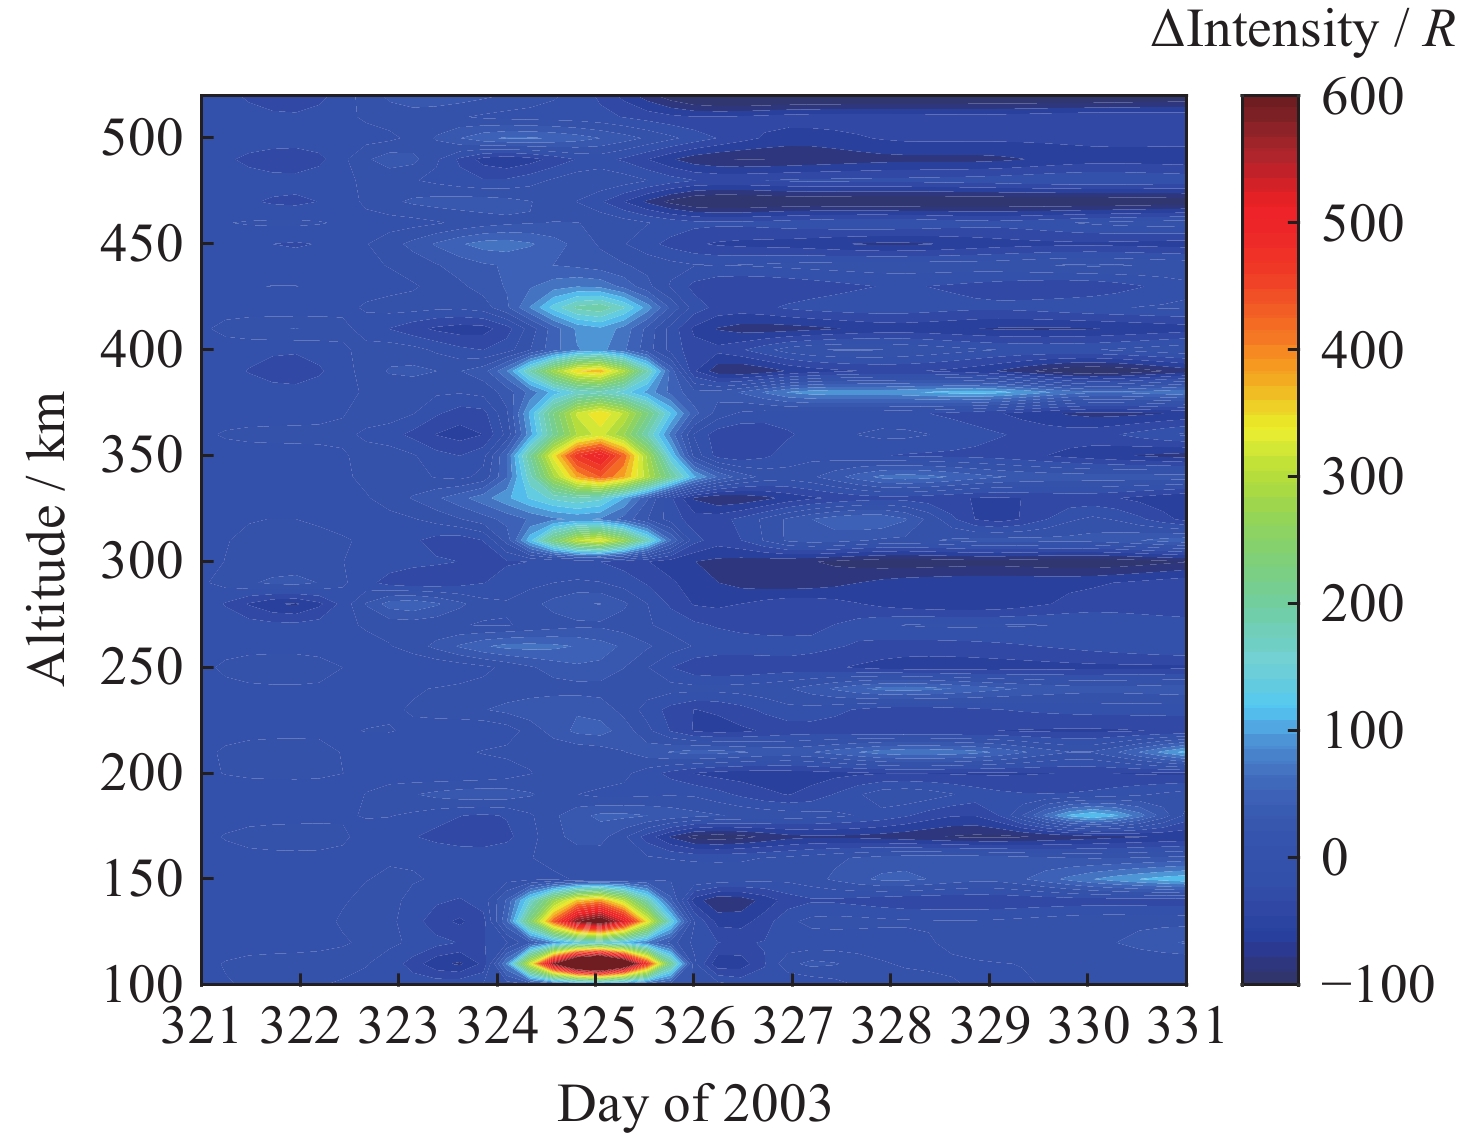
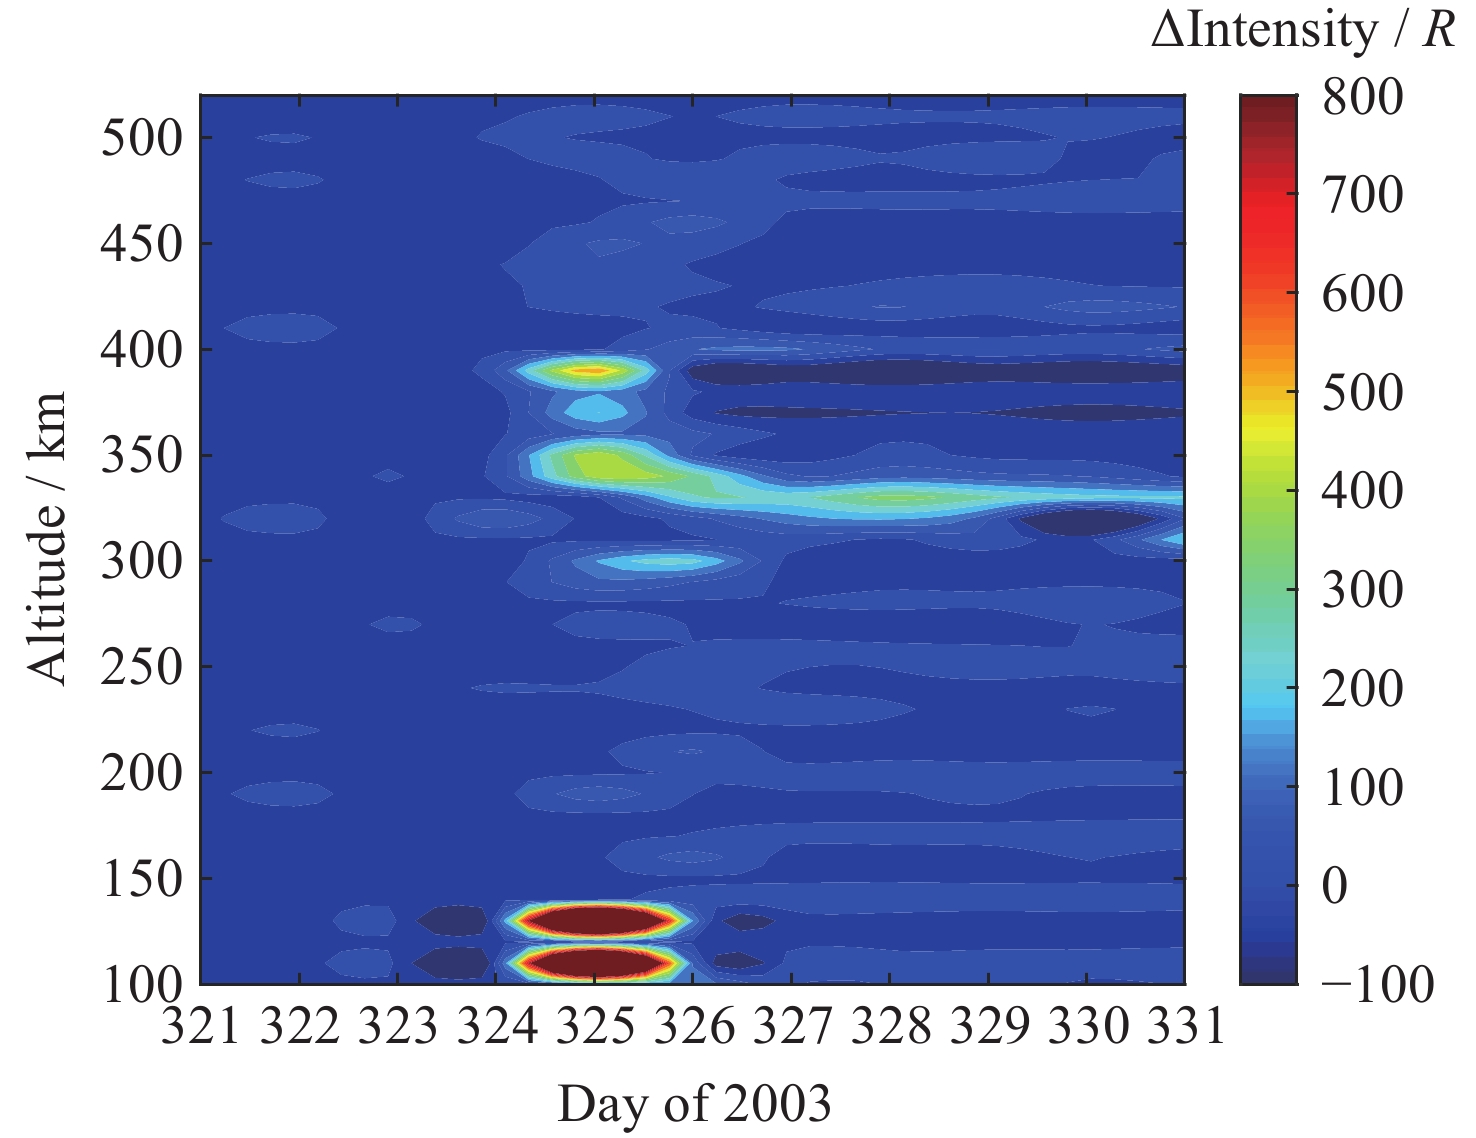
图 10 2003年11月17-26日OI 135.6 nm气辉辐射强度的纬度–高度分布情况
Figure 10. Latitude-altitude distributions of OI 135.6 nm airglow emission intensity from 17 to 26 November in 2003

图 11 不同高度OI 135.6 nm气辉辐射强度相较于磁静期的变化量在2003年11月17-26日的变化情况
Figure 11. Variation of OI 135.6 nm airglow emission intensity at different altitudes compared to the magnetostatic period from 17 to 26 November in 2003
-
[1] 高红, 徐寄遥, 陈光明, 等. TIMED卫星测量得到的OH和O2(1.27 μm)夜气辉全球分布特征[J]. 中国科学: 技术科学, 2011, 41(3): 374-384GAO Hong, XU Jiyao, CHEN Guangming, et al. Global distributions of OH and O2 (1.27 μm) nightglow emissions observed by TIMED satellite[J]. Science China Technological Sciences, 2011, 54(2): 447-456 [2] MEIER R R. Ultraviolet spectroscopy and remote sensing of the upper atmosphere[J]. Space Science Reviews, 1991, 58(1): 1-185 doi: 10.1007/BF01206000 [3] 王咏梅, 付利平, 王英鉴. 星载远紫外极光/气辉探测发展综述[J]. 地球物理学进展, 2008, 23(5): 1474-1479WANG Yongmei, FU Liping, WANG Yingjian. Review of space-based FUV aurora/airglow observations[J]. Progress in Geophysics, 2008, 23(5): 1474-1479 [4] KUPPERIAN JR J E, BYRAM E T, CHUBB T A, et al. Far ultraviolet radiation in the night sky[J]. Planetary and Space Science, 1959, 1(1): 3-6 doi: 10.1016/0032-0633(59)90015-7 [5] 王大鑫. 真空紫外电离层光学遥感辐射特性和反演算法研究[D]. 北京: 中国科学院大学(中国科学院国家空间科学中心), 2020WANG Daxin. Research on Radiation Characteristics and Inversion Algorithm of Vacuum Ultraviolet Ionospheric Optical Remote Sensing[D]. University of Chinese Academy of Sciences (National Space Science Center, the Chinese Academy of Sciences), 2020 [6] DYMOND K F. Remote sensing of nighttime F region peak height and peak density using ultraviolet line ratios[J]. Radio Science, 2009, 44(1): RS0A28 doi: 10.1029/2008RS004091 [7] STEPHAN A W, KORPELA E J, SIRK M M, et al. Daytime ionosphere retrieval algorithm for the ionospheric connection explorer (ICON)[J]. Space Science Reviews, 2017, 212(1/2): 645-654 [8] ZHANG S P, SHEPHERD G G. Neutral winds in the lower thermosphere observed by WINDII during the April 4–5th, 1993 storm[J]. Geophysical Research Letters, 2000, 27(13): 1855-1858 doi: 10.1029/2000GL000034 [9] SAHAI Y, SHIOKAWA K, OTSUKA Y, et al. Imaging observations of midlatitude ionospheric disturbances during the geomagnetic storm of February 12, 2000[J]. Journal of Geophysical Research: Space Physics, 2001, 106(A11): 24481-24492 doi: 10.1029/2000JA900169 [10] LEONOVICH L A, MIKHALEV A V, LEONOVICH V A. The 557.7 and 630-nm atomic oxygen midlatitude airglow variations associated with geomagnetic activity[J]. Atmospheric and Oceanic Optics, 2011, 24(4): 396-401 doi: 10.1134/S1024856011040105 [11] MUKHERJEE G K. Airglow and other F-layer variations in the Indian sector during the geomagnetic storm of February 5-7, 2000[J]. Earth, Planets and Space, 2006, 58(5): 623-632 doi: 10.1186/BF03351960 [12] GHODPAGE R N, PATIL P T, GURAV O B, et al. Ionospheric response to major storm of 17 th March 2015 using multi-instrument data over low latitude station Kolhapur (16.8°N, 74.2°E, 10.6°dip. Lat. )[J]. Advances in Space Research, 2018, 62(3): 624-637 doi: 10.1016/j.asr.2018.05.003 [13] KARAN D K, PALLAMRAJU D. Effect of geomagnetic storms on the daytime low-latitude thermospheric wave dynamics[J]. Journal of Atmospheric and Solar-Terrestrial Physics, 2018, 170: 35-47 doi: 10.1016/j.jastp.2018.02.003 [14] ISHIMOTO M, ROMICK G J, PAXTON L J, et al. Night UV spectra (1100-2900Å) at mid and low latitude during a magnetic storm[J]. Geophysical Research Letters, 1992, 19(8): 813-816 doi: 10.1029/92GL00398 [15] TINSLEY B A, ROHRBAUGH R P, ISHIMOTO M, et al. Middle- and low-latitude emissions from energetic neutral atom precipitation seen from ATLAS 1 under quiet magnetic conditions[J]. Journal of Geophysical Research: Space Physics, 1994, 99(A10): 19577-19584 doi: 10.1029/94JA01265 [16] STEPHAN A W, CHAKRABARTI S, COTTON D M. Evidence of ENA precipitation in the EUV dayglow[J]. Geophysical Research Letters, 2000, 27(18): 2865-2868 doi: 10.1029/2000GL000040 [17] DEMAJISTRE R, BRANDT P C, IMMEL T J, et al. Storm-time enhancement of mid-latitude ultraviolet emissions due to energetic neutral atom precipitation[J]. Geophysical Research Letters, 2005, 32(15): L15105 doi: 10.1029/2005GL023059 [18] ZHANG Y, PAXTON L J, KOZYRA J U, et al. Nightside thermospheric FUV emissions due to energetic neutral atom precipitation during magnetic superstorms[J]. Journal of Geophysical Research: Space Physics, 2006, 111(A9): A09307 doi: 10.1029/2005JA011152 [19] 王大鑫, 付利平, 江芳, 等. 利用FY-3(D)卫星电离层光度计数据反演电离层O/N2[J]. 光谱学与光谱分析, 2021, 41(4): 1004-1010WANG Daxin, FU Liping, JIANG Fang, et al. Inversion of ionospheric O/N2 by using FY-3 D ionospheric photometer data[J]. Spectroscopy and Spectral Analysis, 2021, 41(4): 1004-1010 [20] JIANG F, MAO T, ZHANG X X, et al. Nightside 135.6 nm emission enhancements of mid/low latitudes during geomagnetic storms as observed by the ionosphere Photo Meter (IPM) on the Chinese meteorological satellite FY-3 D[J]. Advances in Space Research, 2023, 71(6): 2781-2798 doi: 10.1016/j.asr.2022.11.025 [21] ZHANG Y L, PAXTON L J, HUANG C S, et al. FUV observations of variations in thermospheric composition and topside ionospheric density during the November 2004 magnetic superstorm[J]. Journal of Atmospheric and Solar-Terrestrial Physics, 2022, 228: 105832 doi: 10.1016/j.jastp.2022.105832 [22] 王静. 远紫外遥感电离层关键参量的反演技术研究[D]. 北京: 北京理工大学, 2015WANG Jing. Research on Inversion Techniques for Key Ionospheric Parameters in Far Ultraviolet Remote Sensing[D]. Beijing: Beijing Institute of Technology, 2015 [23] HUFFMAN R E. Atmospheric Ultraviolet Remote Sensing[M]. Boston: Academic Press, 1992 [24] 郭兵. 电离层扩展F不规则体及赤道异常驼峰区波状结构的研究[D]. 北京: 中国科学院大学(中国科学院国家空间科学中心), 2020GUO Bing. Study on Ionospheric Spread-F at Low- and Mid-latitude and Wavelike Structure in Equatorial Ionization Anomaly Crests[D]. Beijing: University of Chinese Academy of Sciences (National Space Science Center, the Chinese Academy of Sciences), 2020 [25] CHRISTENSEN A B, WALTERSCHEID R L, ROSS M N, et al. Global Ultraviolet Imager (GUVI) for the NASA Thermosphere-Ionsphere-Mesosphere Energetics and Dynamics (TIMED) mission[J]. Proceedings of SPIE - The International Society for Optical Engineering, 1994, 2266: 451-466 [26] PEACOCK K. Spectrographs in space[C]//Proceedings of the SPIE 3116, Small Spacecraft, Space Environments, and Instrumentation Technologies. San Diego: SPIE, 1997: 57-68 [27] JIANG F, MAO T, ZHANG X X, et al. Observation of thermosphere and ionosphere using the ionosphere PhotoMeter (IPM) on the Chinese meteorological satellite FY-3 D[J]. Advances in Space Research, 2020, 66(9): 2151-2167 doi: 10.1016/j.asr.2020.07.027 [28] ZENG Z, BURNS A, WANG W B, et al. Ionospheric annual asymmetry observed by the COSMIC radio occultation measurements and simulated by the TIEGCM[J]. Journal of Geophysical Research: Space Physics, 2008, 113(A7): A07305 doi: 10.1029/2007JA012897 -
-

 下载:
下载:


计量
- 文章访问数: 973
- HTML全文浏览量: 389
- PDF下载量: 94
-
被引次数:
0(来源:Crossref)
0(来源:其他)

