飓风天气下机载SFMR与星载微波遥感海面风速的对比分析
doi: 10.11728/cjss2023.06.2023-0062 cstr: 32142.14.cjss2023.06.2023-0062
Comparisons of SFMR and Satellite Microwave Remote Sensed Sea Surface Wind Speed in Hurricane Weather
-
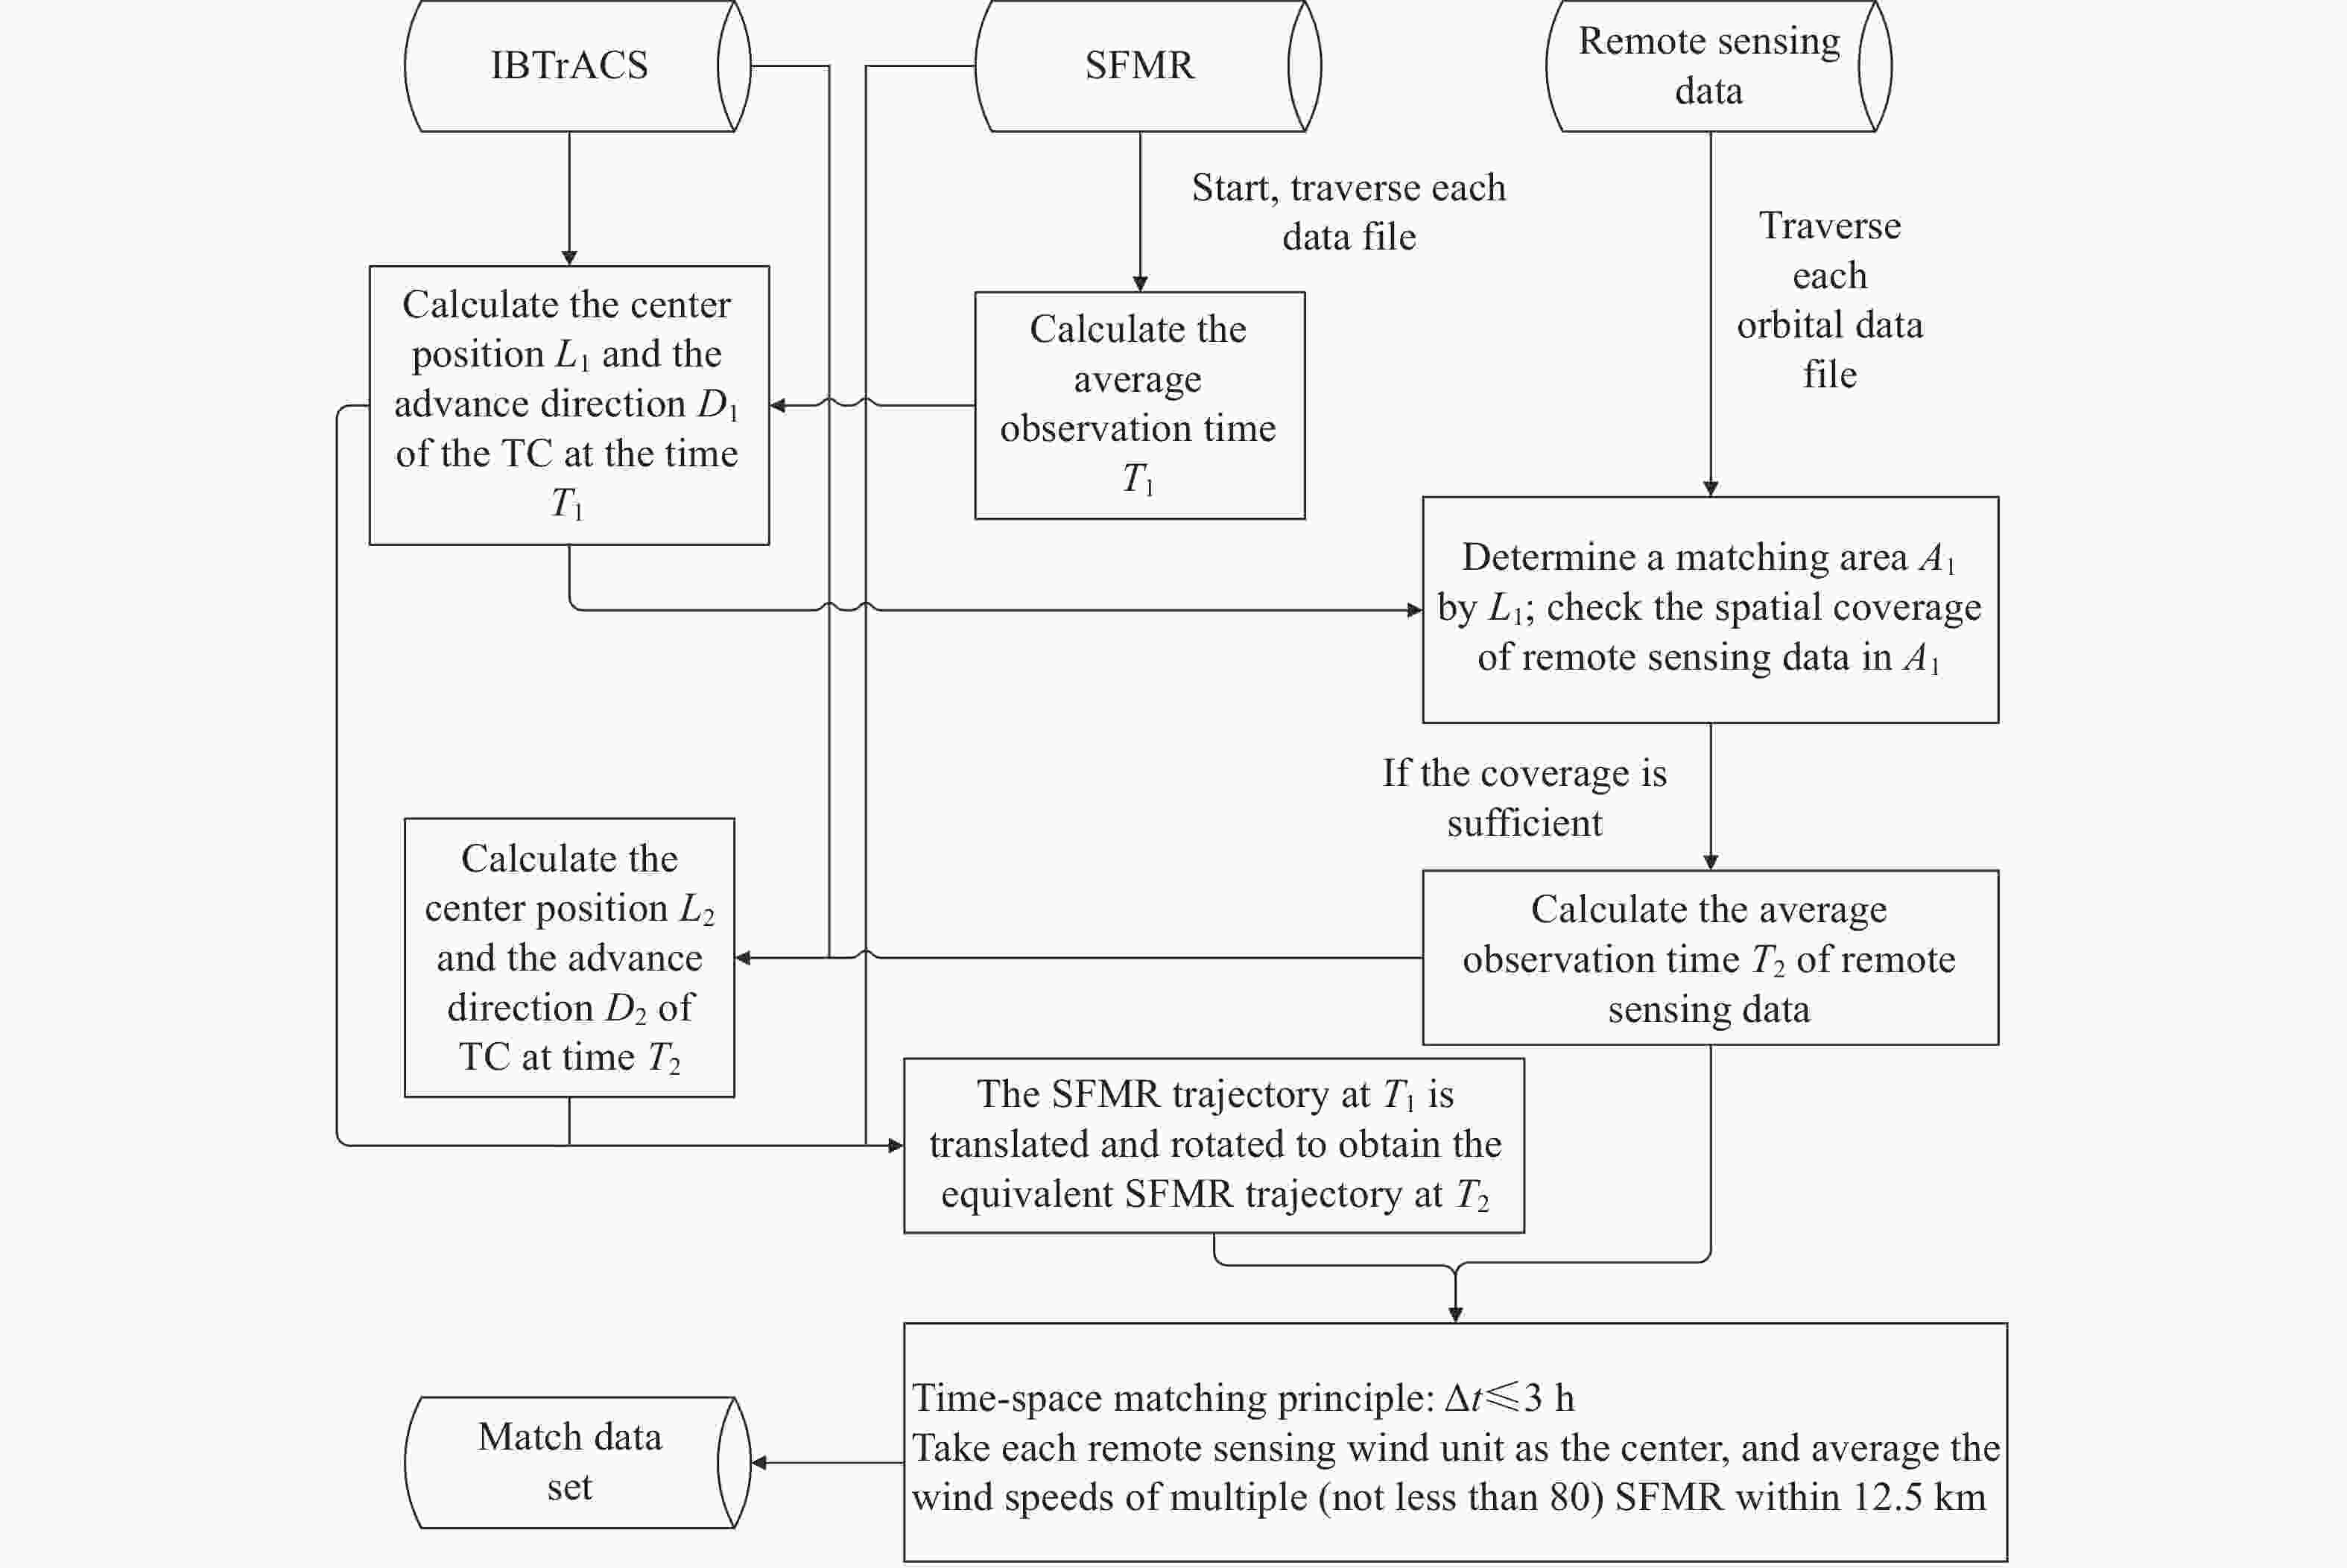
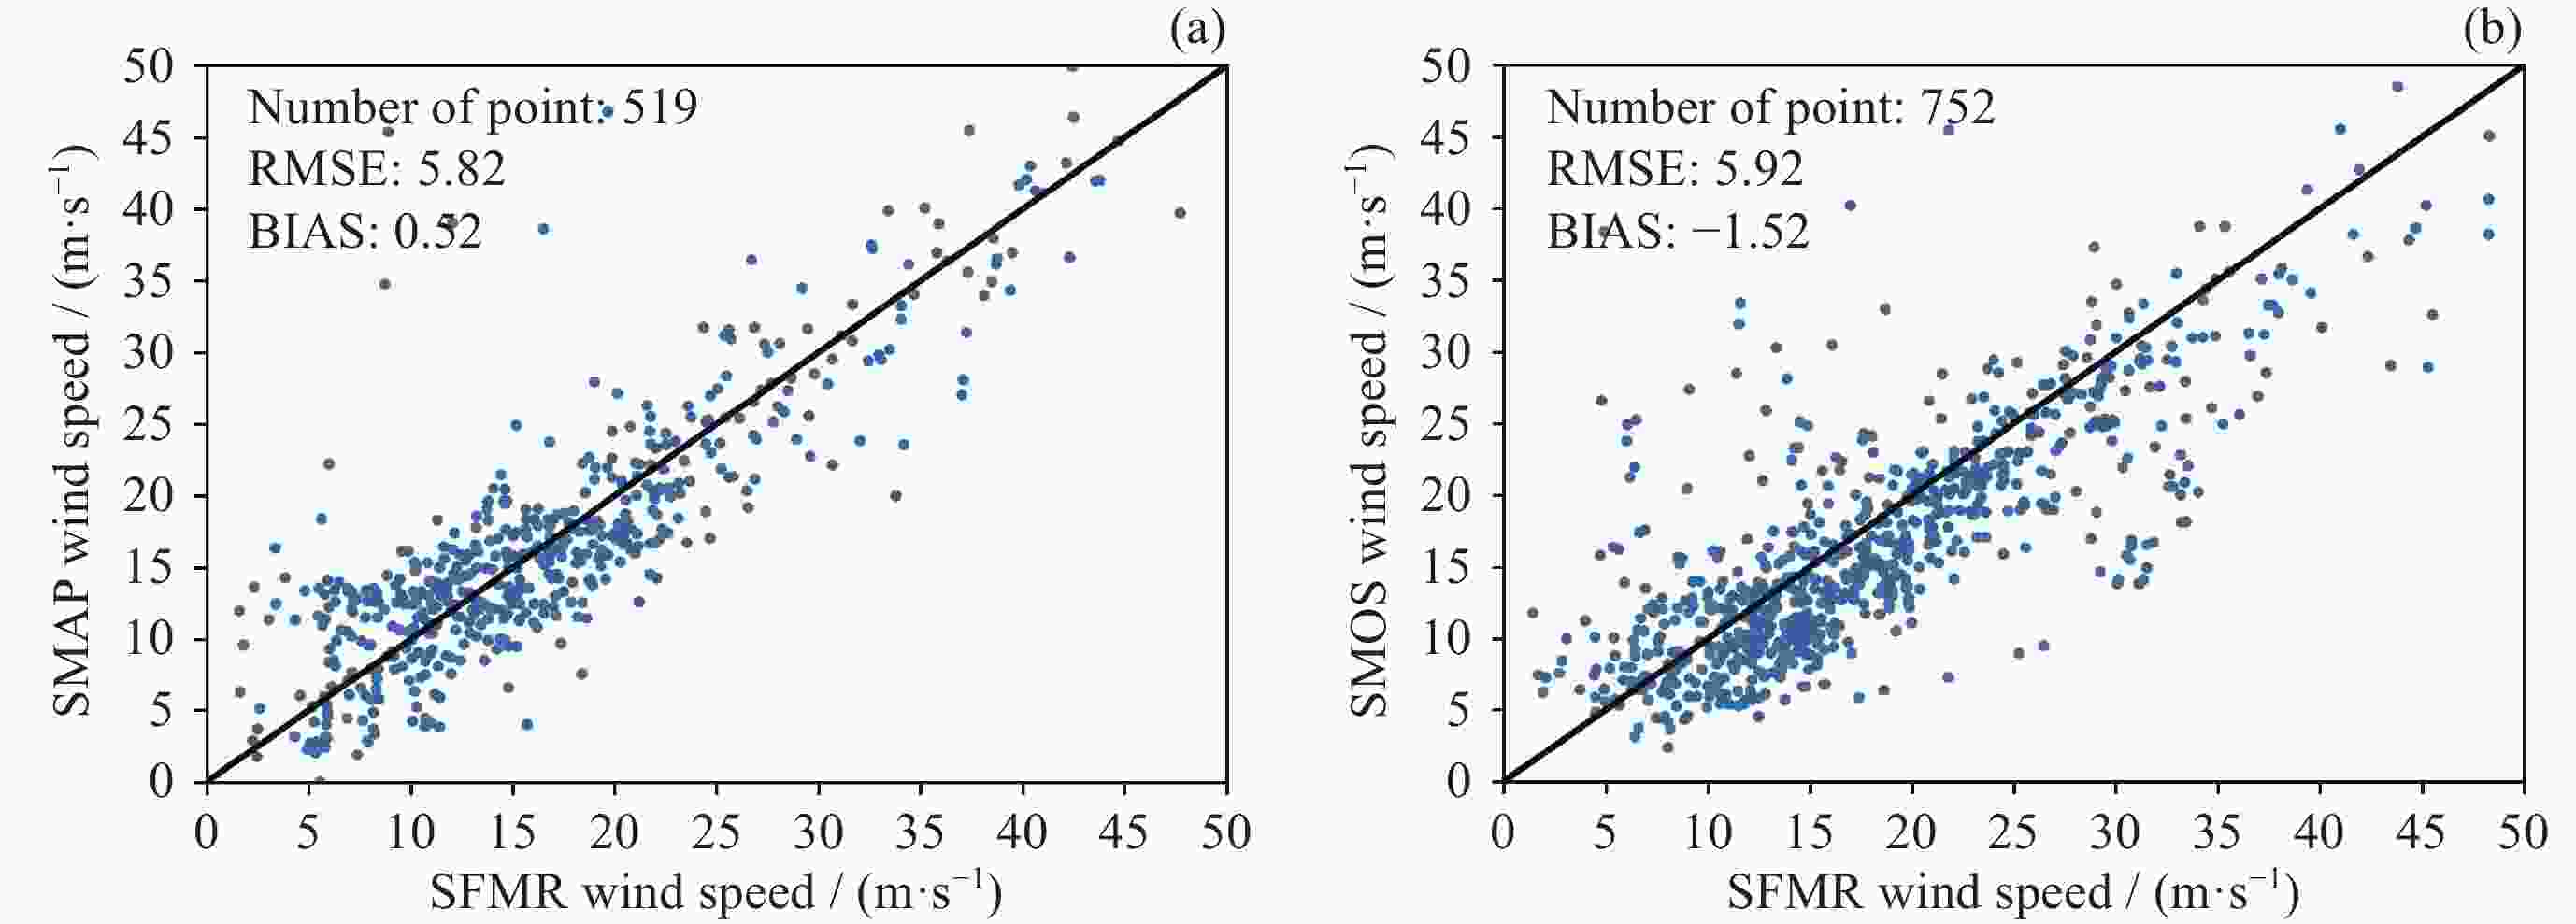
摘要: 飓风天气下多种探测技术提供的海面风速的一致性备受关注。飓风侦察机搭载的步进频率微波辐射计(SFMR)提供的海面高风速数据是海面风速最主要的现场观测数据源。本文旨在分析SFMR风速与星载微波散射计(C波段欧洲MetOp系列卫星散射计ASCAT,Ku波段中法海洋卫星散射计CSCAT和中国HY-2系列卫星散射计HSCAT)和微波辐射计(SMAP和SMOS)遥感风速的一致性。通过分析SFMR风速随空间尺度变化的关系,进而提出了SFMR与散射计和辐射计数据进行时空匹配的方法。结果表明,高风速(>15 m·s–1)辐射计比散射计风速与SFMR风速的一致性更好,风速高于25 m·s–1时Ku波段散射计风速趋于饱和。高风速下降雨也是影响散射计风速误差的重要因素,但依赖于风速的误差显著高于降雨影响带来的误差。基于SFMR数据进一步揭示了星载微波散射计和辐射计提供海面风速的误差特征,为遥感数据应用提供参考。Abstract: The accuracy and consistency of sea surface wind speed measurements during hurricane conditions have garnered significant attention. Among the various techniques, the Stepping Frequency Microwave Radiometer (SFMR) provides crucial in-situ data on sea surface high wind speeds. This study aims to compare wind speed measurements obtained from SFMR with those from space-borne microwave scatterometers such as the C-band European MetOp series satellite Scatterometer ASCAT, the Ku-band China-France Oceanography Satellite (CFOSAT) Scatterometer CSCAT, and the Chinese HY-2 series satellite Scatterometer HSCAT, as well as microwave radiometers such as SMAP and SMOS. We establish the relationship between SFMR wind speed and spatial scale and propose a spatio-temporal matching method to align SFMR data with scatterometer and radiometer data. This method assumes that the spatial distribution of TC wind field is unchanged relative to the hurricane direction in a certain time range. According to the TC center path information of IBTrACS, the trajectory of SFMR is transformed into the relative coordinates of storm movement, which effectively extending the matching time difference between SFMR, scatterometer and radiometer sea surface wind speed data to 3 hours. Our findings indicate that radiometer measurements of high wind speeds (>15 m·s–1) exhibit greater consistency with SFMR compared to scatterometer measurements, and Ku-band scatterometer measurements tend to saturate when wind speeds exceed 25 m·s–1. The spatio-temporal matching results of SMAP and HSCAT also showed the same distribution characteristics. However, the ASCAT wind speed of C-band scatterometer still shows the overall increasing distribution characteristics. Additionally, Rainfall during high wind conditions significantly affects scatterometer wind speed error is still observed by us, although the error associated with wind speed is more pronounced. This study contributes to a better understanding of the error characteristics of sea surface wind speed measurements obtained from space-borne microwave scatterometers and radiometers, thereby offering valuable insights for the application of remote sensing data, subsequent research can analyze the contribution of different data sources in the physical meaning of wind speed to the consistency analysis results.
-
Key words:
- Hurricane /
- SFMR /
- Microwave scatterometer /
- Mcrowave radiometer /
- High wind speed /
- Authenticity test
-
图 4 2017年9月3日飓风Irma期间NOAA SFMR170903 H1航班(彩色线)的地理坐标(a)和极坐标(b)。散点的时间间隔为 3 h,黑色“+”号表示SFMR观测时间T1对应的飓风中心位置
Figure 4. Geographic coordinates (a) and polar coordinates (b) of NOAA SFMR flight 170903 H1 (color line) during Hurricane Irma on 3 September 2017. The time interval of each scatter point is 3 h. The marker “+” indicating the hurricane center at the time of SFMR T1
表 1 星载微波散射计和微波辐射计数据基本信息
Table 1. Basic information of space-borne microwave scatterometer and microwave radiometer data
卫星平台 遥感器 遥感器类型 主要波段 卫星降交点(LT) 数据时间(年/月) MetOp-A ASCAT-A 散射计 C波段 09:30 2019/01-2021/10 MetOp-B ASCAT-B 散射计 C波段 09:30 2019/01-2021/11 MetOp-C ASCAT-C 散射计 C波段 09:30 2019/01-2021/11 CFOSAT CSCAT 散射计 Ku波段 06:30 2019/01-2021/12 HY-2B HSCAT-B 散射计 Ku波段 06:00 2019/01-2021/12 HY-2C HSCAT-C 散射计 Ku波段 不固定 2020/09-2021/12 HY-2D HSCAT-D 散射计 Ku波段 不固定 2021/05-2021/12 SMAP SMAP 辐射计 L波段 06:00 2019/01-2021/12 SMOS SMOS 辐射计 L波段 18:00 2019/01-2021/08 表 2 散射计和辐射计与SFMR配对数据的总体对比结果
Table 2. Overall comparisons of scatterometer or radiometer and SFMR wind speed
遥感器类型 风速数据源 飓风数量 配对数据量 RMSE/(m·s–1) BIAS/(m·s–1) 散射计 HSCAT 18 2126 7.82 –4.67 散射计 CSCAT 14 1234 7.72 –4.39 散射计 ASCAT 16 2739 7.32 –4.40 辐射计 SMOS 9 752 5.92 –1.52 辐射计 SMAP 13 519 5.82 +0.52 表 3 不同风速和降雨强度区间散射计与SFMR风速对比结果
Table 3. Comparisons of scatterometer and SFMR wind speed under different wind speed and rainfall intensity conditions
风速数据源 平均风速/(m·s–1) 降雨强度≤2.1 mm·h–1 降雨强度>2.1 mm·h–1 配对数据量 RMSE/(m·s–1) BIAS/(m·s–1) 配对数据量 RMSE/(m·s–1) BIAS/(m·s–1) ASCAT $v $≤15 960 4.21 –1.11 215 3.82 –0.97 15<$v $≤25 566 6.70 –4.65 659 7.65 –6.07 $v $>25 38 12.31 –10.42 301 13.74 –12.44 CSCAT $v $≤15 466 3.60 –0.56 98 4.18 –1.64 15<$v $≤25 273 6.48 –4.68 273 8.18 –6.62 $v $>25 8 7.90 –6.77 116 17.48 –16.06 HSCAT $v $≤15 919 3.65 –1.49 82 4.98 +0.60 15<$v $≤25 463 5.64 –4.18 433 7.54 –6.30 $v $>25 25 14.48 –13.47 204 18.66 –17.71 表 4 不同平均风速区间SFMR分别与SMOS和SMAP风速对比结果
Table 4. Comparison results of SFMR with SMOS and SMAP in different average wind speed intervals
风速数据源 风速/(m·s–1) 配对数据量 RMSE/(m·s–1) BIAS/(m·s–1) SMAP $v $≤15 257 4.27 0.56 15<$v $≤25 175 4.09 –0.48 $v $>25 87 10.70 2.40 SMOS $v $≤15 339 4.45 –1.06 15<$v $≤25 274 6.75 –1.35 $v $>25 139 7.18 –2.97 -
[1] MEISSNER T, RICCIARDULLI L, WENTZ F J. Capability of the SMAP mission to measure ocean surface winds in storms[J]. Bulletin of the American Meteorological Society, 2017, 98(8): 1660-1677 doi: 10.1175/BAMS-D-16-0052.1 [2] REUL N, CHAPRON B, ZABOLOTSKIKH E, et al. A revised L-band radio-brightness sensitivity to extreme winds under tropical cyclones: the five year SMOS-storm database[J]. Remote Sensing of Environment, 2016, 180: 274-291 doi: 10.1016/j.rse.2016.03.011 [3] SAPP J W, ALSWEISS S O, JELENAK Z, et al. Stepped frequency microwave radiometer wind-speed retrieval improvements[J]. Remote Sensing, 2019, 11(3): 214 doi: 10.3390/rs11030214 [4] RICCIARDULLI L, FOLTZ G R, MANASTER A, et al. Assessment of saildrone extreme wind measurements in hurricane Sam using MW satellite sensors[J]. Remote Sensing, 2022, 14(12): 2726 doi: 10.3390/rs14122726 [5] TIAN D, ZHANG H, WANG S, et al. Sea surface wind structure in the outer region of tropical cyclones observed by wave gliders[J]. Journal of Geophysical Research: Atmospheres, 2023, 128(3): e2022JD037235 doi: 10.1029/2022JD037235 [6] 刘思琦, 林文明, 王志雄, 等. 基于HY-2B散射计的热带气旋定位定强研究[J]. 海洋学报, 2021, 43(11): 146-156LIU Siqi, LIN Wenming, WANG Zhixiong, et al. Determination of tropical cyclone location and intensity using HY-2B scatterometer data[J]. Acta Oceanologica Sinica, 2021, 43(11): 146-156 [7] UHLHORN E W, BLACK P G, FRANKLIN J L, et al. Hurricane surface wind measurements from an operational stepped frequency microwave radiometer[J]. Monthly Weather Review, 2007, 135(9): 3070-3085 doi: 10.1175/MWR3454.1 [8] POLVERARI F, SAPP J W, PORTABELLA M, et al. On dropsonde surface-adjusted winds and their use for the stepped frequency microwave radiometer wind speed calibration[J]. IEEE Transactions on Geoscience and Remote Sensing, 2022, 60: 4208308 [9] WENTZ F J, SMITH D K. A model function for the ocean-normalized radar cross section at 14 GHz derived from NSCAT observations[J]. Journal of Geophysical Research: Oceans, 1999, 104(C5): 11499-11514 doi: 10.1029/98JC02148 [10] RICCIARDULLI L, WENTZ F J. A scatterometer geophysical model function for climate-quality winds: QuikSCAT Ku-2011[J]. Journal of Atmospheric and Oceanic Technology, 2015, 32(10): 1829-1846 doi: 10.1175/JTECH-D-15-0008.1 [11] SOISUVARN S, JELENAK Z, CHANG P S, et al. CMOD5. H— a high wind geophysical model function for C-band vertically polarized satellite scatterometer measurements[J]. IEEE Transactions on Geoscience and Remote Sensing, 2013, 51(6): 3744-3760 doi: 10.1109/TGRS.2012.2219871 [12] GOHIL B S, SIKHAKOLLI R, GANGWAR R K. Development of geophysical model functions for oceansat-2 scatterometer[J]. IEEE Geoscience and Remote Sensing Letters, 2013, 10(2): 377-380 doi: 10.1109/LGRS.2012.2207369 [13] STOFFELEN A, VERSPEEK J A, VOGELZANG J, et al. The CMOD7 geophysical model function for ASCAT and ERS wind retrievals[J]. IEEE Journal of Selected Topics in Applied Earth Observations and Remote Sensing, 2017, 10(5): 2123-2134 doi: 10.1109/JSTARS.2017.2681806 [14] LIU J Q, LIN W M, DONG X L, et al. First results from the rotating fan beam scatterometer onboard CFOSAT[J]. IEEE Transactions on Geoscience and Remote Sensing, 2020, 58(12): 8793-8806 doi: 10.1109/TGRS.2020.2990708 [15] RICCIARDULLI L, MANASTER A. Intercalibration of ASCAT scatterometer winds from MetOp-A, -B, and -C, for a stable climate data record[J]. Remote Sensing, 2021, 13(18): 3678 doi: 10.3390/rs13183678 [16] WANG Z X, ZOU J H, ZHANG Y G, et al. Intercalibration of backscatter measurements among Ku-band Scatterometers onboard the Chinese HY-2 satellite constellation[J]. Remote Sensing, 2021, 13(23): 4783 doi: 10.3390/rs13234783 [17] 王志雄, 邹巨洪, 林明森, 等. HY-2卫星微波散射计海面风场地球物理模式函数研究[J]. 遥感学报, 2023, 27(4): 871-880WANG Zhixiong, ZOU Juhong, LIN Mingsen, et al. Development of a geophysical model function for HY-2 satellite microwave scatterometer wind retrievals[J]. National Remote Sensing Bulletin, 2023, 27(4): 871-880 [18] MEISSNER T, RICCIARDULLI L, MANASTER A. Tropical cyclone wind speeds from WindSat, AMSR and SMAP: algorithm development and testing[J]. Remote Sensing, 2021, 13(9): 1641 doi: 10.3390/rs13091641 [19] SCHRECK III C J, KNAPP K R, KOSSIN J P. The impact of best track discrepancies on global tropical cyclone climatologies using IBTrACS[J]. Monthly Weather Review, 2014, 142(10): 3881-3899 doi: 10.1175/MWR-D-14-00021.1 [20] POLVERARI F, PORTABELLA M, LIN W M, et al. On high and extreme wind calibration using ASCAT[J]. IEEE Transactions on Geoscience and Remote Sensing, 2022, 60: 4202210 -
-


 下载:
下载:
