


Forest Canopy Height Mapping Based on Multi-source Remote Sensing Data
-
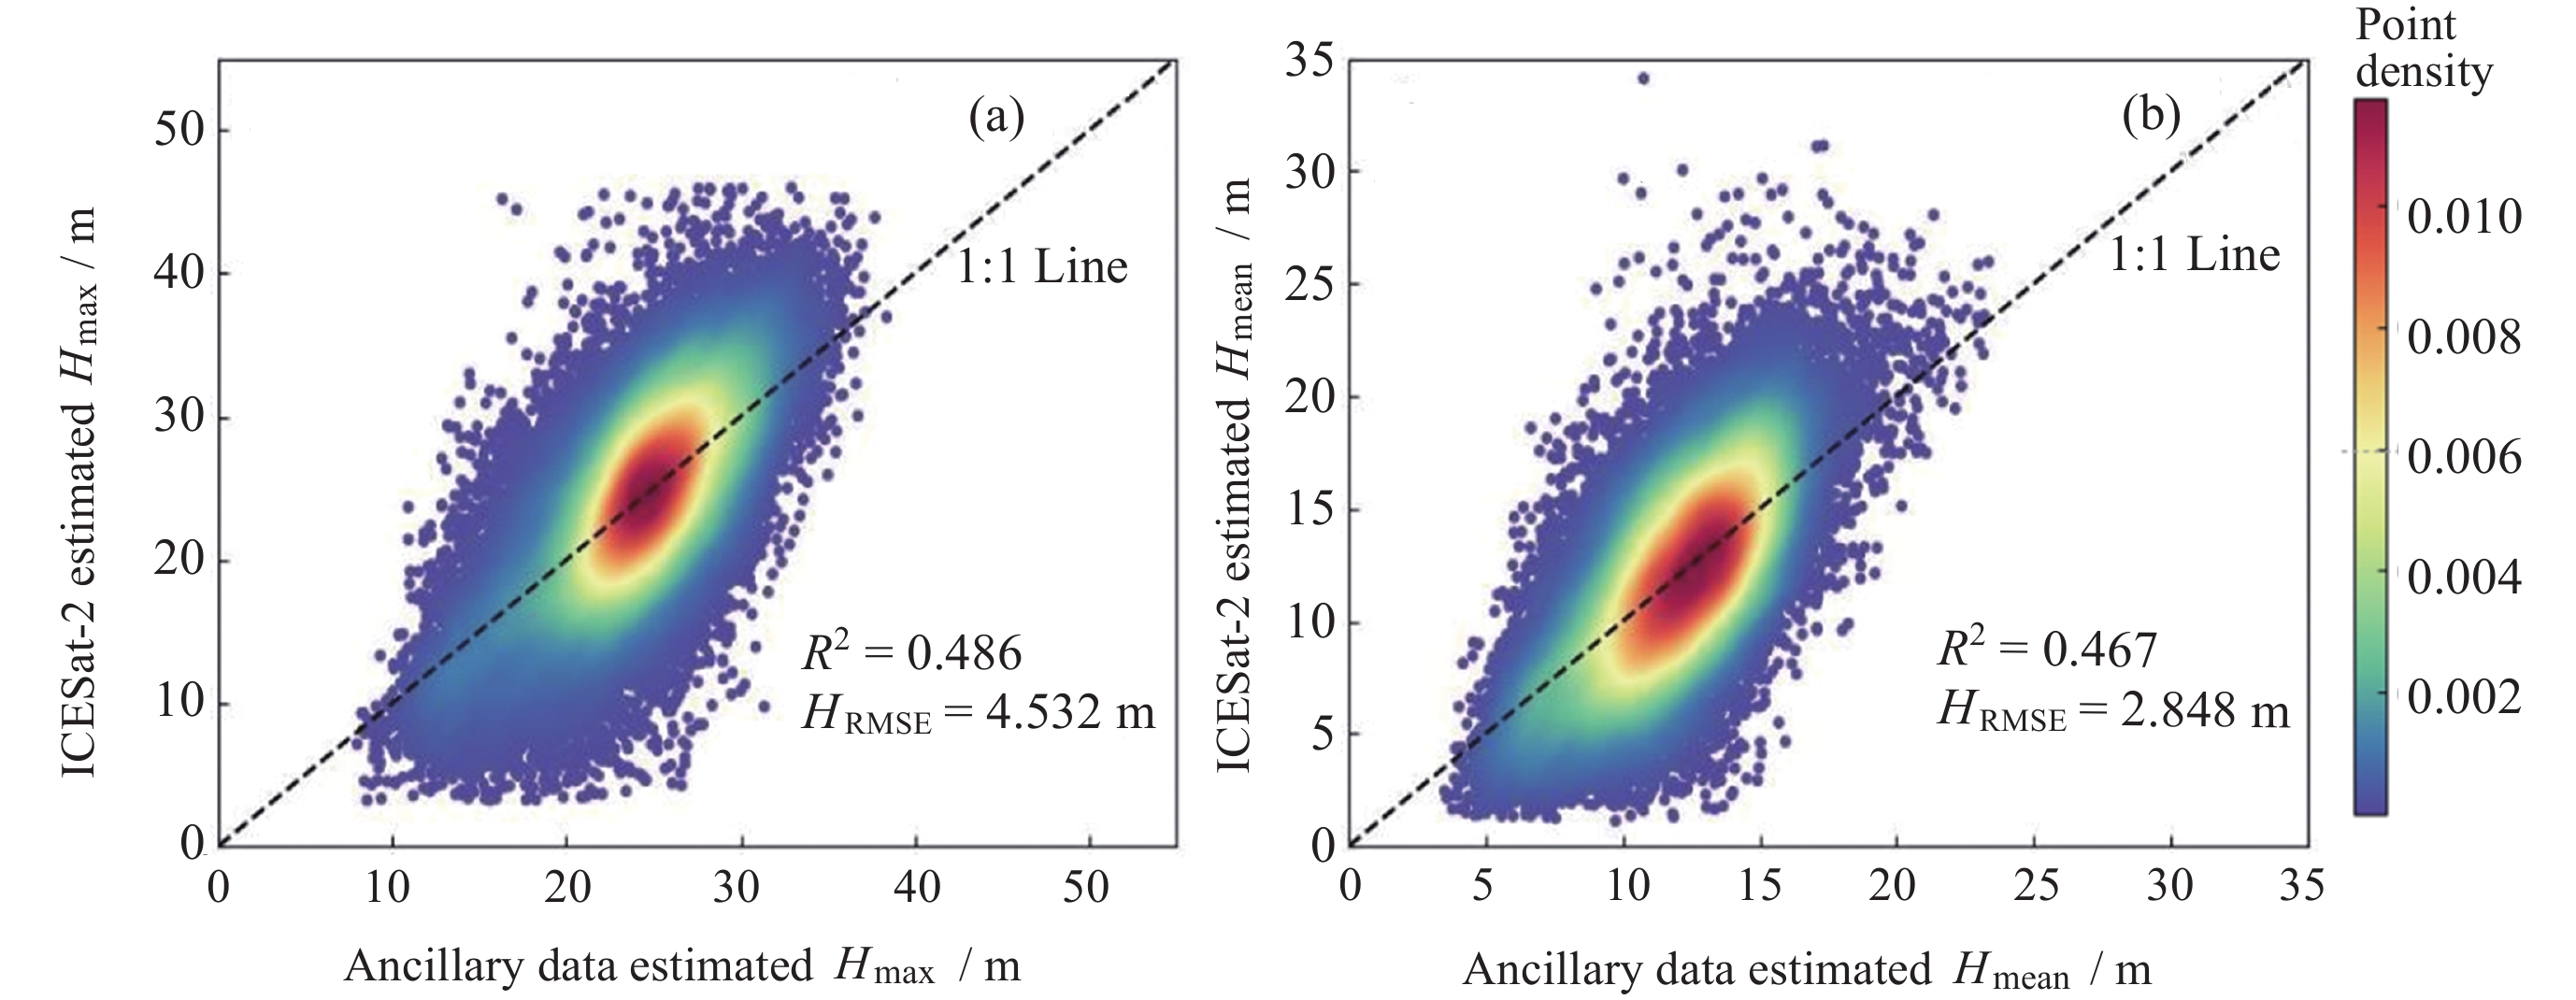
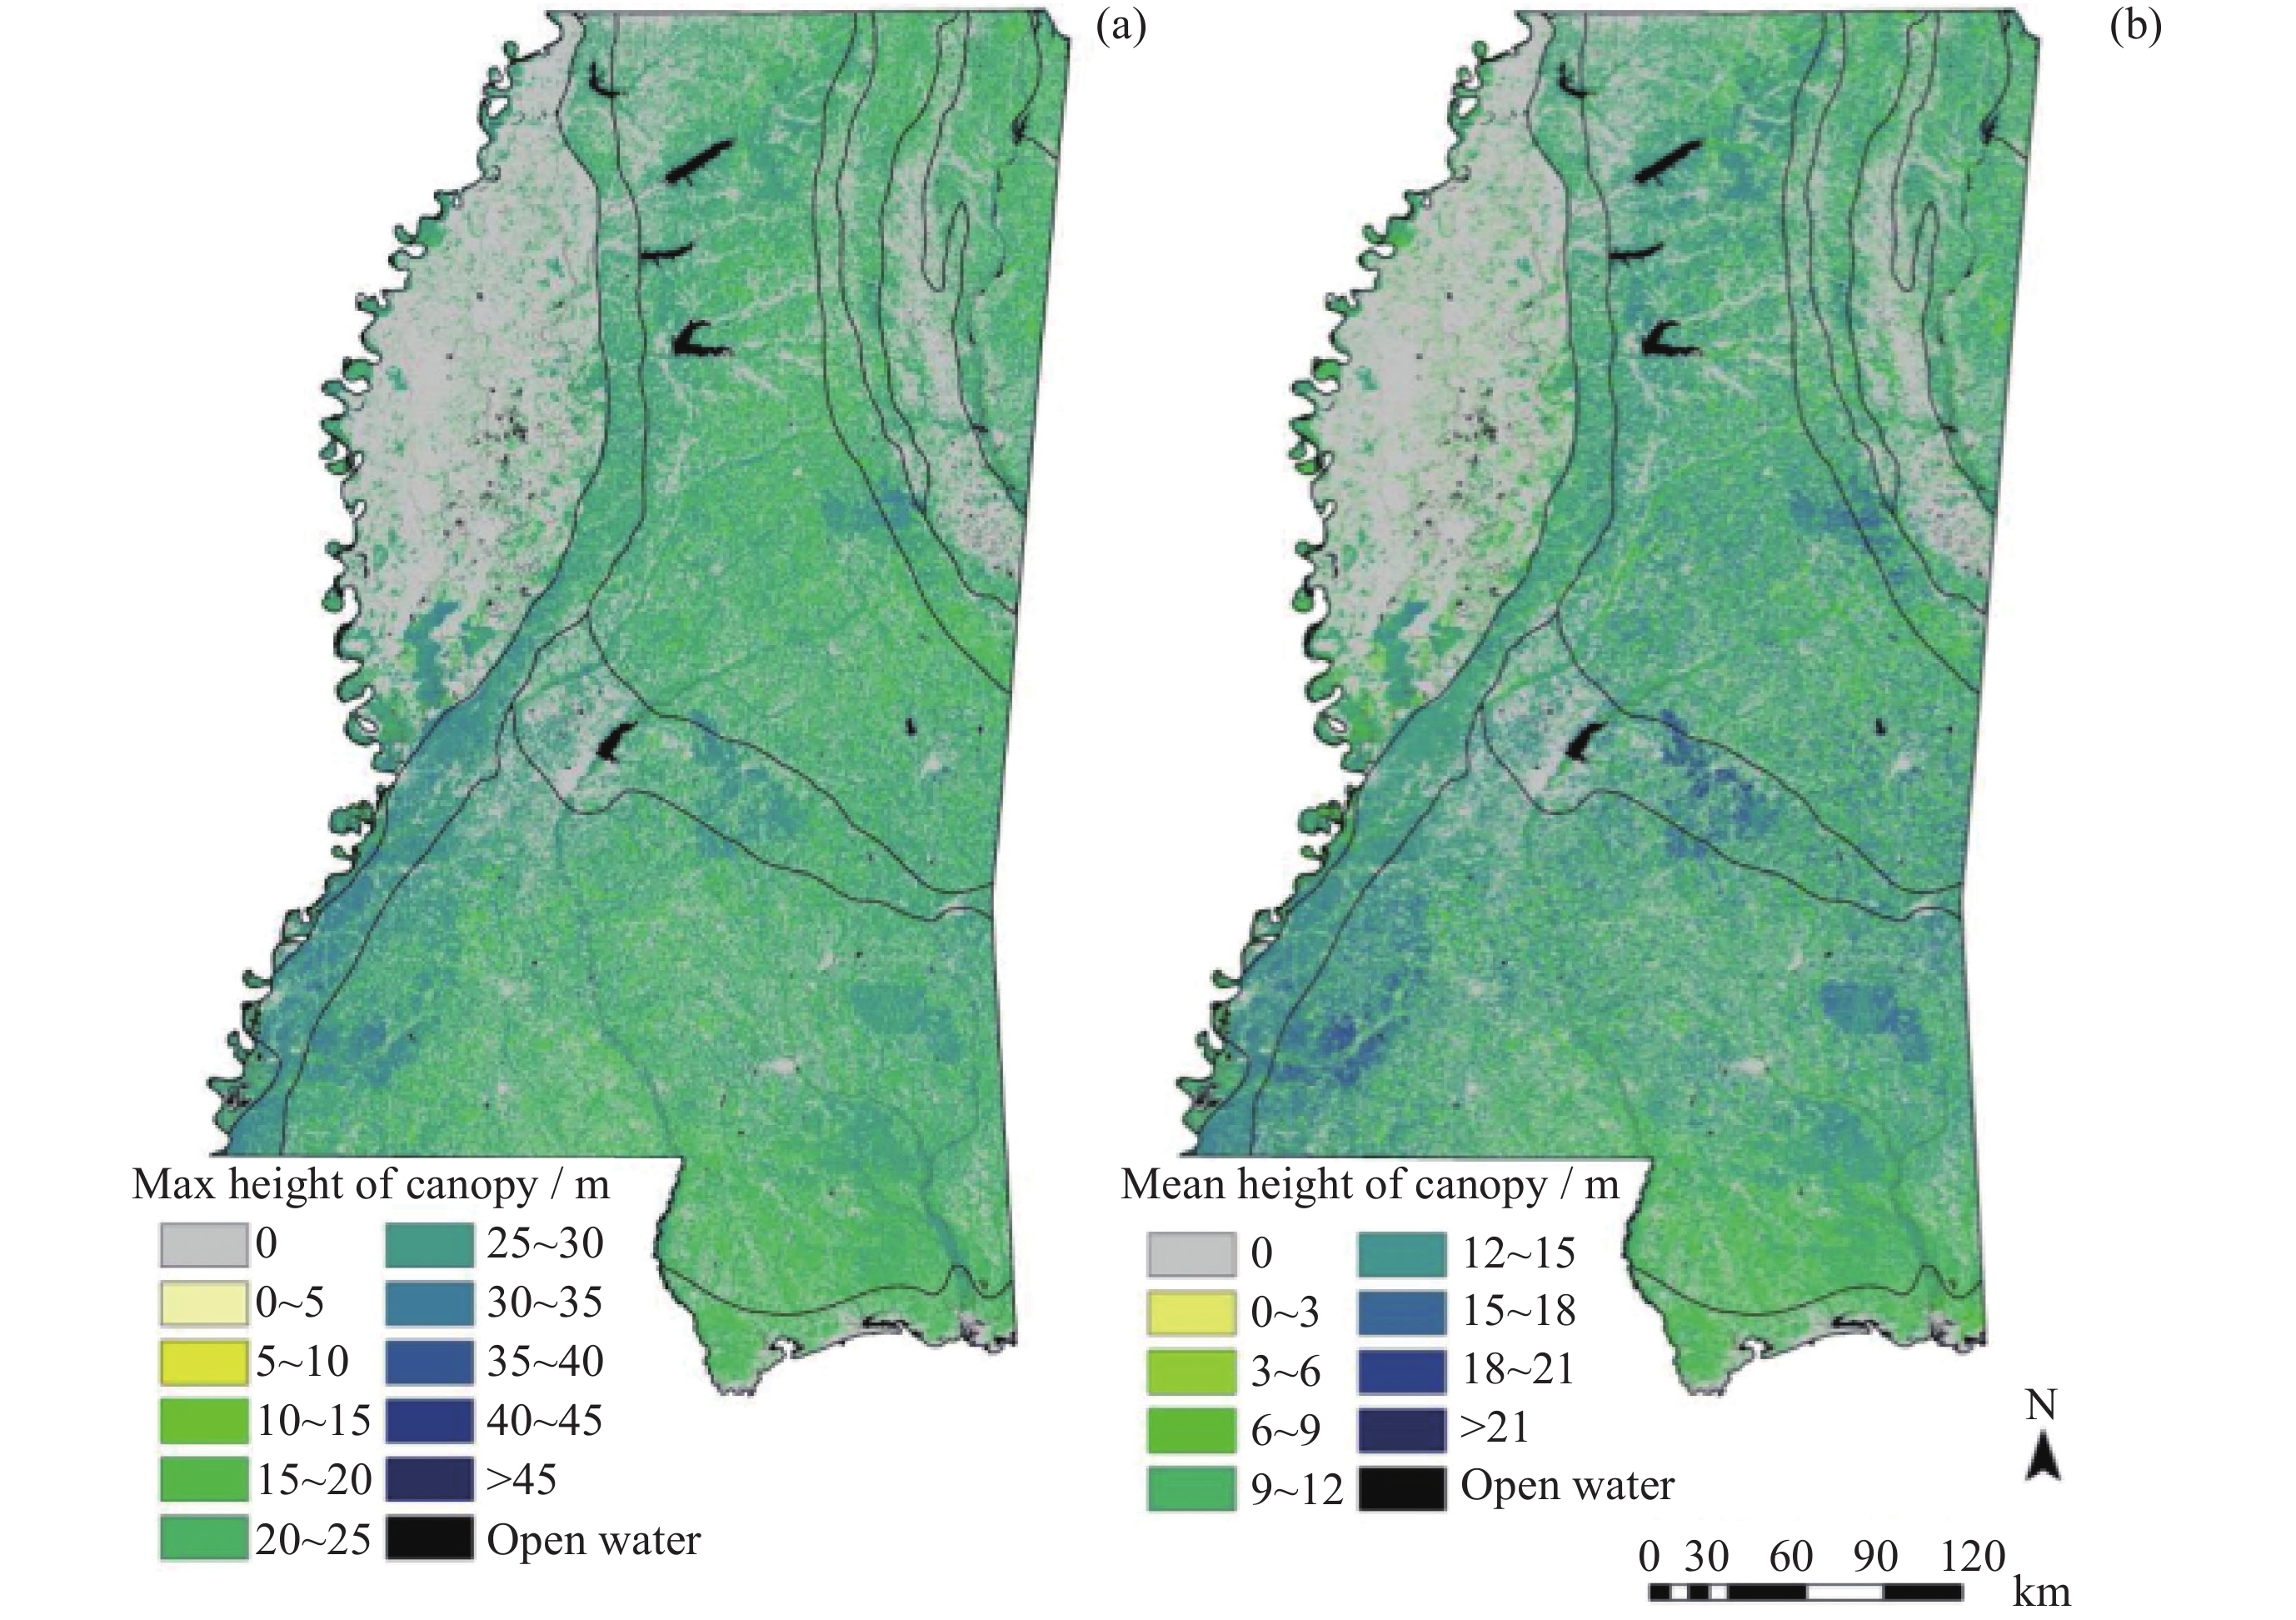
摘要: 为了大范围精确估计空间连续的森林冠层高度,研究使用随机森林回归方法,通过融合冰、云和陆地高程卫星二号 (Ice, Cloud and land Elevation Satellite-2, ICESat-2)测量数据和Landsat-8影像,并结合地形、气温等数据来估算森林冠层高度,生成2020年美国密西西比州30 m空间分辨率的森林冠层最大高度和平均高度图。结果表明,森林覆盖区域冠层最大高度的均值为24.14 m,标准差为4.24 m。森林覆盖区域冠层平均高度的均值为12.04 m,标准差为2.59 m。研究区冠层高度估计值与机载测量值吻合良好(冠层最大高度R2 = 0.486,$ {H}_{\mathrm{R}\mathrm{M}\mathrm{S}\mathrm{E}} $ = 4.532 m;冠层平均高度R2 = 0.467,$ {H}_{\mathrm{R}\mathrm{M}\mathrm{S}\mathrm{E}} $ = 2.848 m)。利用估算数据进一步对森林冠层垂直结构复杂度进行了分析。研究提出的森林冠层高度制图方案对中国长江三角洲地区的森林管理、物种多样性保护与碳中和评估等具有指导意义。Abstract: Accurate estimation of spatially continuous forest canopy height is crucial for quantifying forest carbon stocks, understanding forest ecosystems, and making forest management and restoration policies. Spaceborne Light Detection and Ranging (LiDAR) can measure forest canopy height over laser footprints at semi-global the coverage, which provides a promising data source for estimating forest canopy height at national to global scales. This study used the random forest regression method to map forest canopy height by fusing Ice, Cloud and land Elevation Satellite-2 (ICESat-2) Advanced Topographic Laser Altimeter System (ATLAS) measurements and Landsat-8 images, combined with terrain and climatic features, and other data to generate forest canopy height products of the maximum (Hmax) and mean height (Hmean) values at 30 meter resolution across Mississippi State of America in 2020. The results show that the mean and standard deviation of Hmax in forest area is 24.14 m and 4.24 m respectively. For the Hmean, the mean and standard deviation of Hmean in forest area were 12.04 m and 2.59 m respectively. The estimated Hmax and Hmean across Mississippi agree well with airborne measurements (Hmax: $ {R}^{2} $ = 0.486, $ {H}_{\mathrm{R}\mathrm{M}\mathrm{S}\mathrm{E}} $ = 4.532 m; Hmean: $ {R}^{2} $ = 0.467, $ {H}_{\mathrm{R}\mathrm{M}\mathrm{S}\mathrm{E}} $ = 2.848 m). In this study, the difference and ratio of the maximum and average values of canopy height were used to reflect the vertical structure complexity of the forest canopy. The differences of different geographical divisions, forest types, planted forests and natural forests were compared, and it was found that the complexity of loess hilly areas, deciduous forests, wetland forests and natural forests in the study area was higher. In addition, the canopy height mapping scheme proposed in this study for non-mountain plantations is of guiding significance for forest management, species diversity conservation and “carbon neutrality” assessment in the in the Yangtze River Delta and other areas dominated by non-mountain planted forest of China.
-
Key words:
- LiDAR /
- ICESat-2 /
- Canopy height mapping /
- Multi-source remote sensing /
- Mississippi forest
-

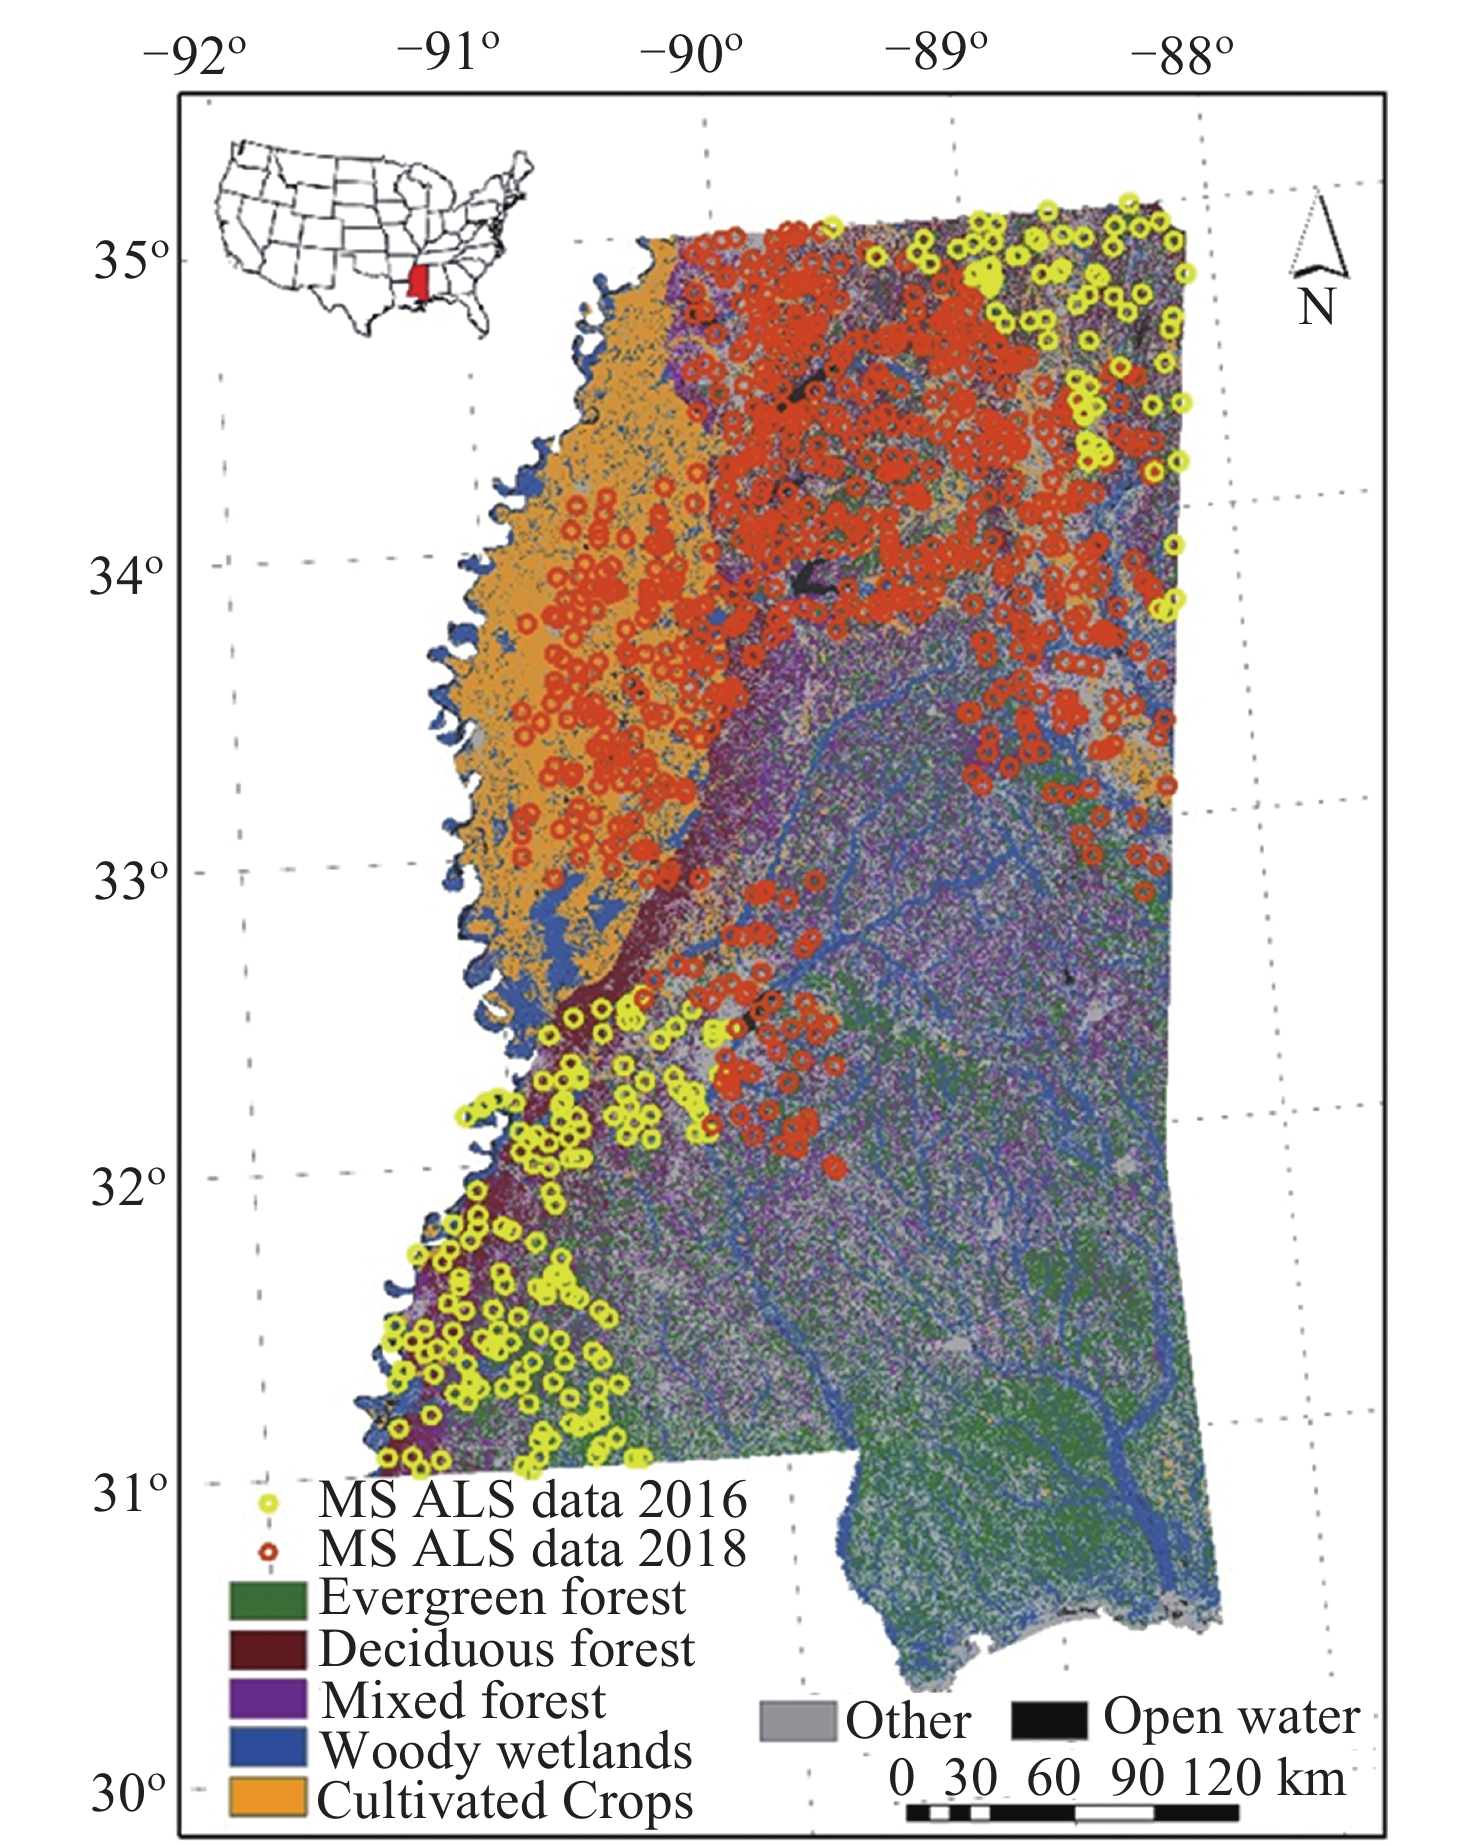
图 1 密西西比州土地覆盖类型与机载激光雷达数据(ALS)样地分布(2016-2018年)
Figure 1. Land cover types and airborne LiDAR sample plot distribution in Mississippi (2016-2018)
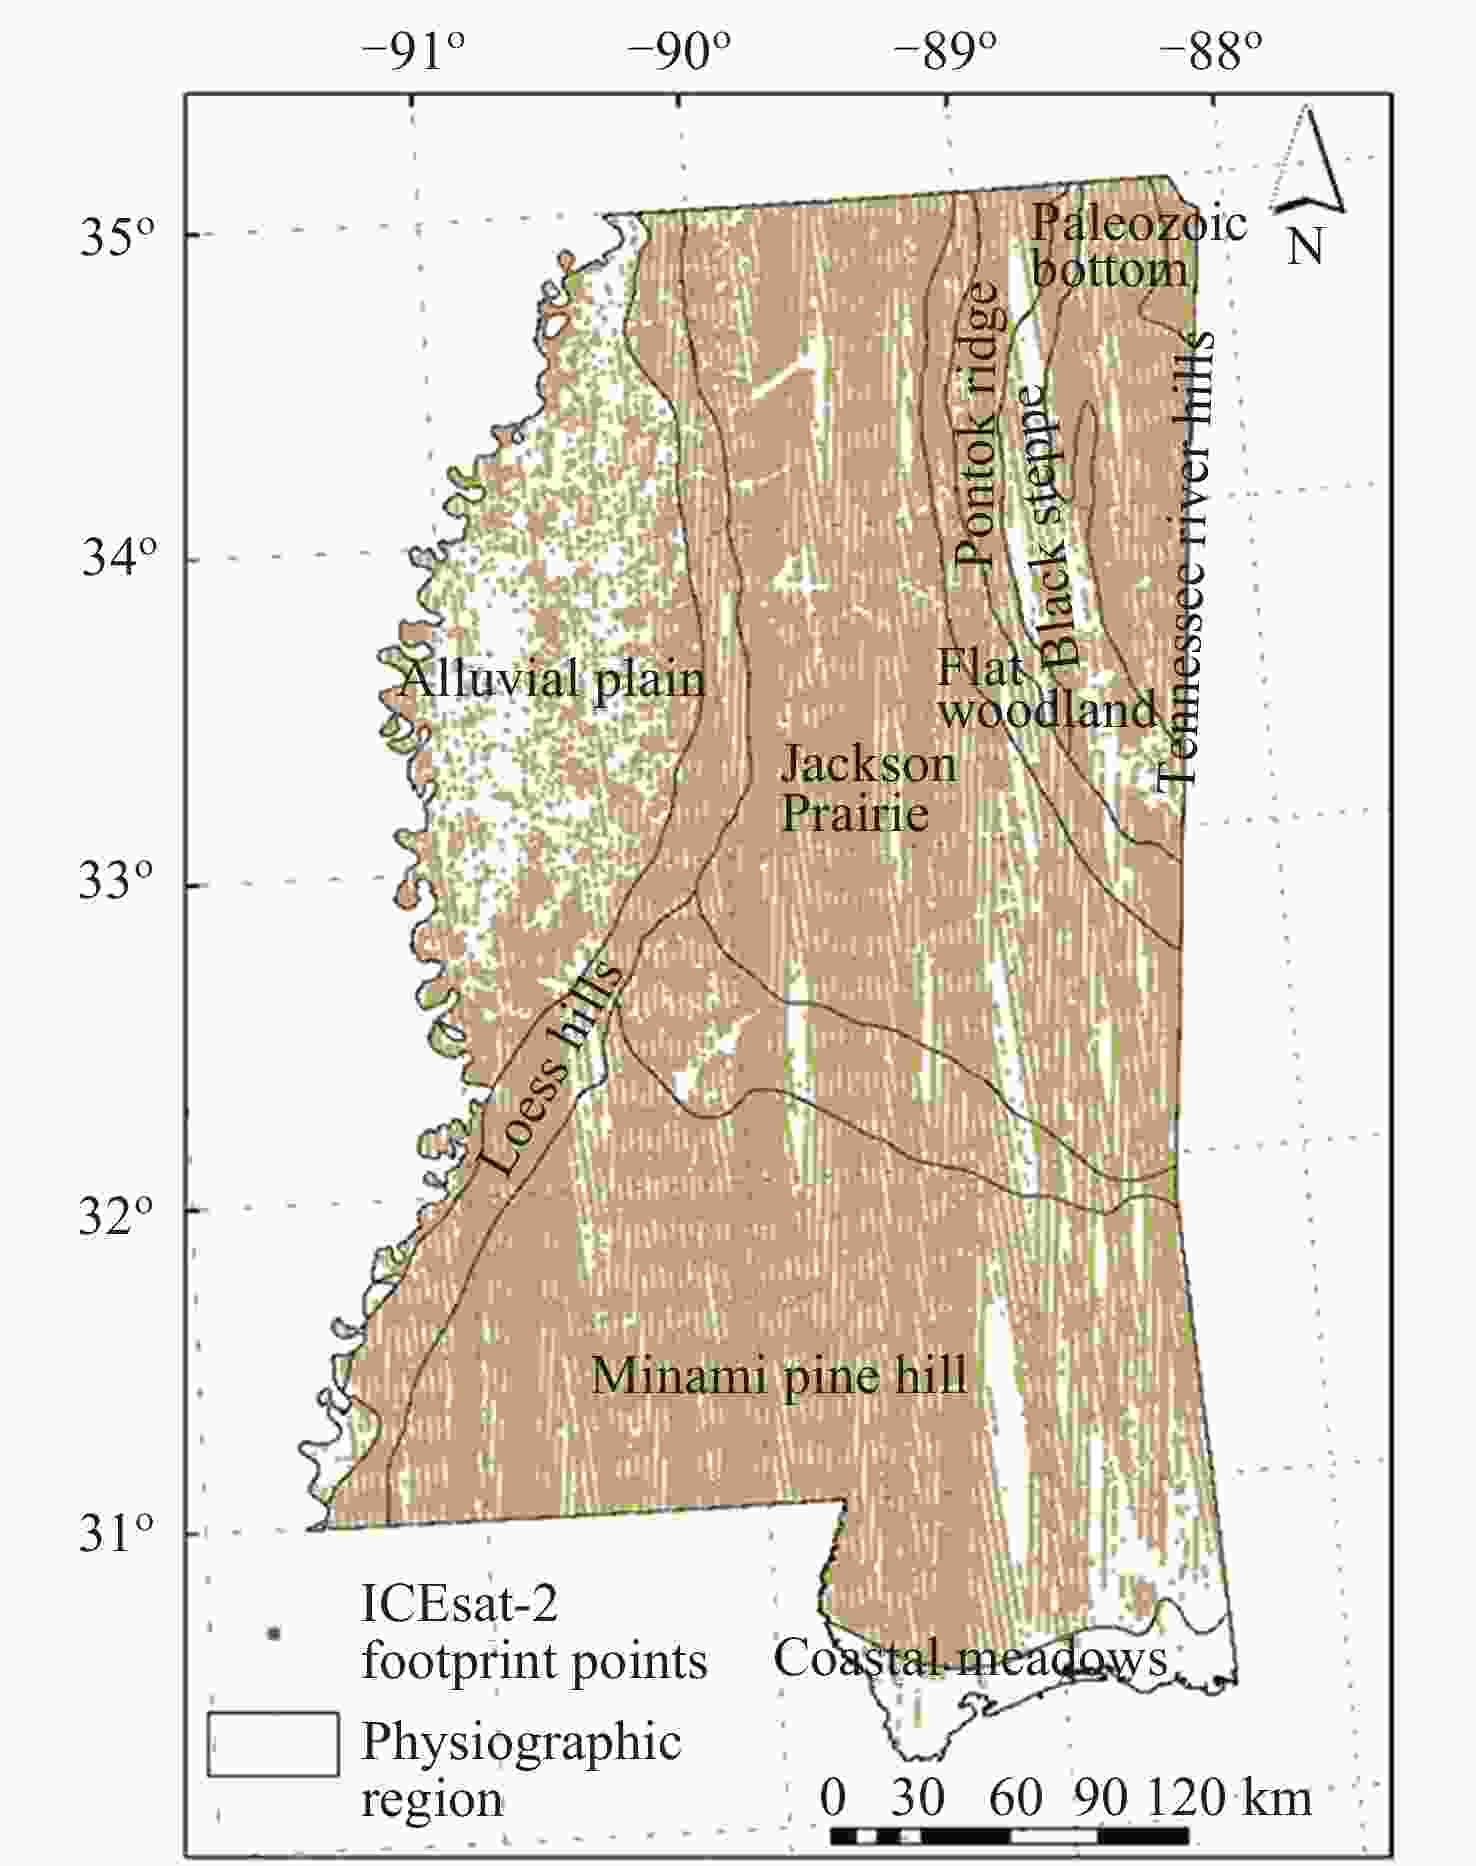
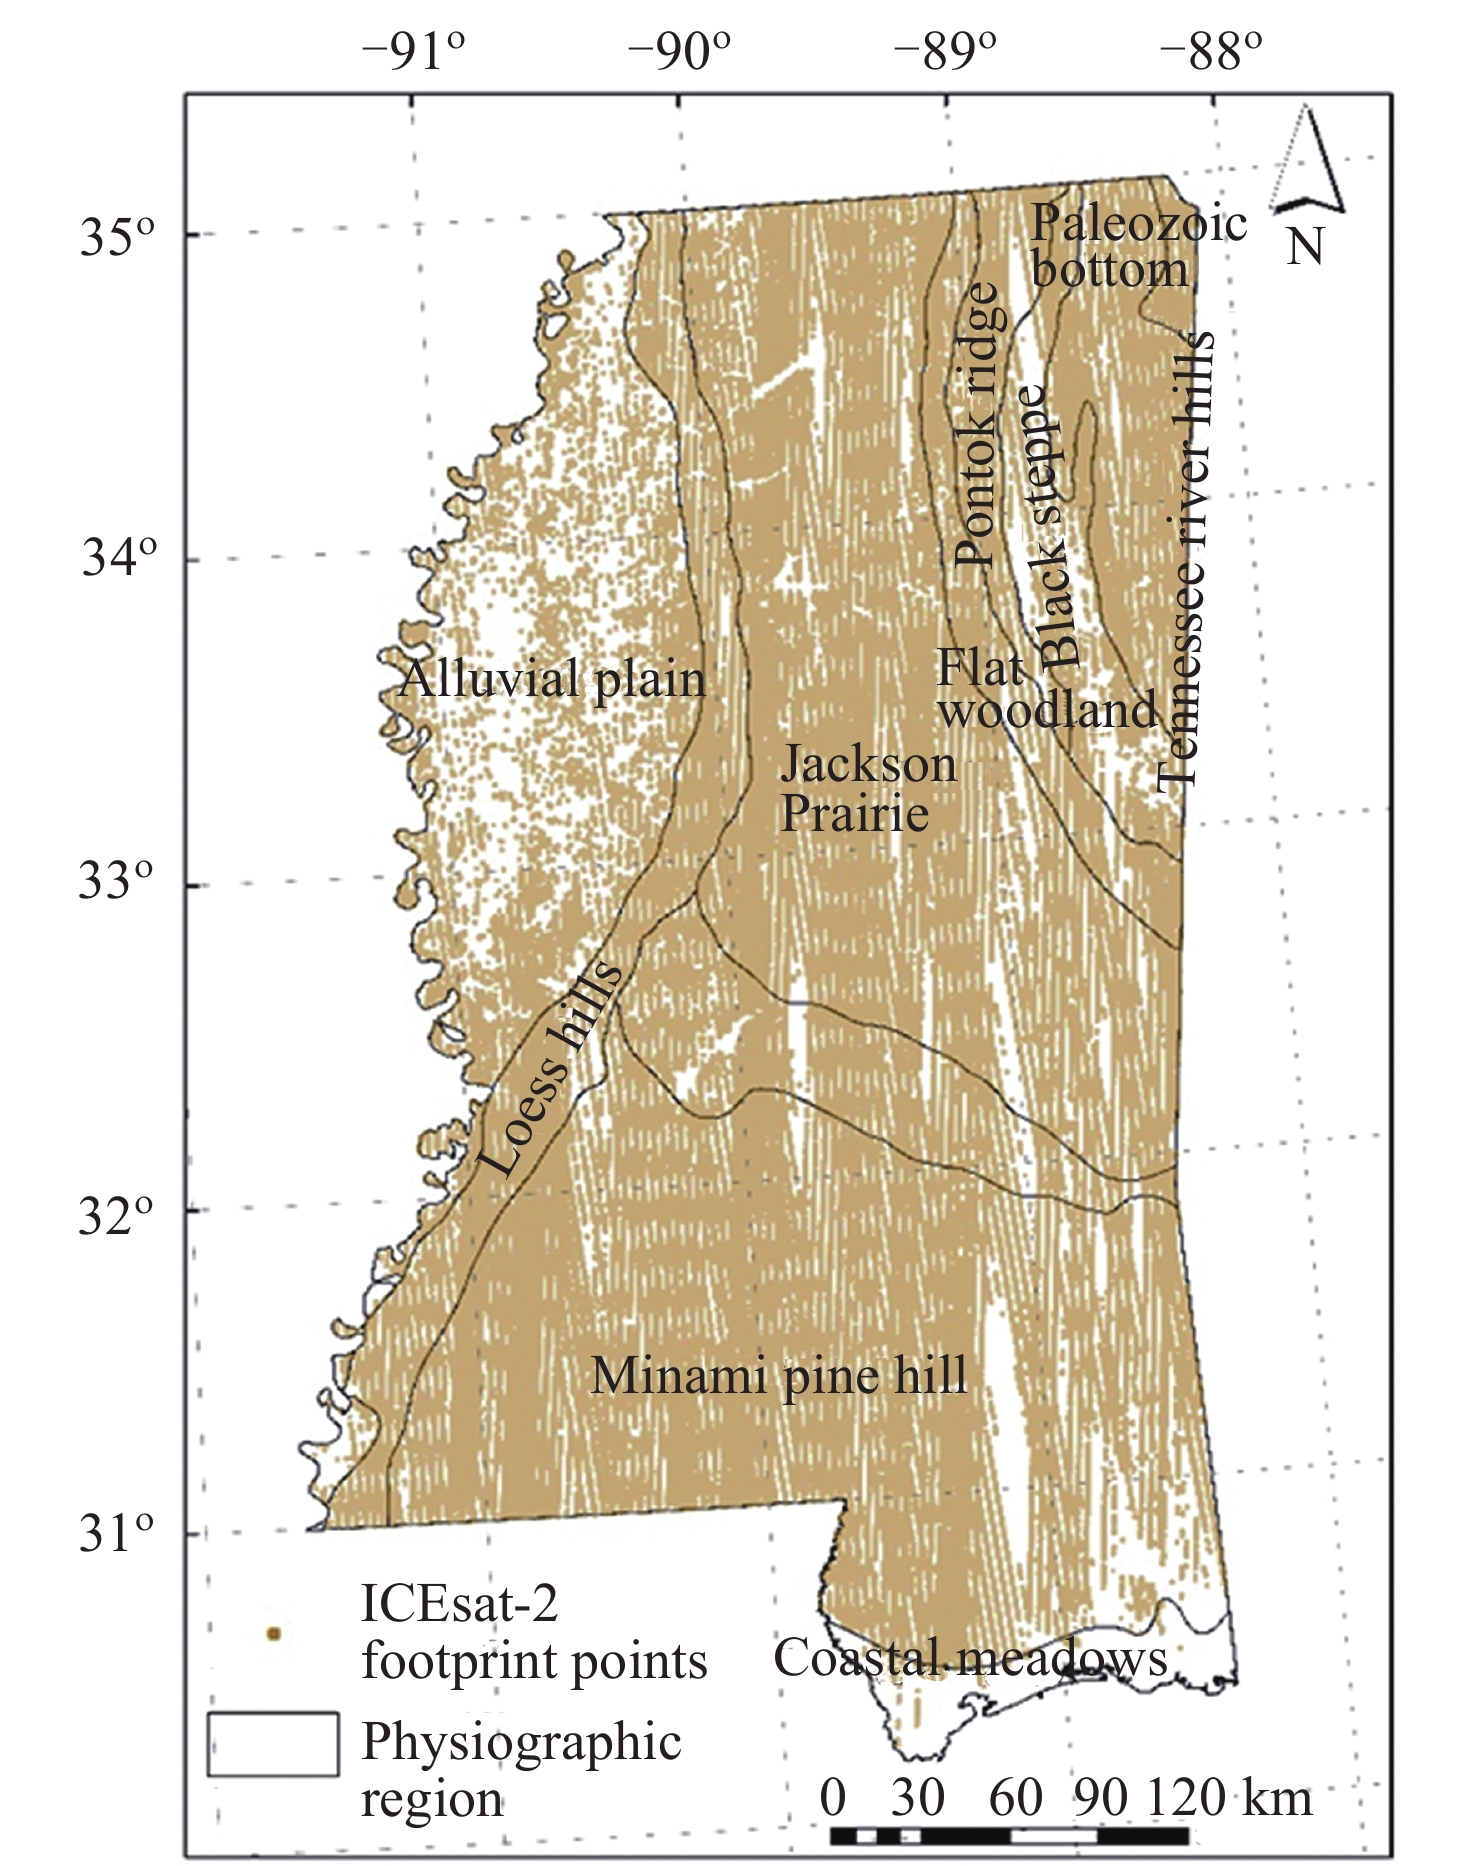
图 2 密西西比州地理区域和ICESat-2星载激光雷达数据足迹点分布(2018-2022)
Figure 2. Geographical division and ICESat-2 sample (2018-2022) distribution in Mississippi
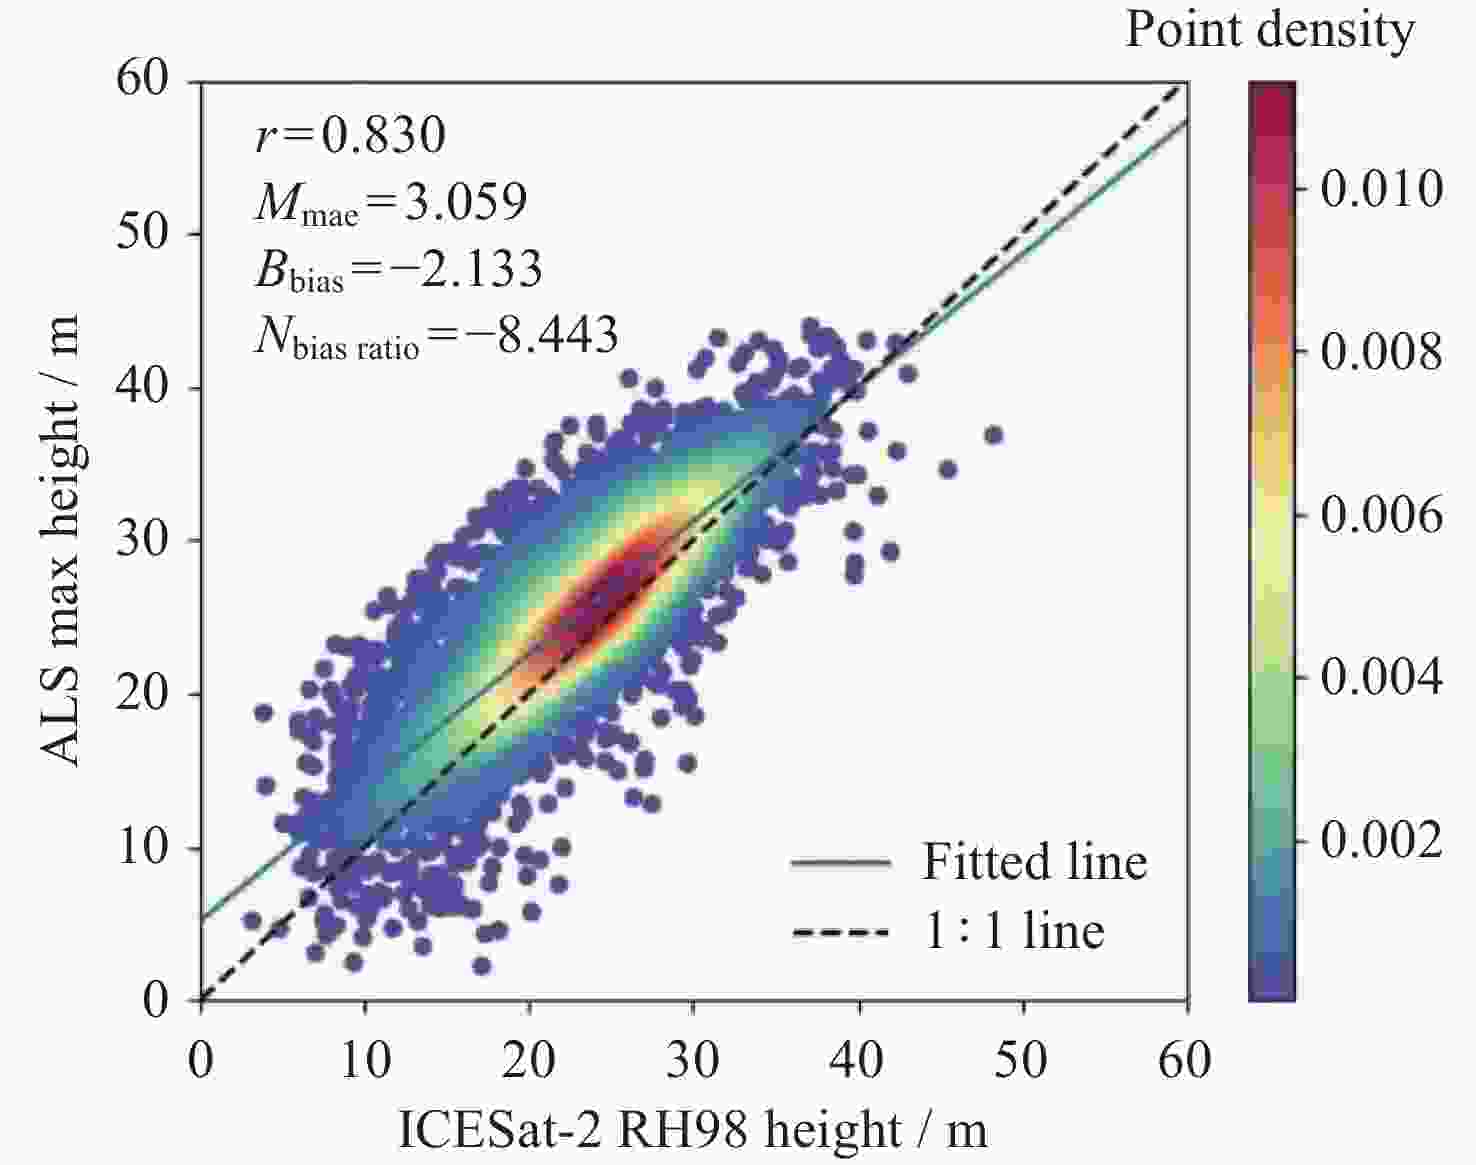
图 5 机载与星载高度参数的一致
Figure 5. Consistency between airborne and spaceborne altitude parameters
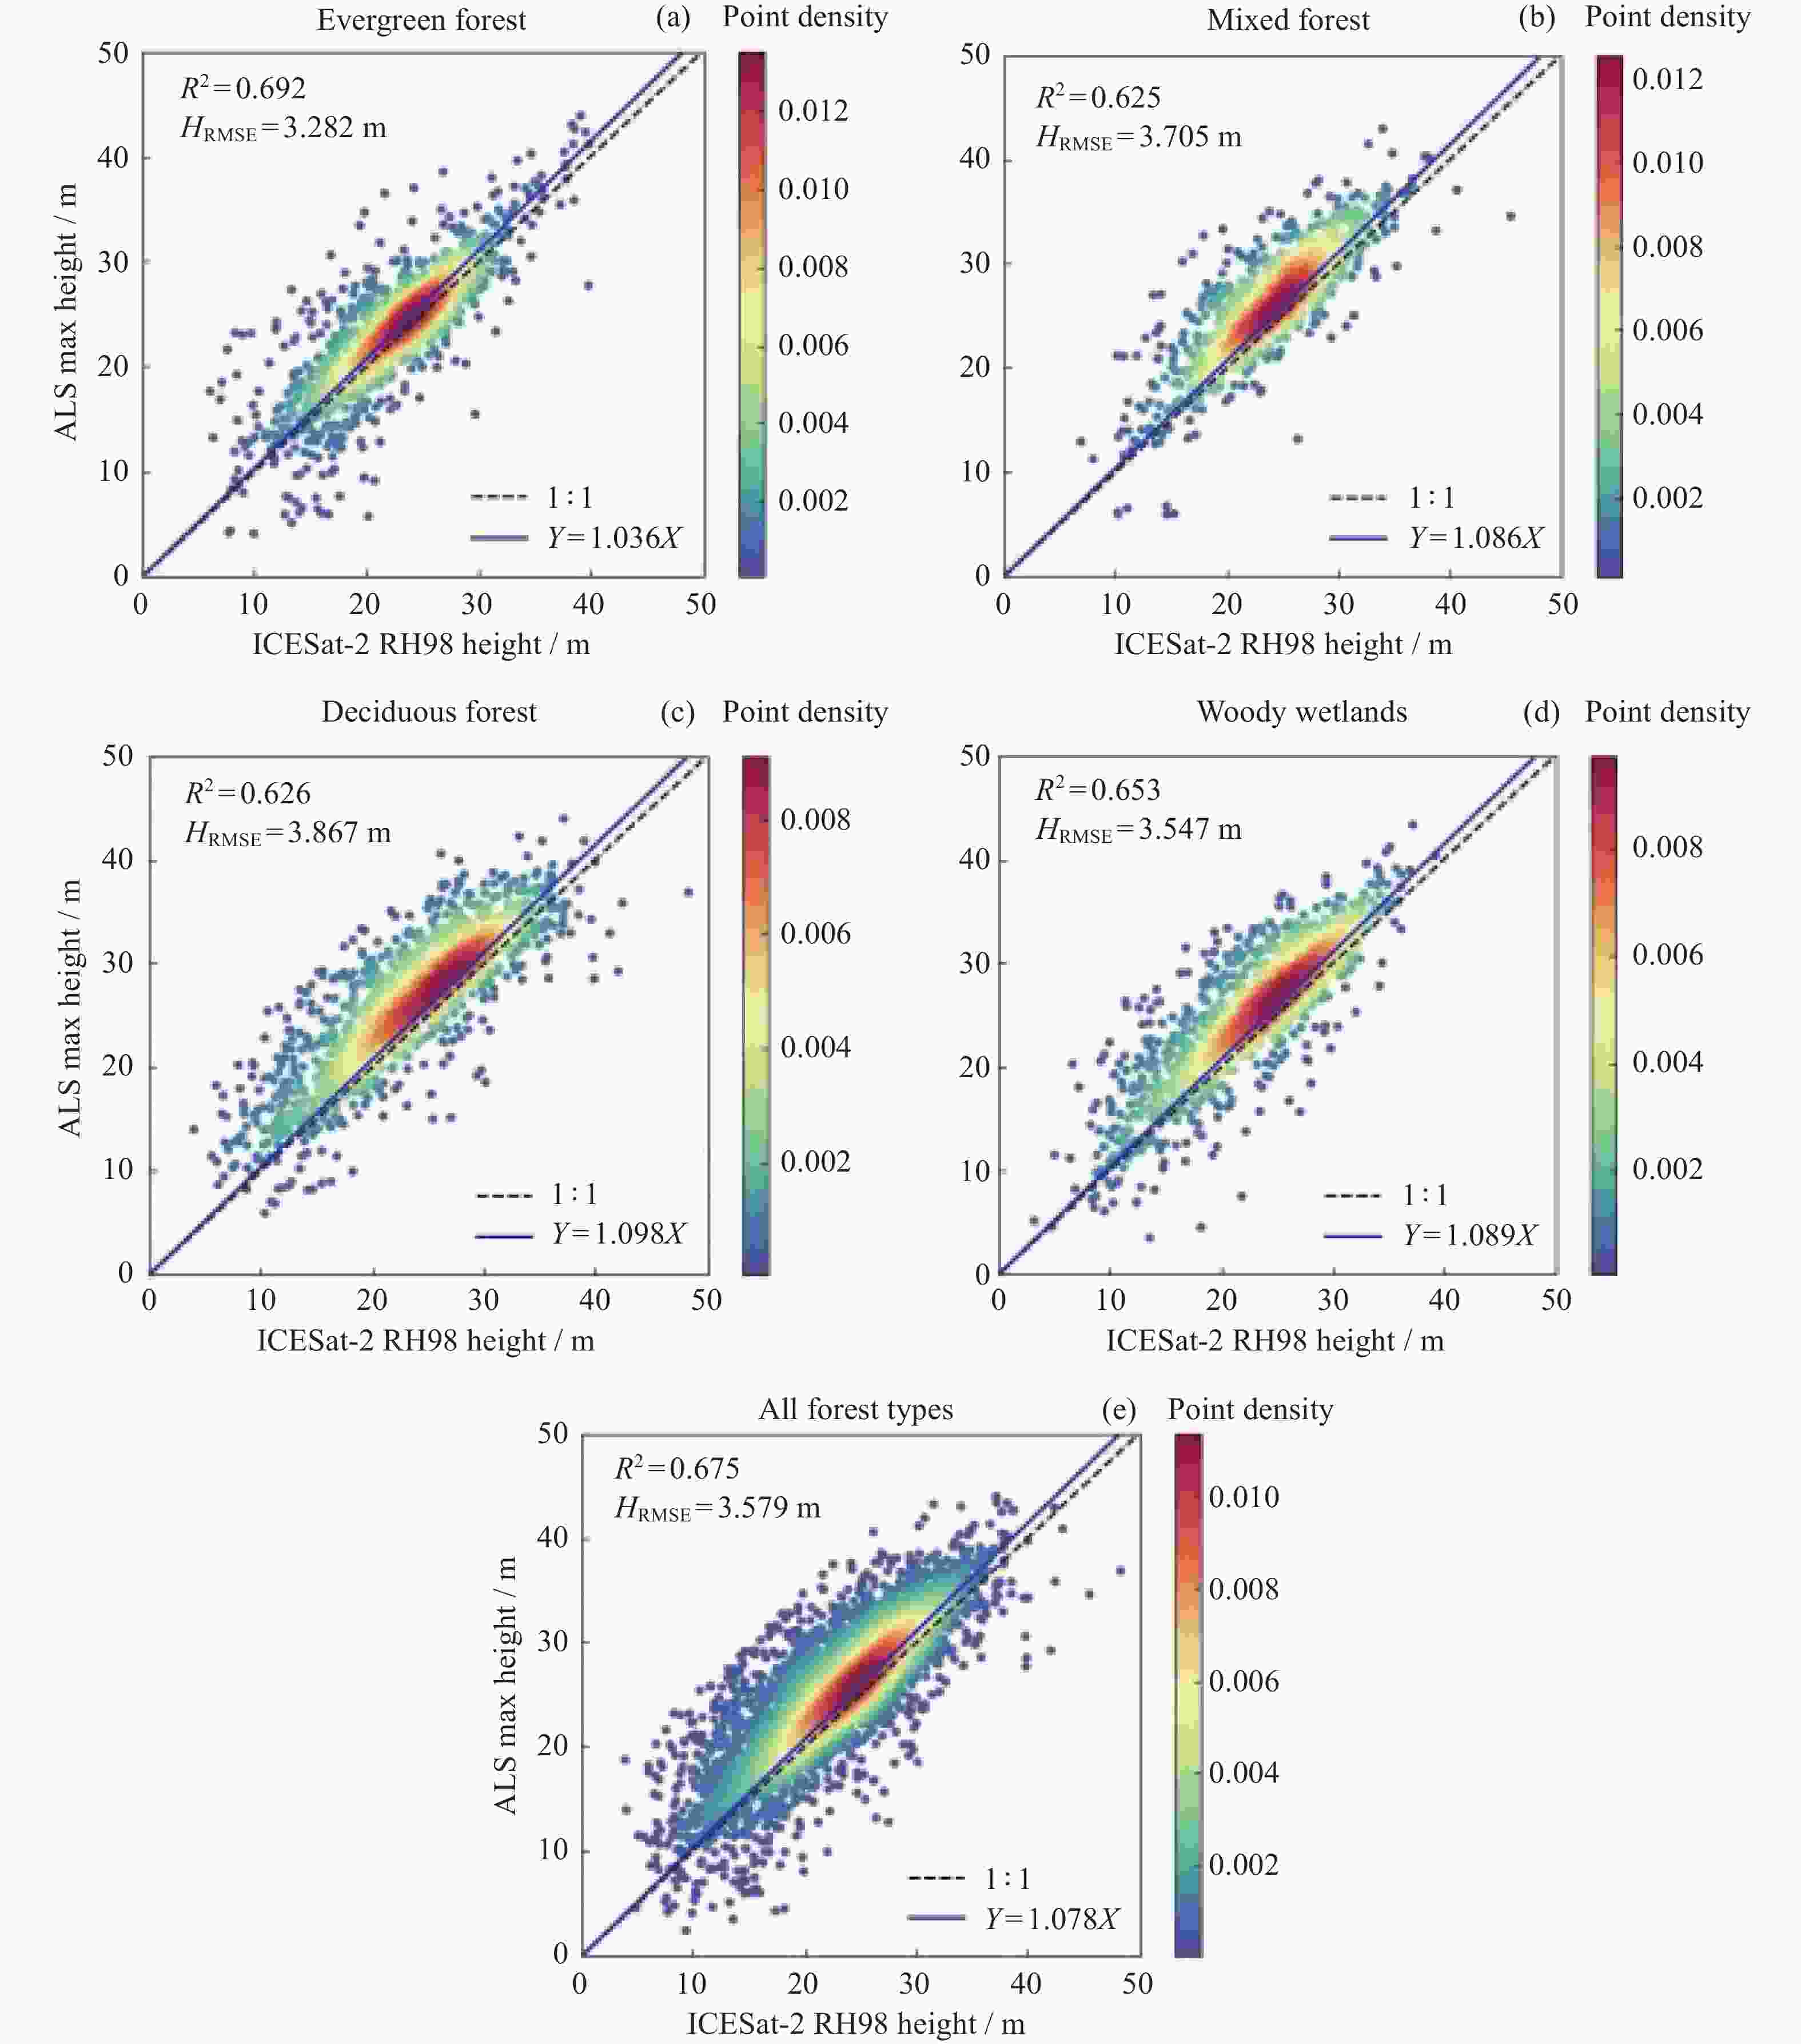
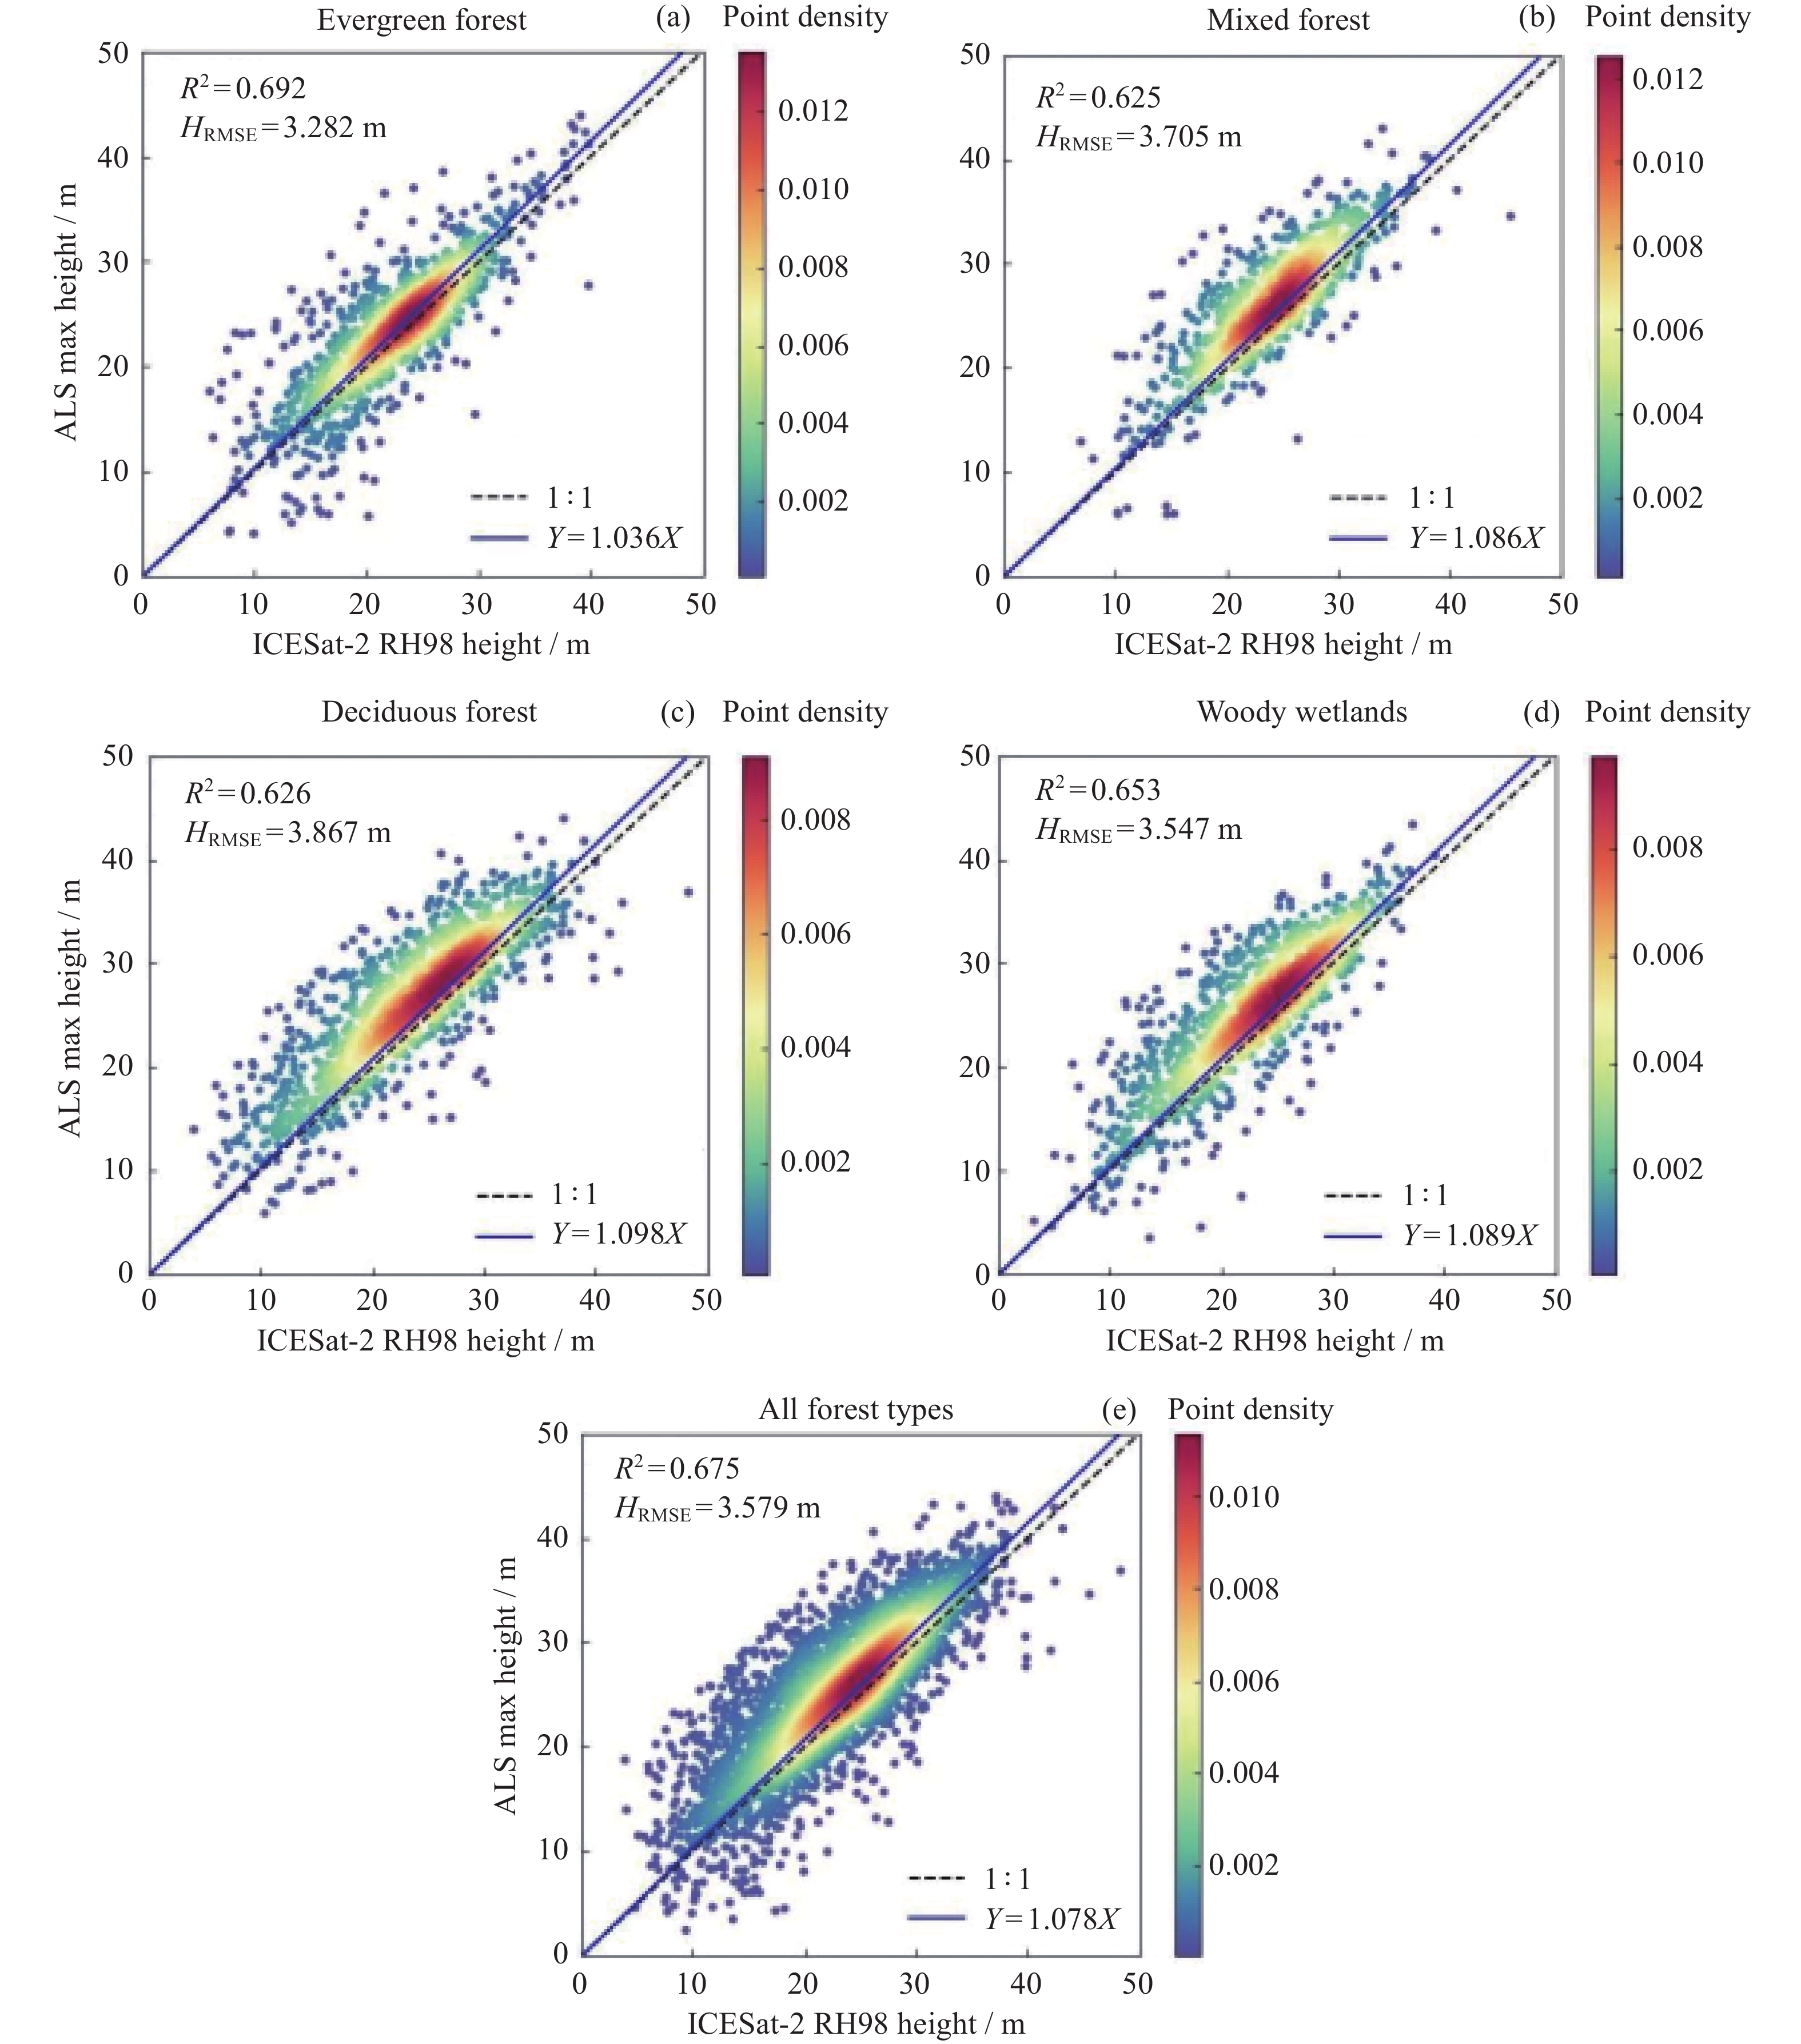
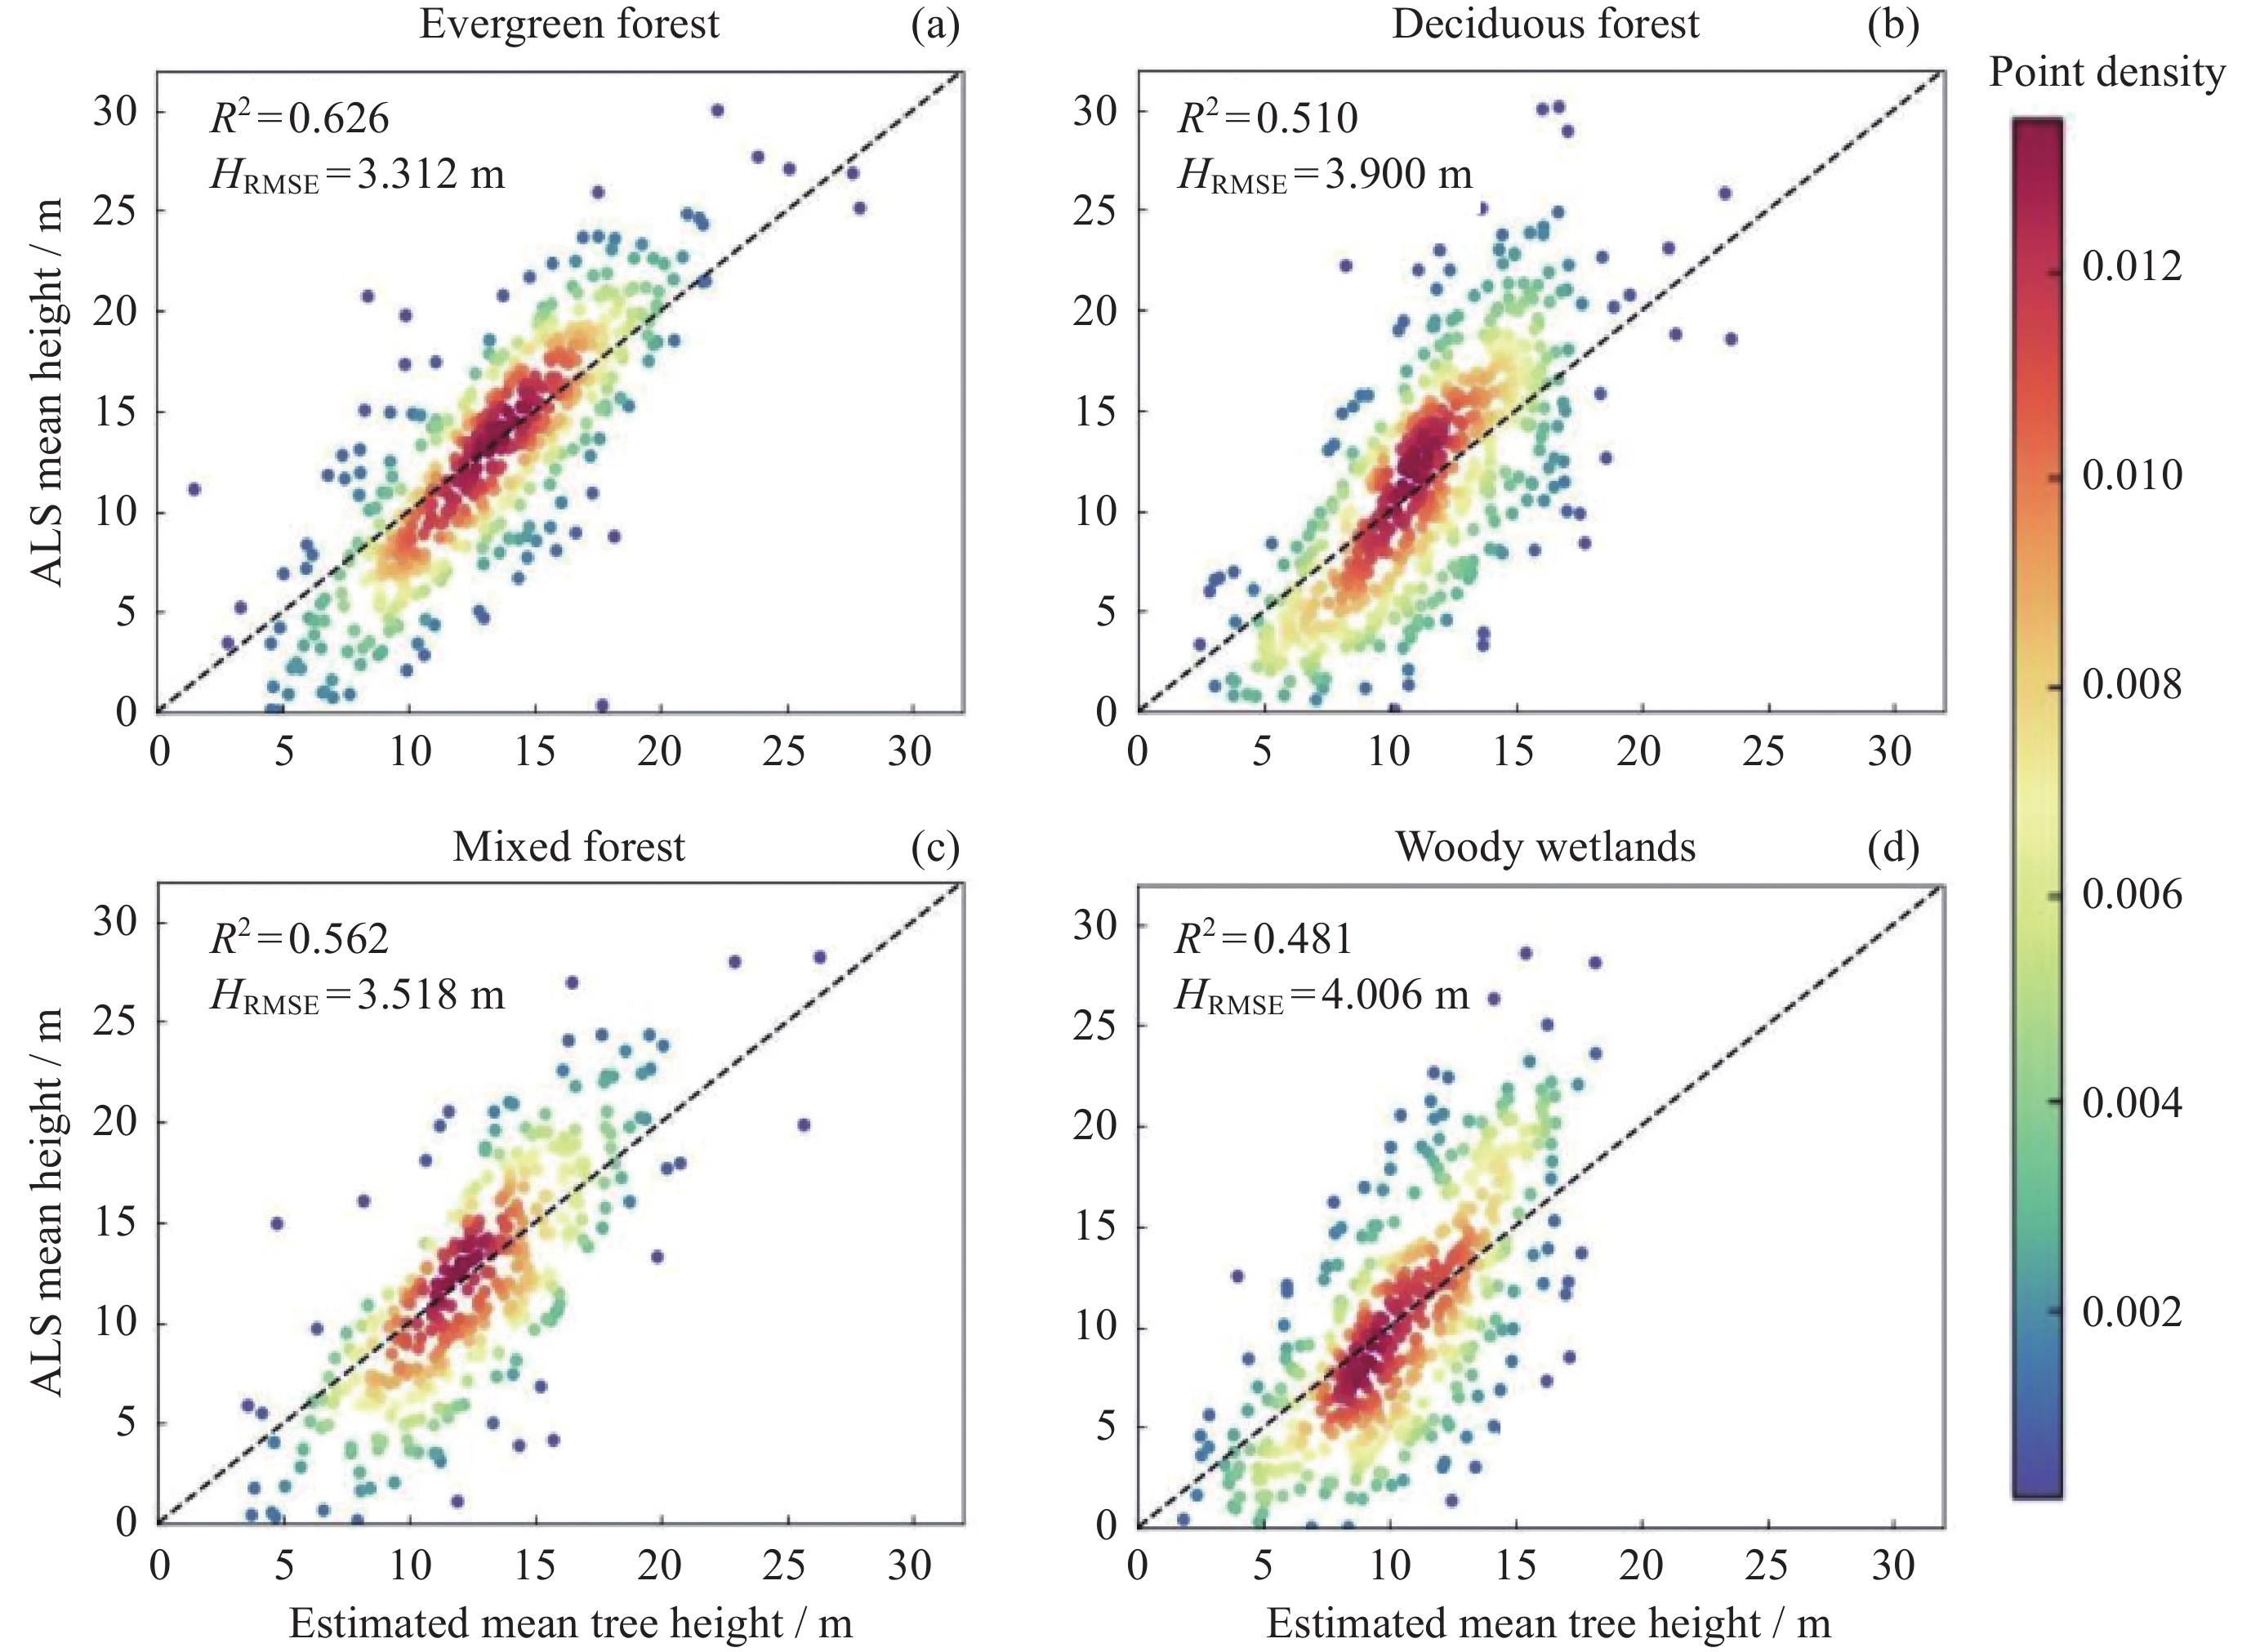
图 6 ICESat-2 不同森林类型冠层最大高度建模散点图和拟合线
Figure 6. ICESat-2 Scatterplot and fitted line of maximum canopy height modeling for different forest types
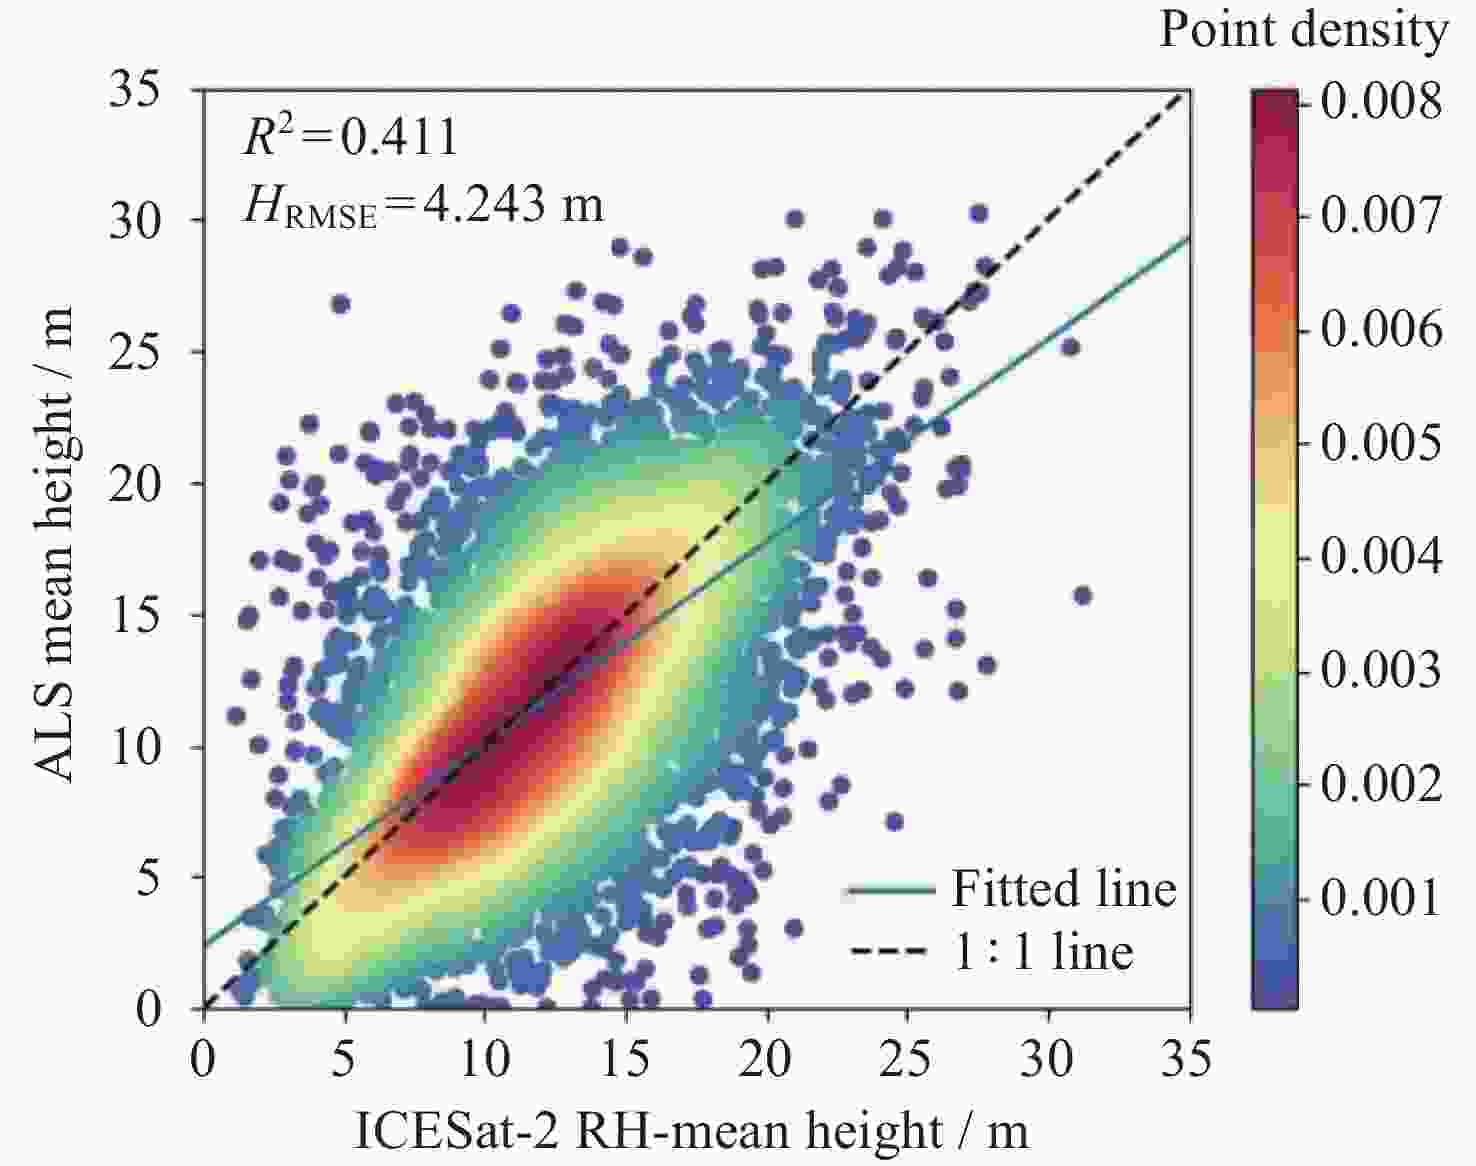
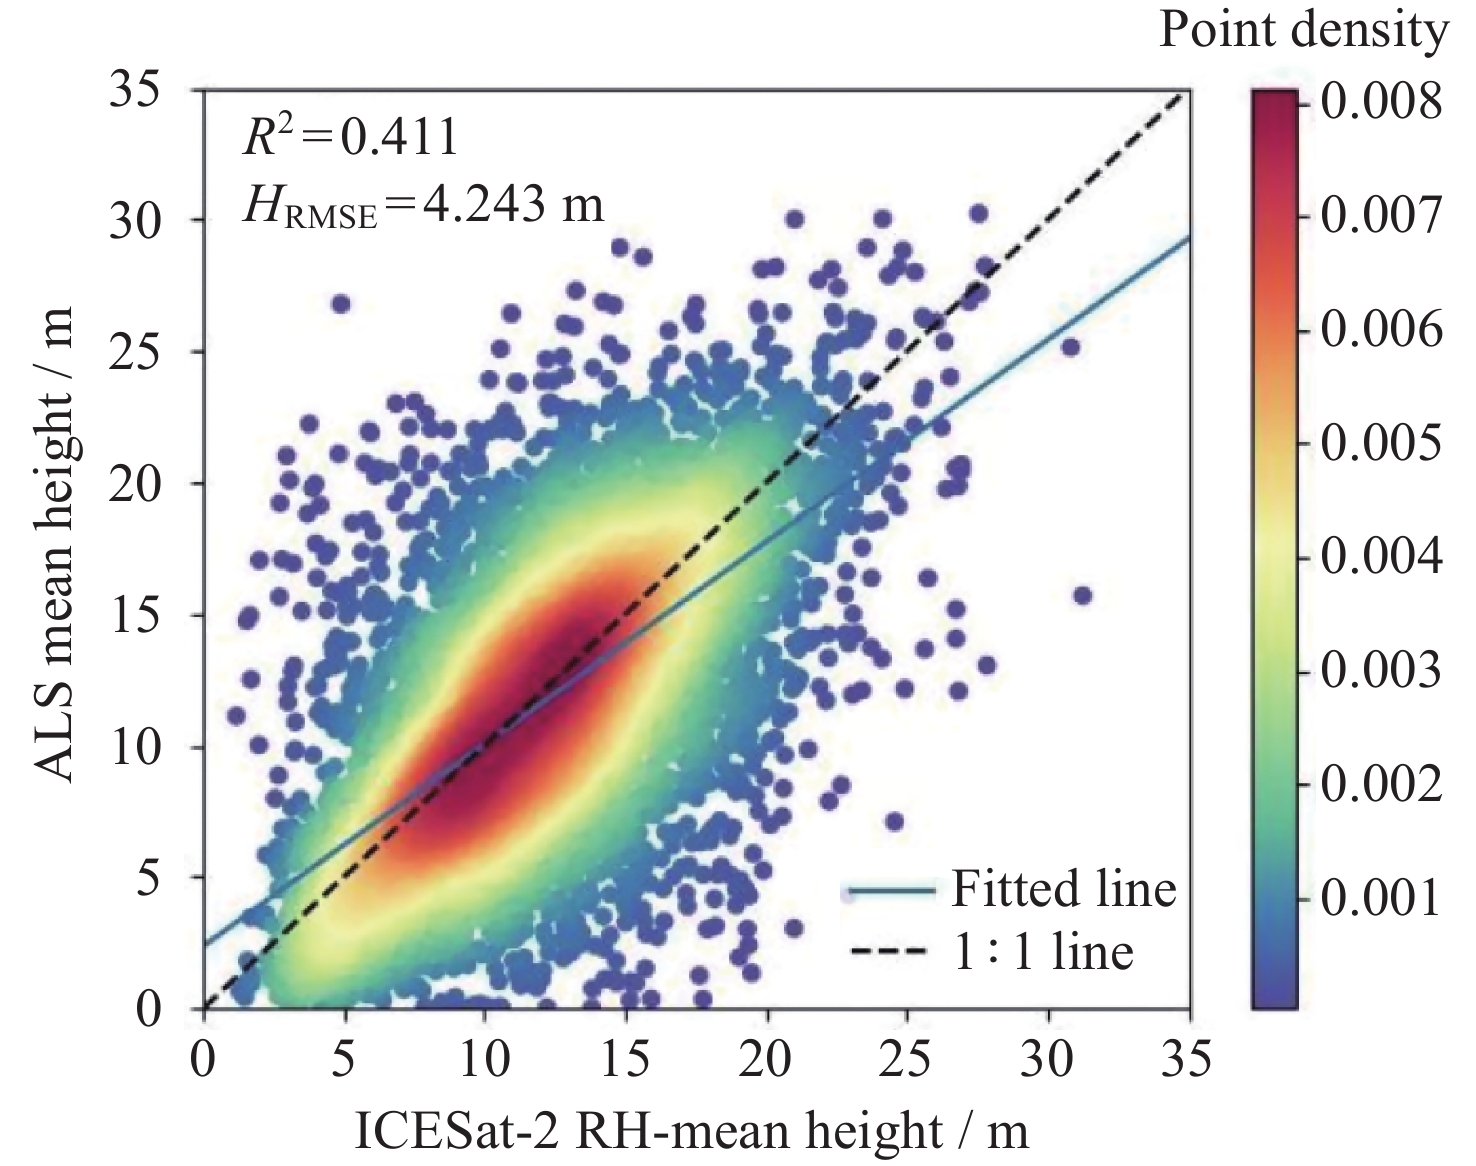
图 7 机载与星载激光雷达冠层平均高度的一致性
Figure 7. Consistency of the average canopy height between airborne and spaceborne lidars
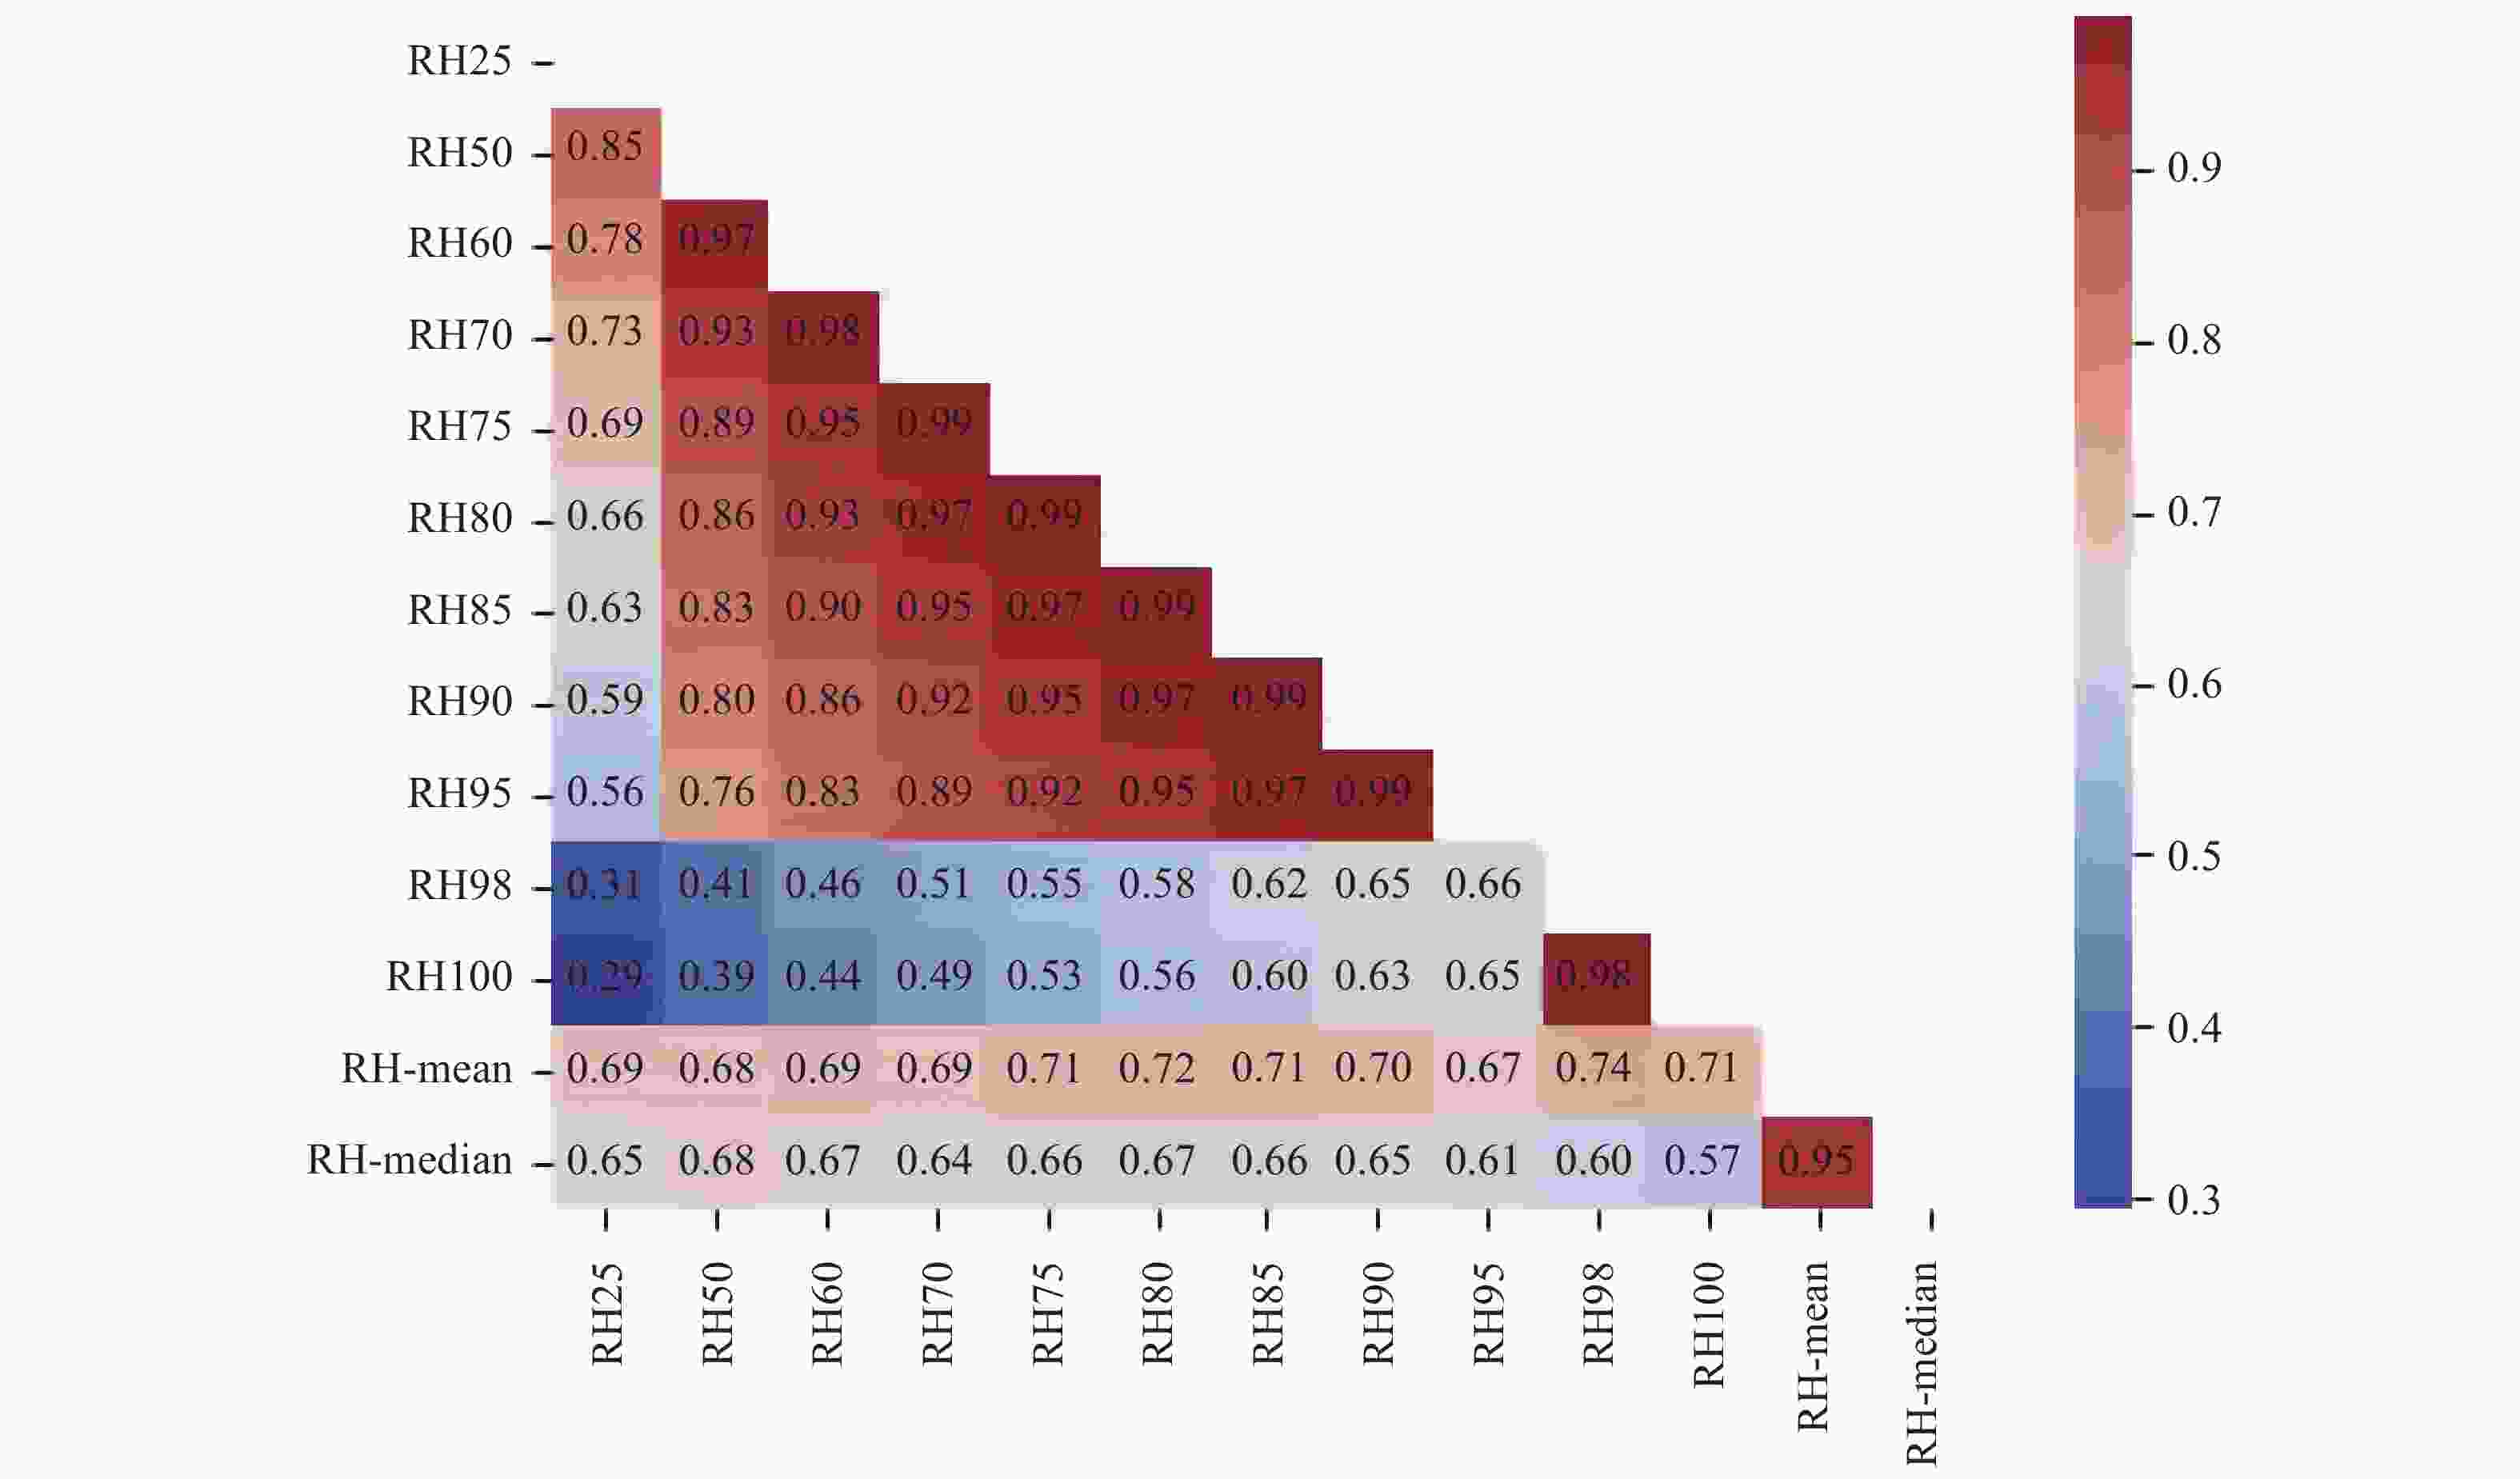
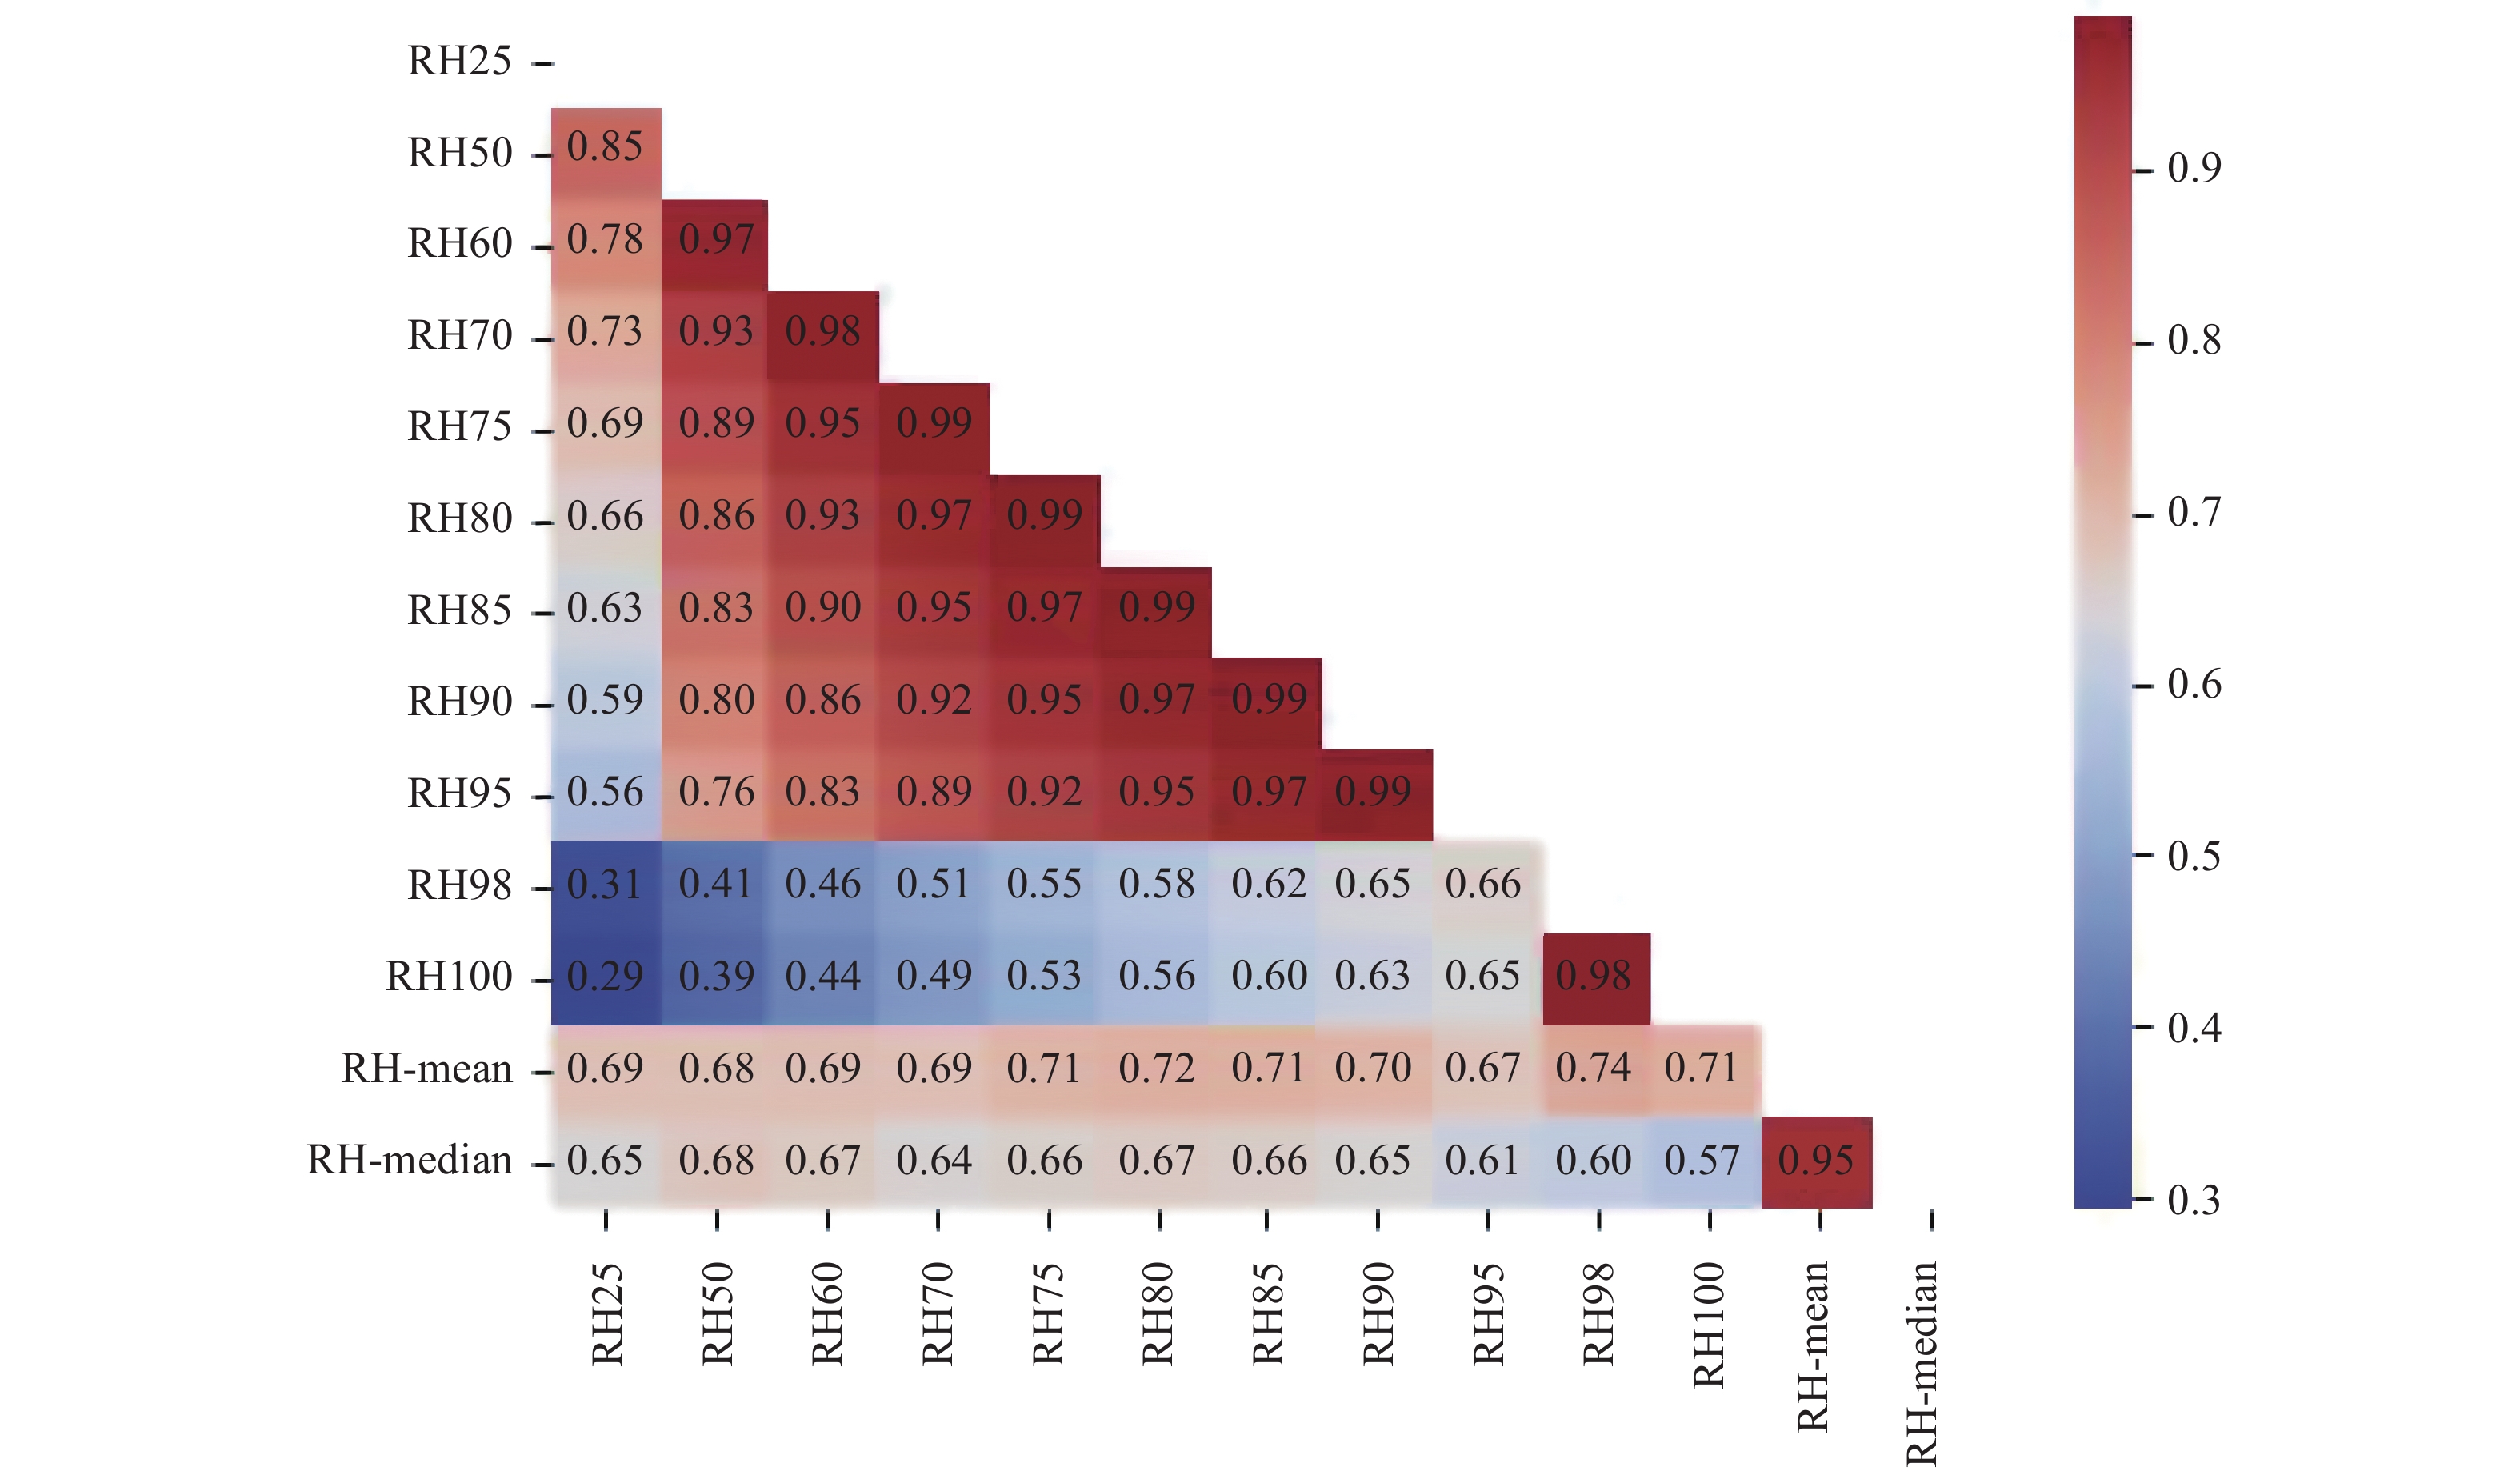
图 8 星载激光雷达数据各变量之间相关性(RH25-100表示相对高度的百分位数,RH-mean和RH-median分别表示相对高度的平均值和中值。色条表示变量之间的相关性,数值越大表示变量越相关)
Figure 8. Correlation between variables of spaceborne lidar data (RH25-100 represents the percentile of relative height, and RH-mean and RH-median represent the mean and median of relative heights, respectively. The color bars indicate the correlation between the variables, with larger values indicating stronger correlations)
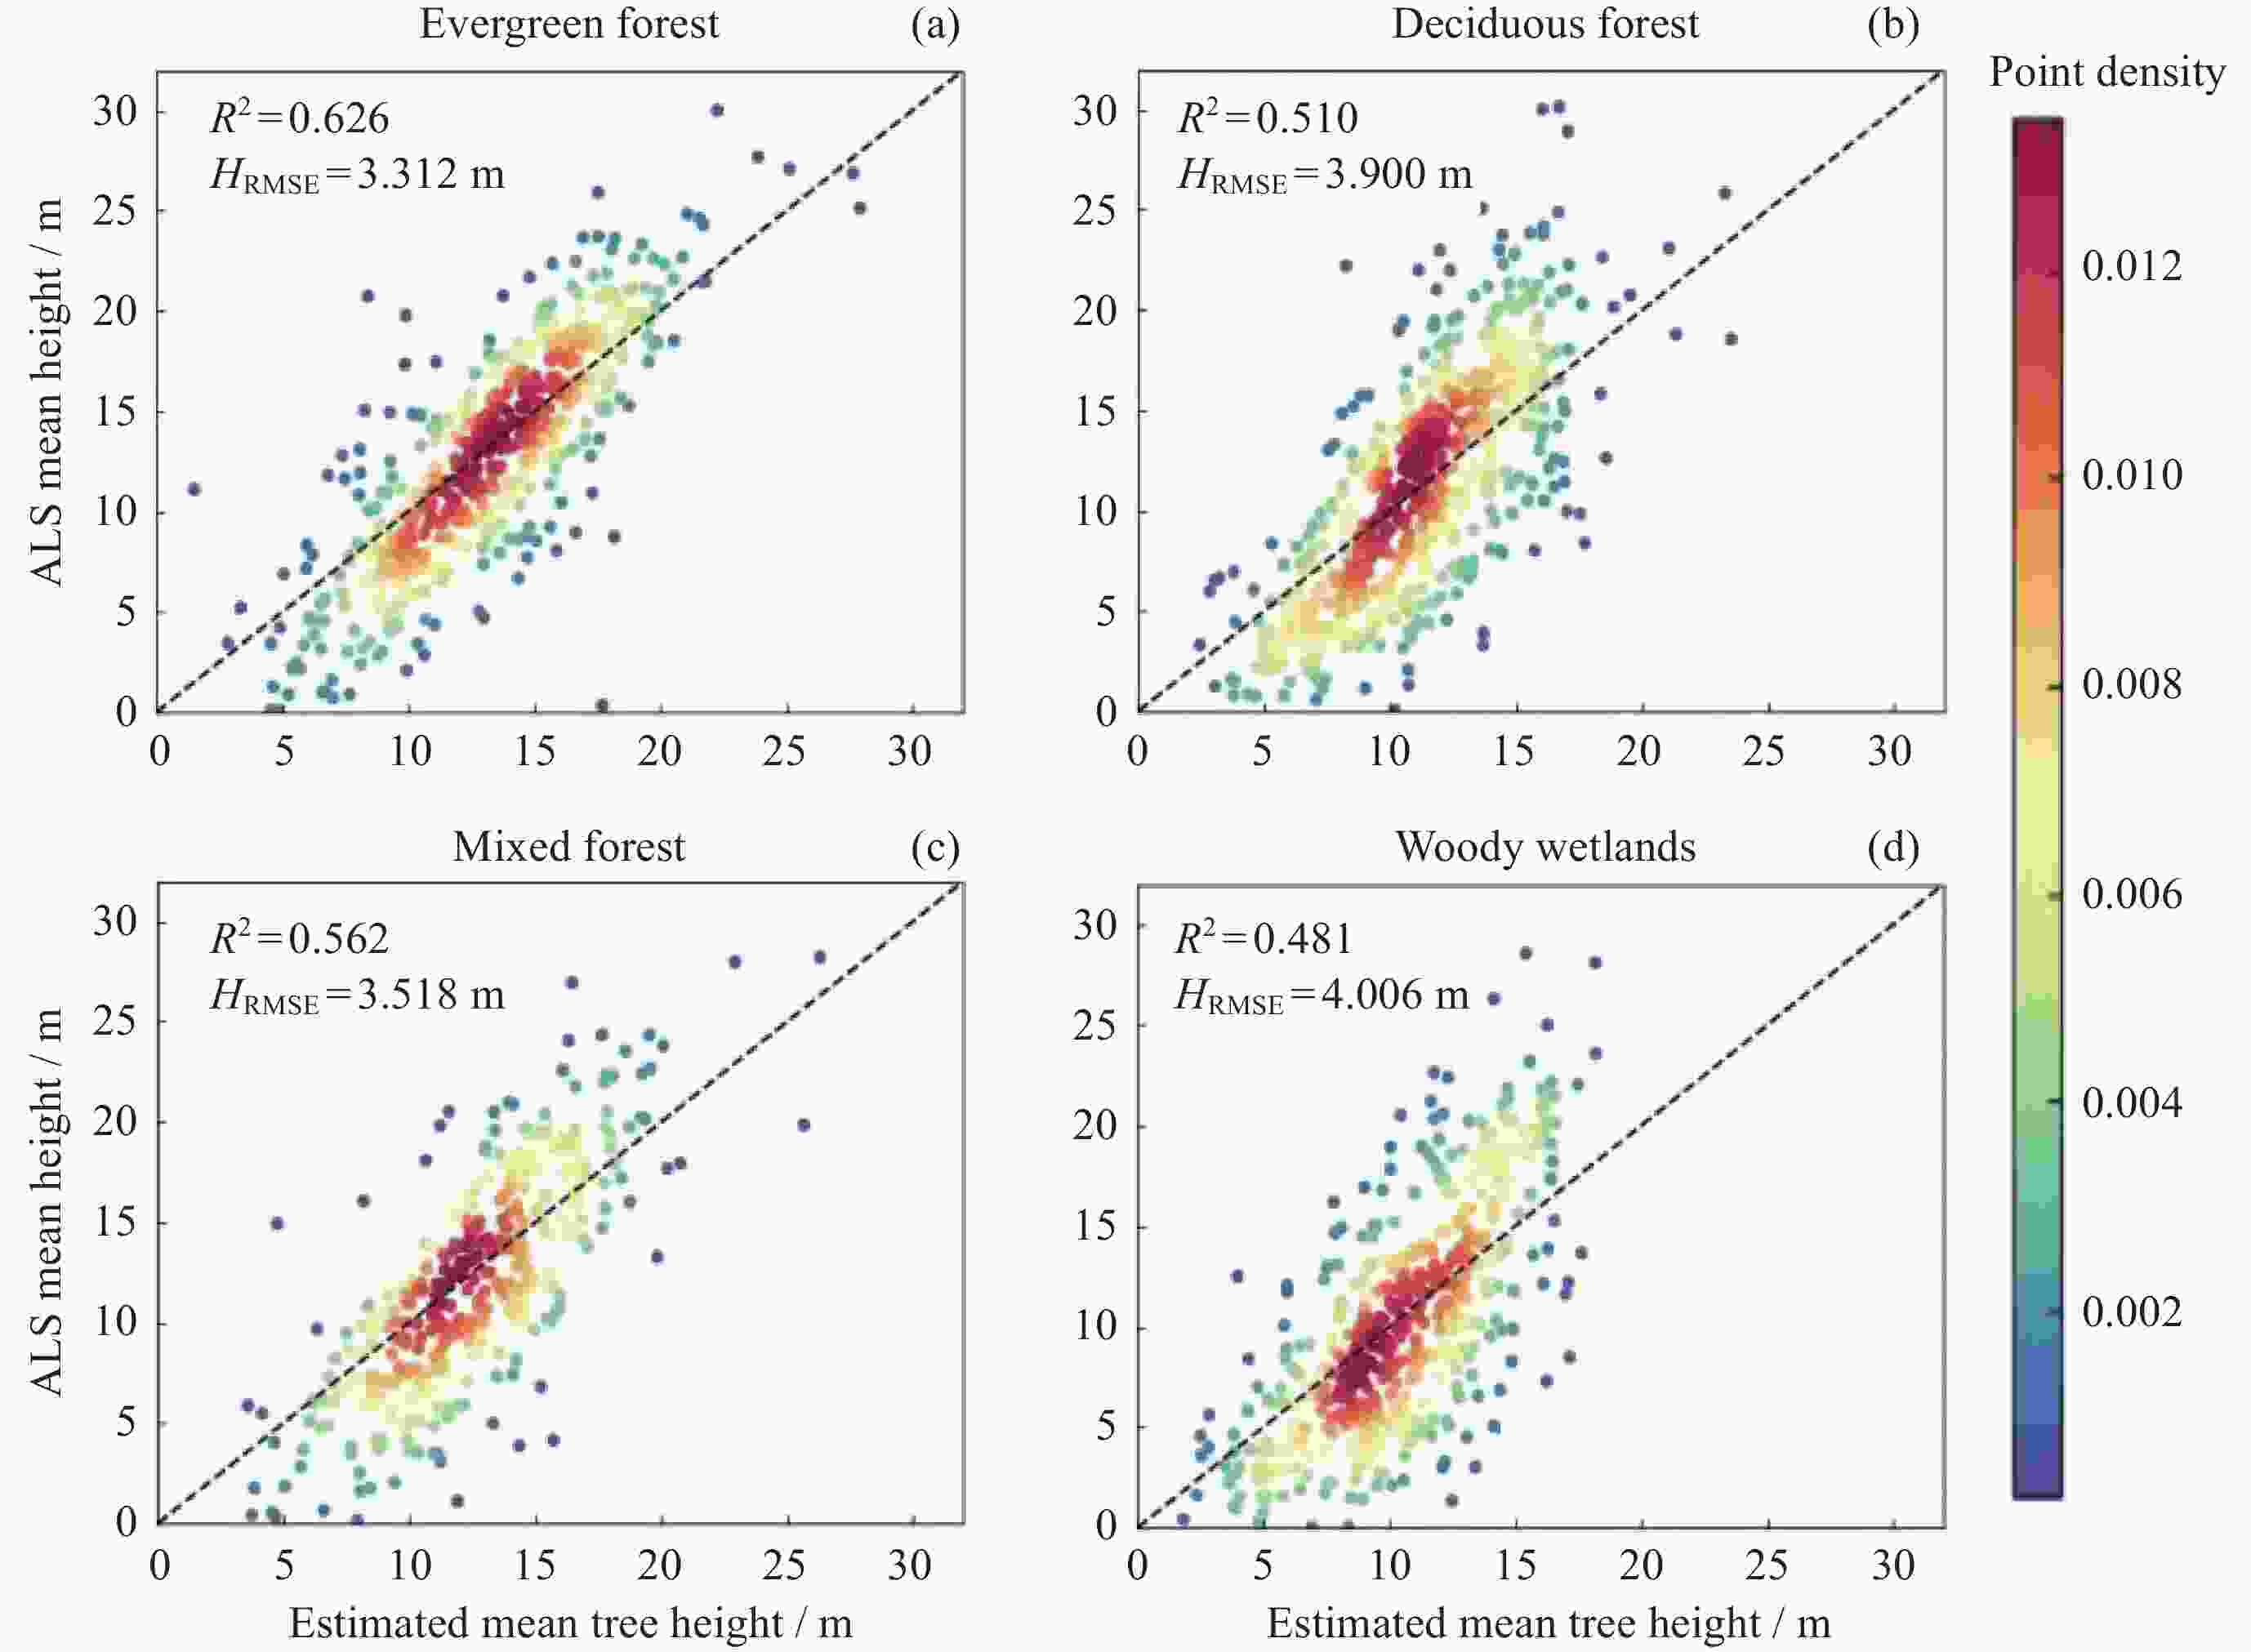
图 9 ICESat-2不同树种冠层平均高度建模散点图
Figure 9. ICESat-2 Scatter plot of average canopy height modeling for different tree species

图 10 随机森林模型拟合结果。(a)冠层最大高度拟合结果,(b)冠层平均高度拟合结果
Figure 10. Fitting results of random forest model. (a) Maximum canopy height fitting results, (b) average canopy height fitting results
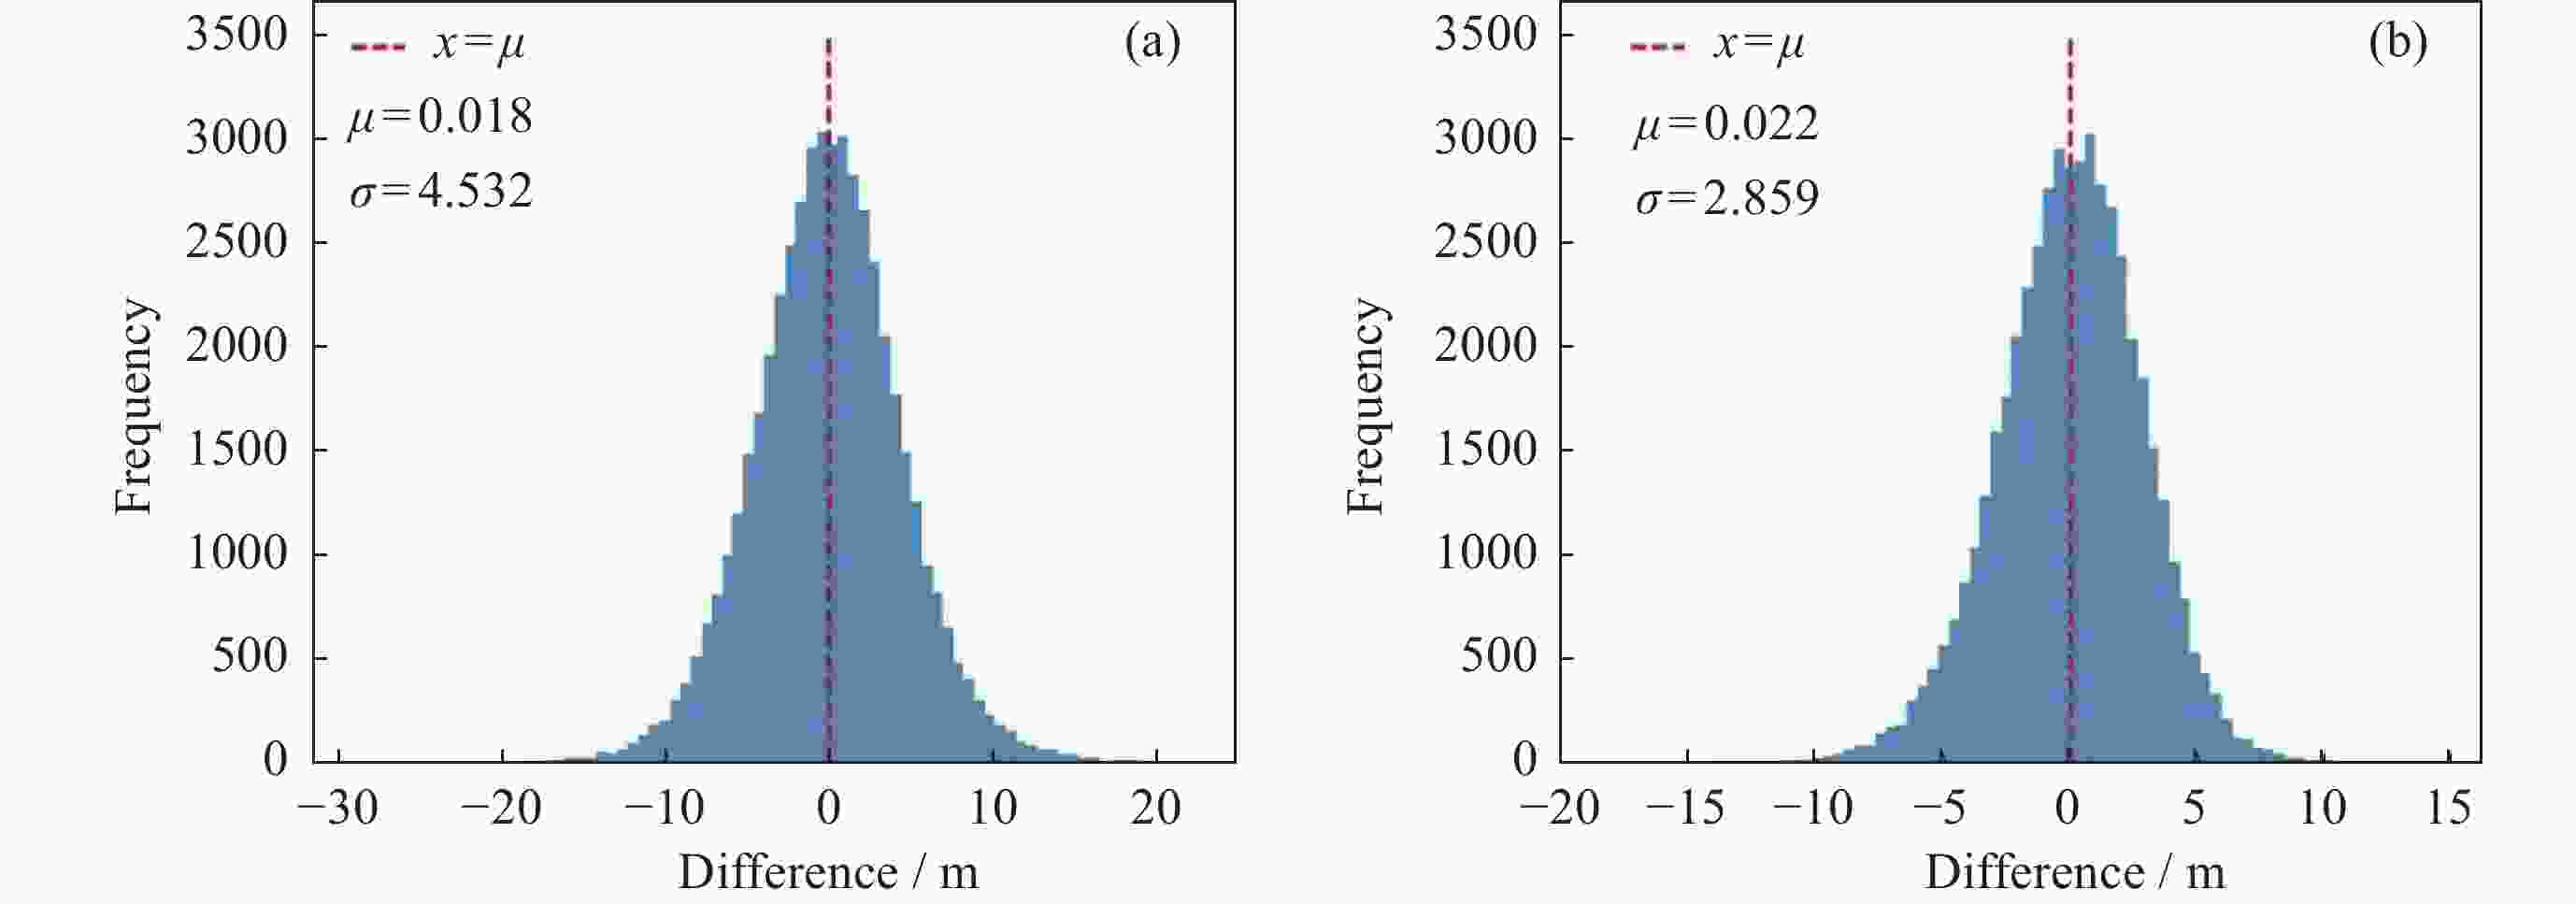
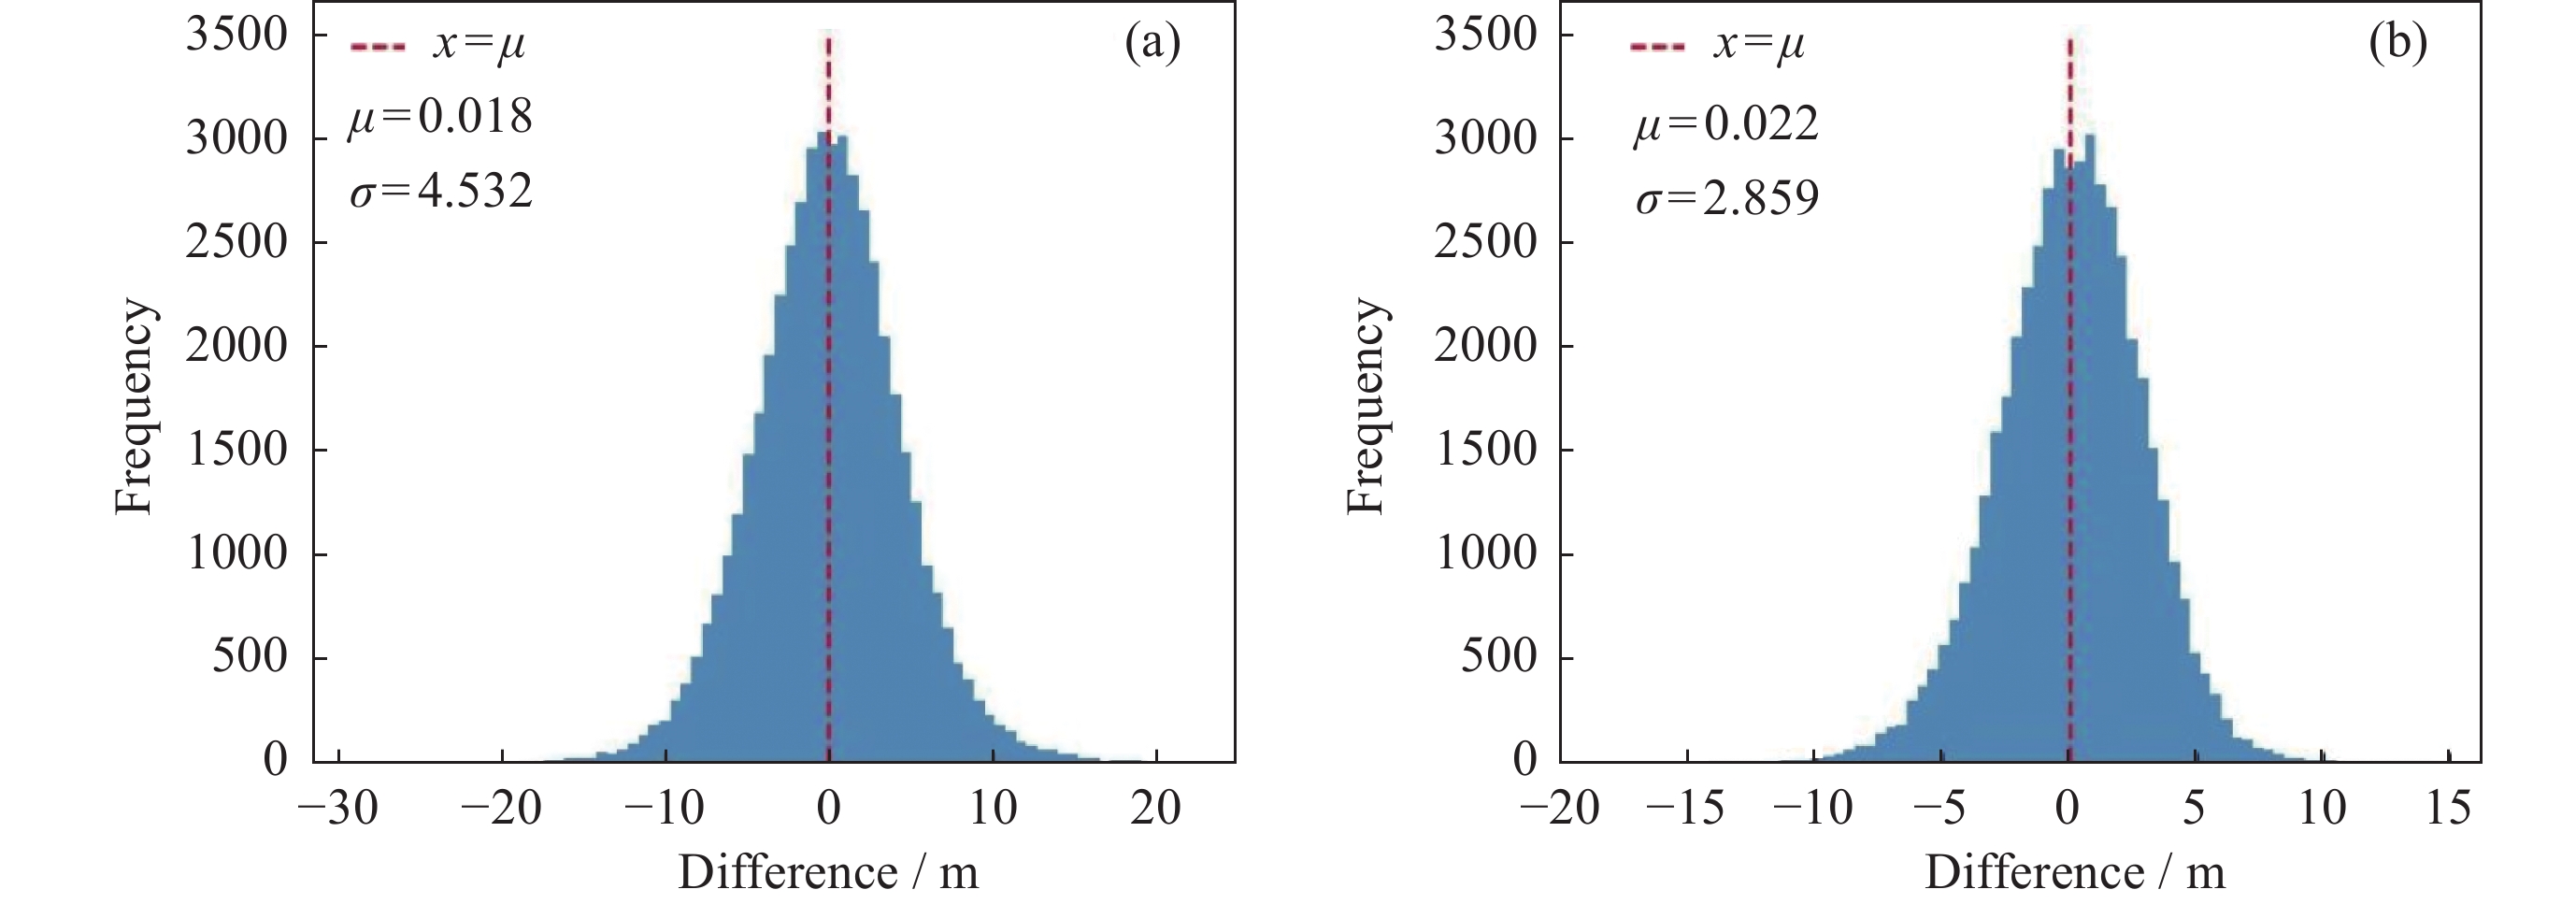
图 11 估算冠层高度与真实冠层高度差值直方图 (ICESat-2估算的冠层高度减去根据辅助影像估算的冠层高度)。(a)最大冠层高度直方图, (b)平均冠层高度直方图。$ \mu $和$ \sigma $分别表示差异的平均值和标准差
Figure 11. Histogram of the difference between the estimated canopy height and the true canopy height (estimated tree height minus true canopy height). (a) Maximum canopy height histogram, (b) average canopy height histogram. μ and σ represent the mean and standard deviation of the differences, respectively
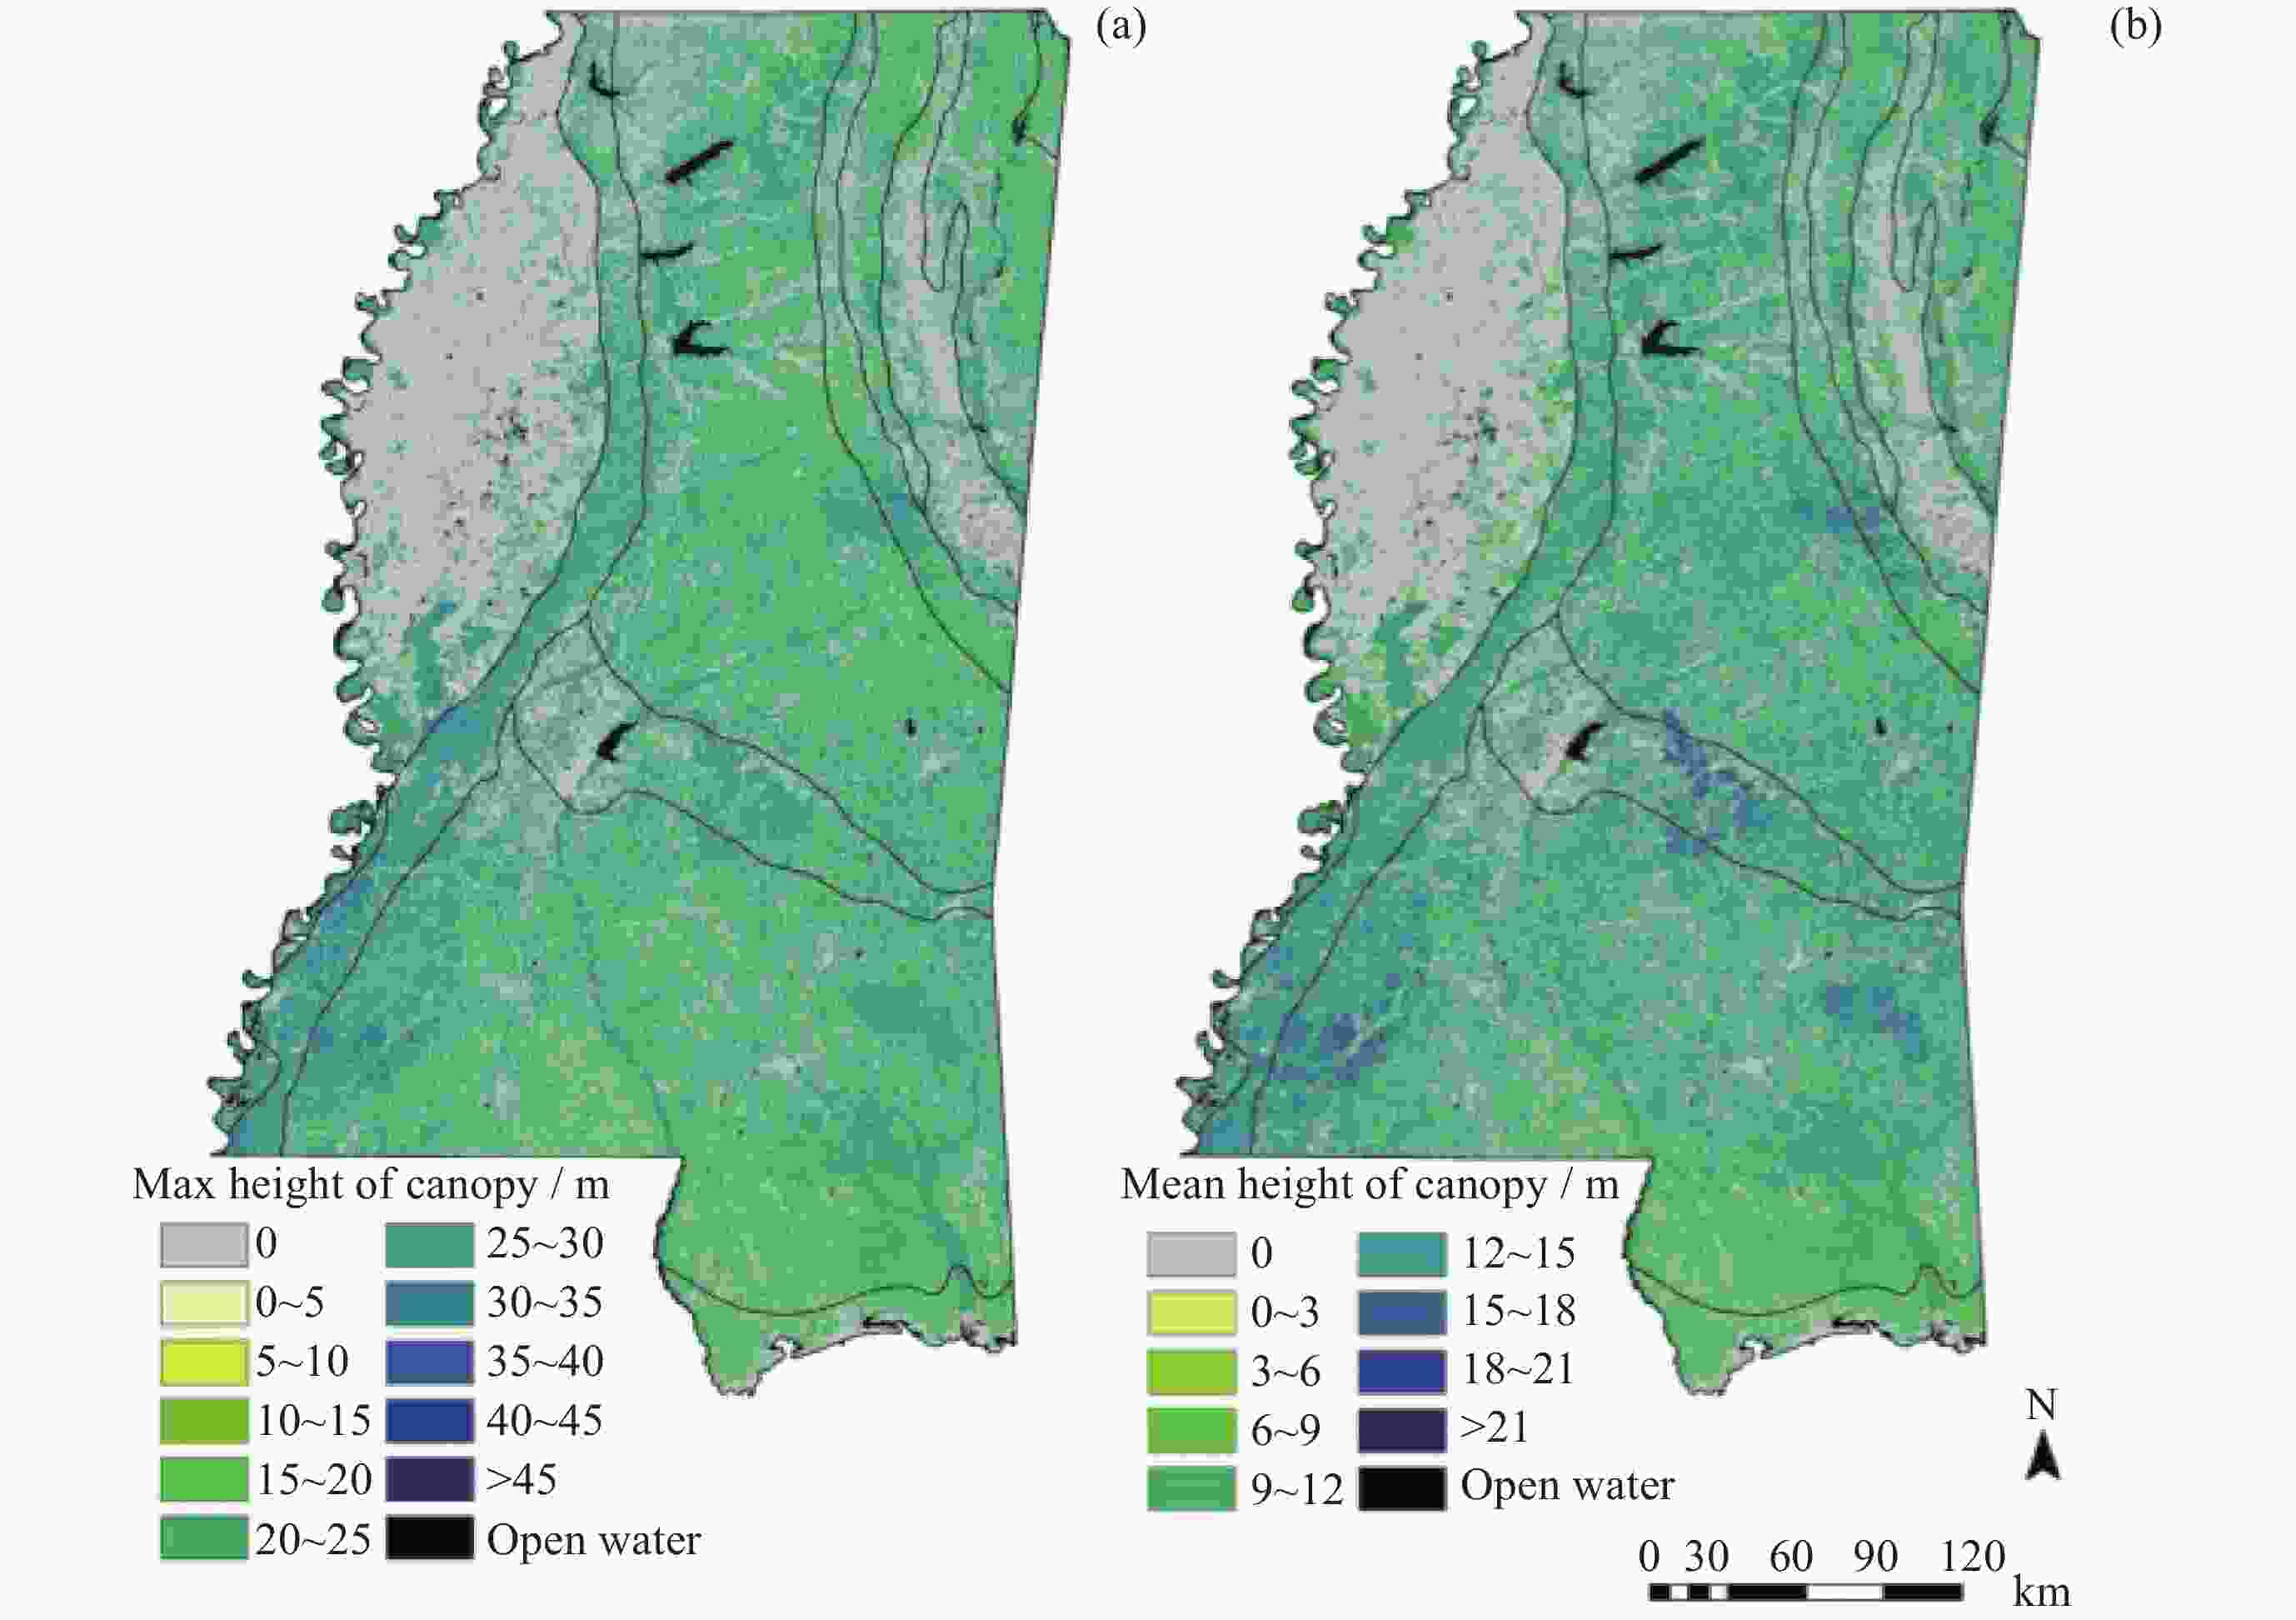
图 12 冠层最大高度与冠层平均高度在密西西比州的分布
Figure 12. Distribution of maximum canopy height and average canopy height in the state of Mississippi
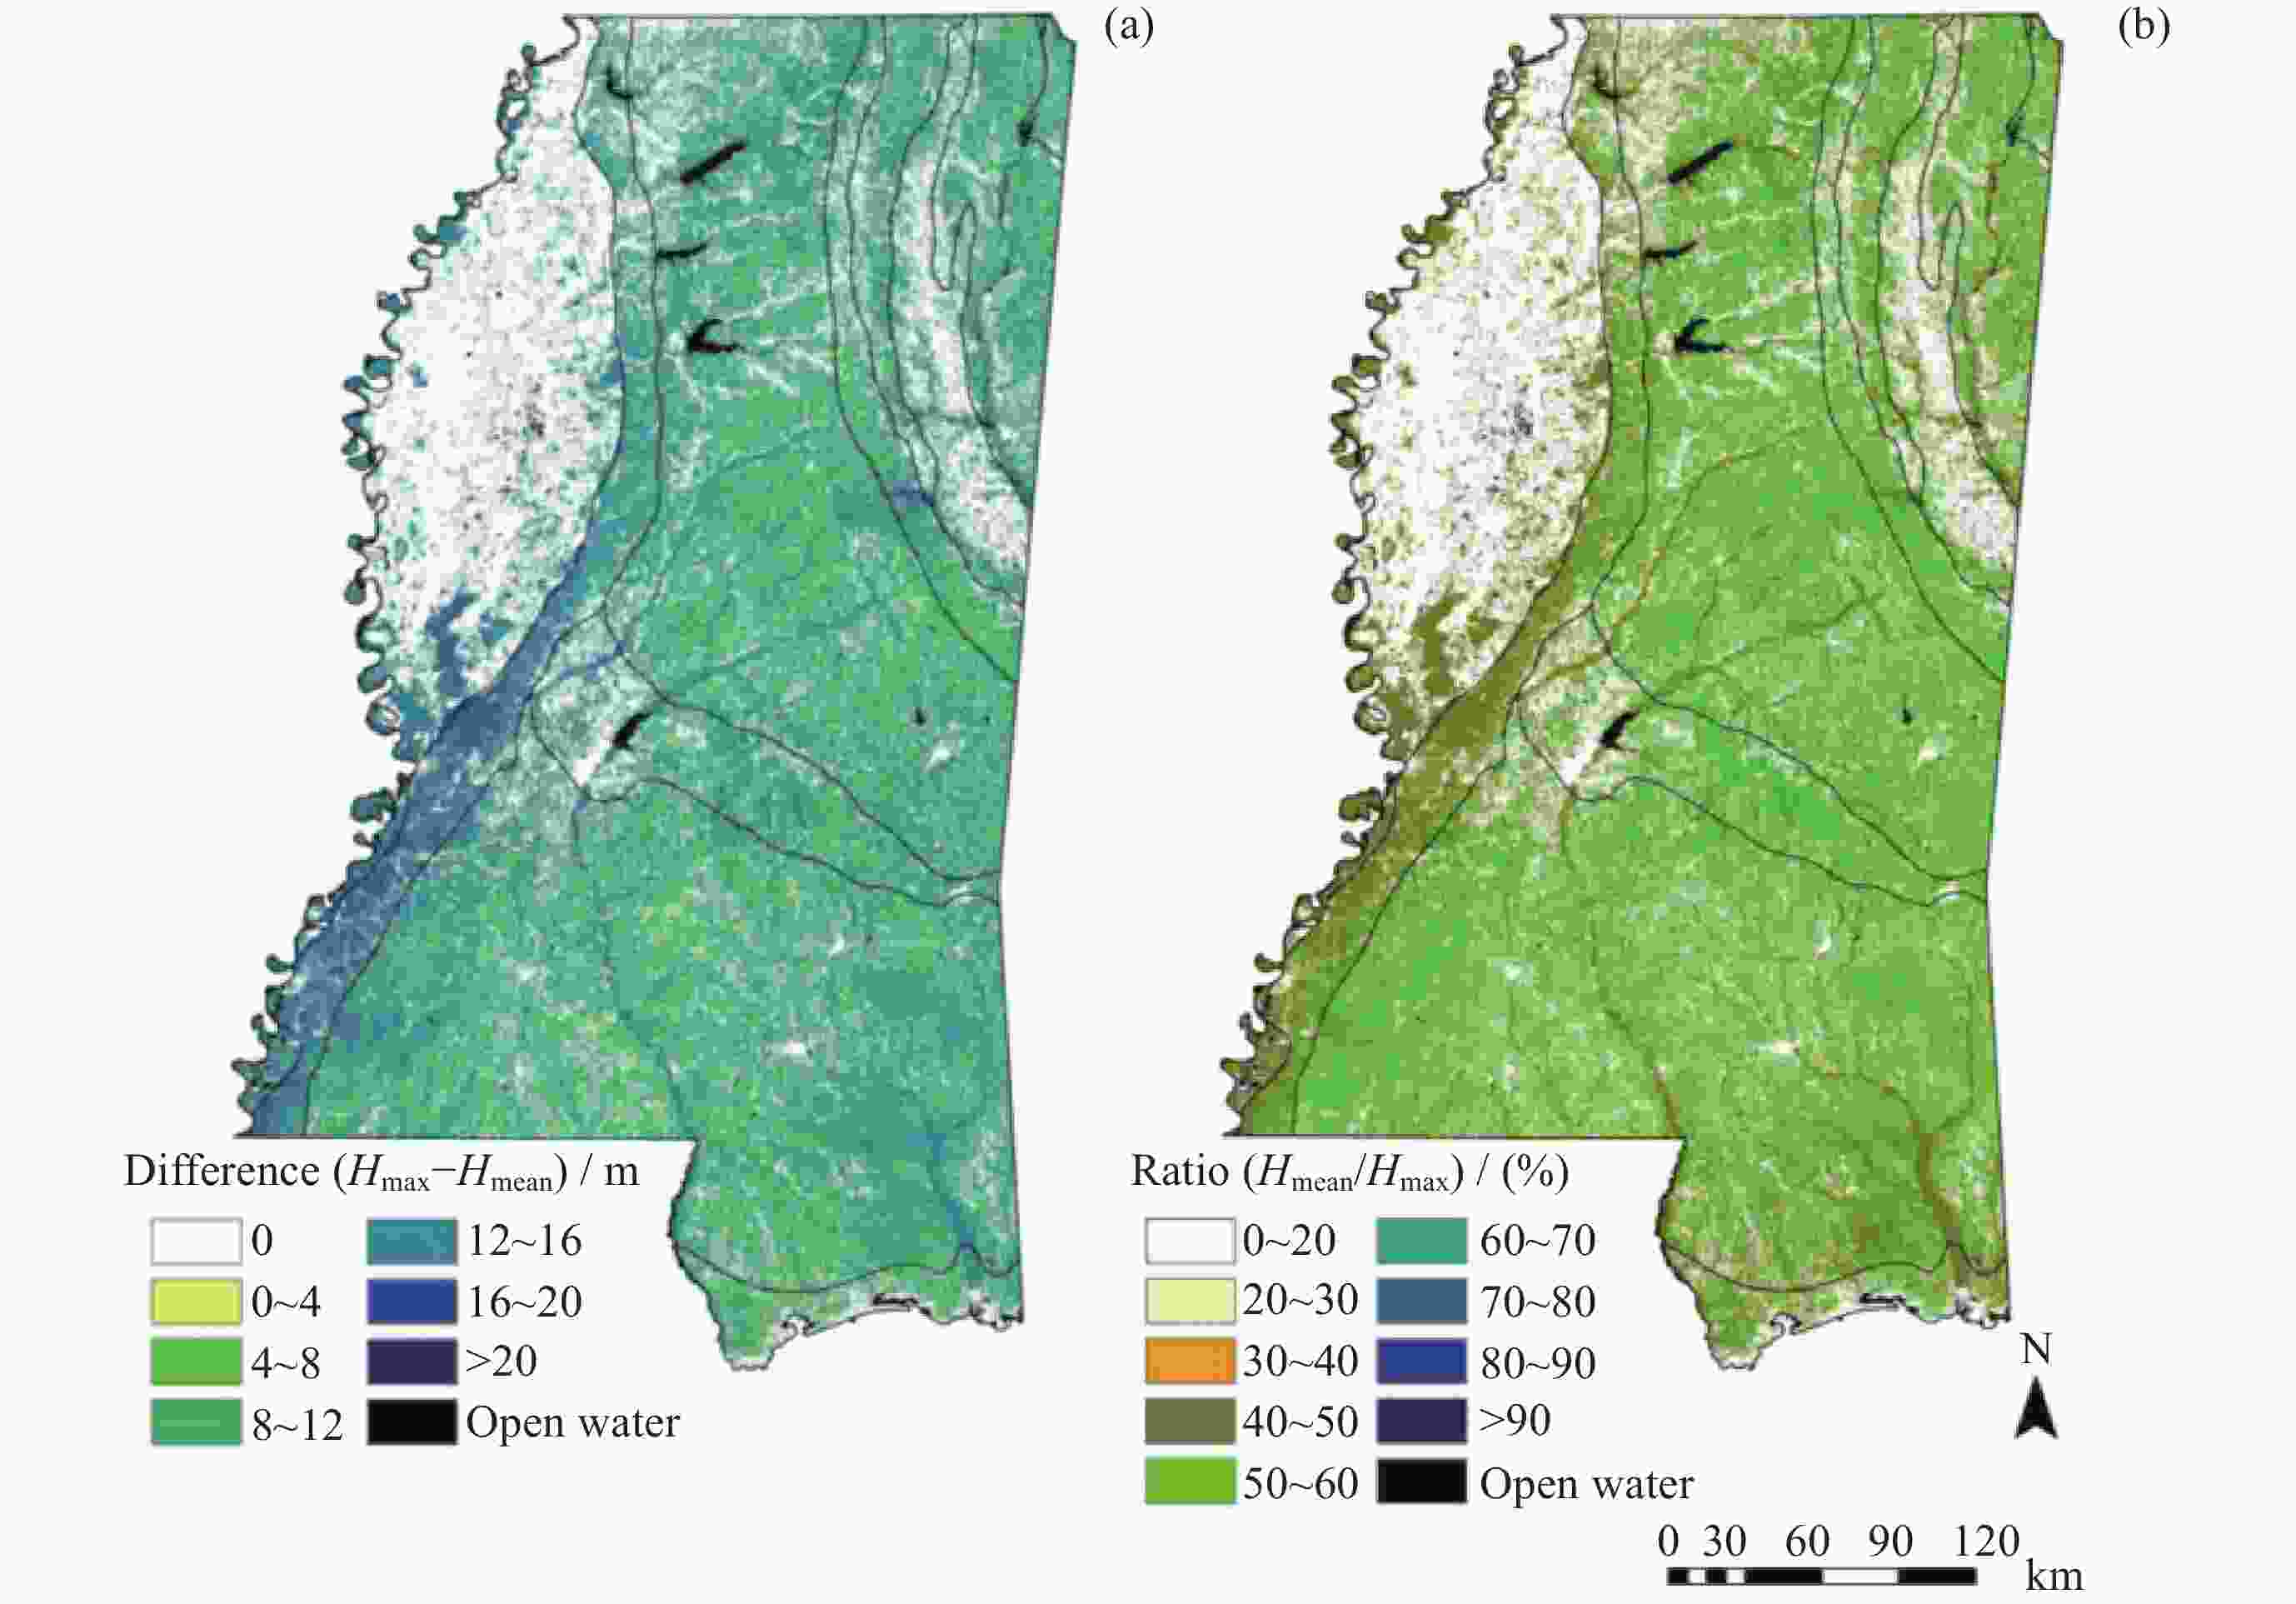
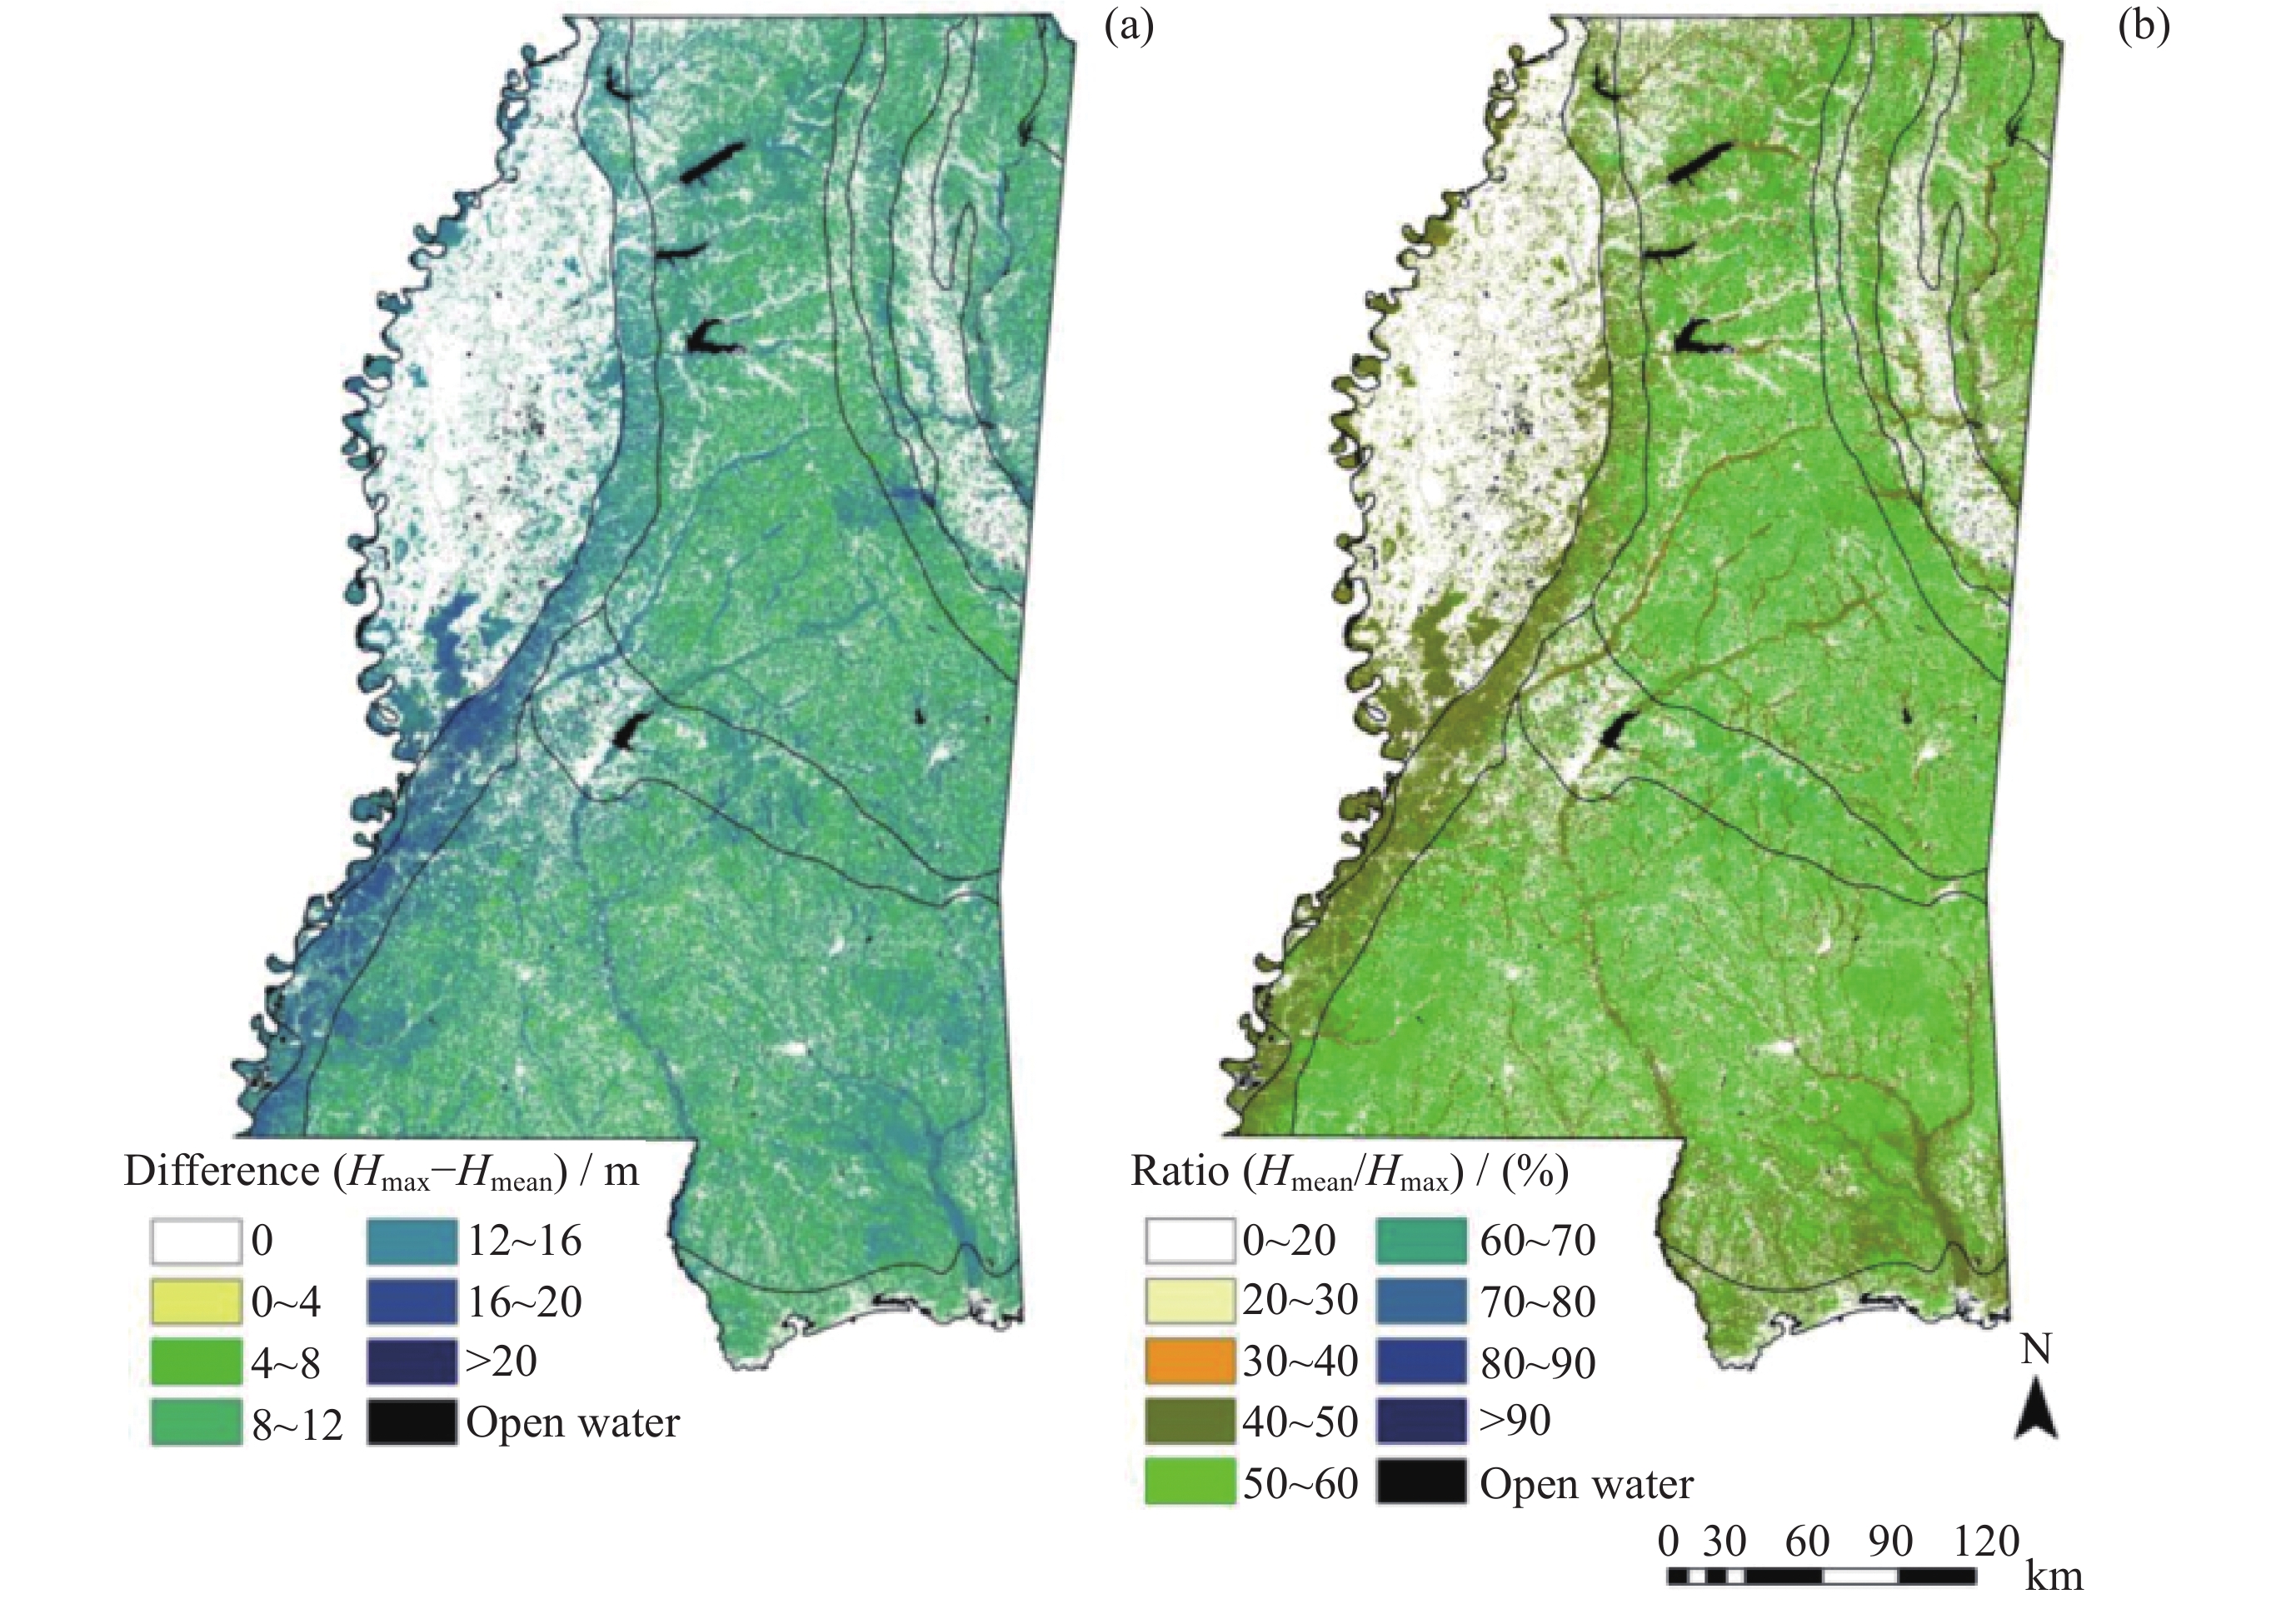
图 13 冠层最大高度与冠层平均高度差值与比值
Figure 13. Difference diagram and ratio diagram between maximum canopy height and average canopy height
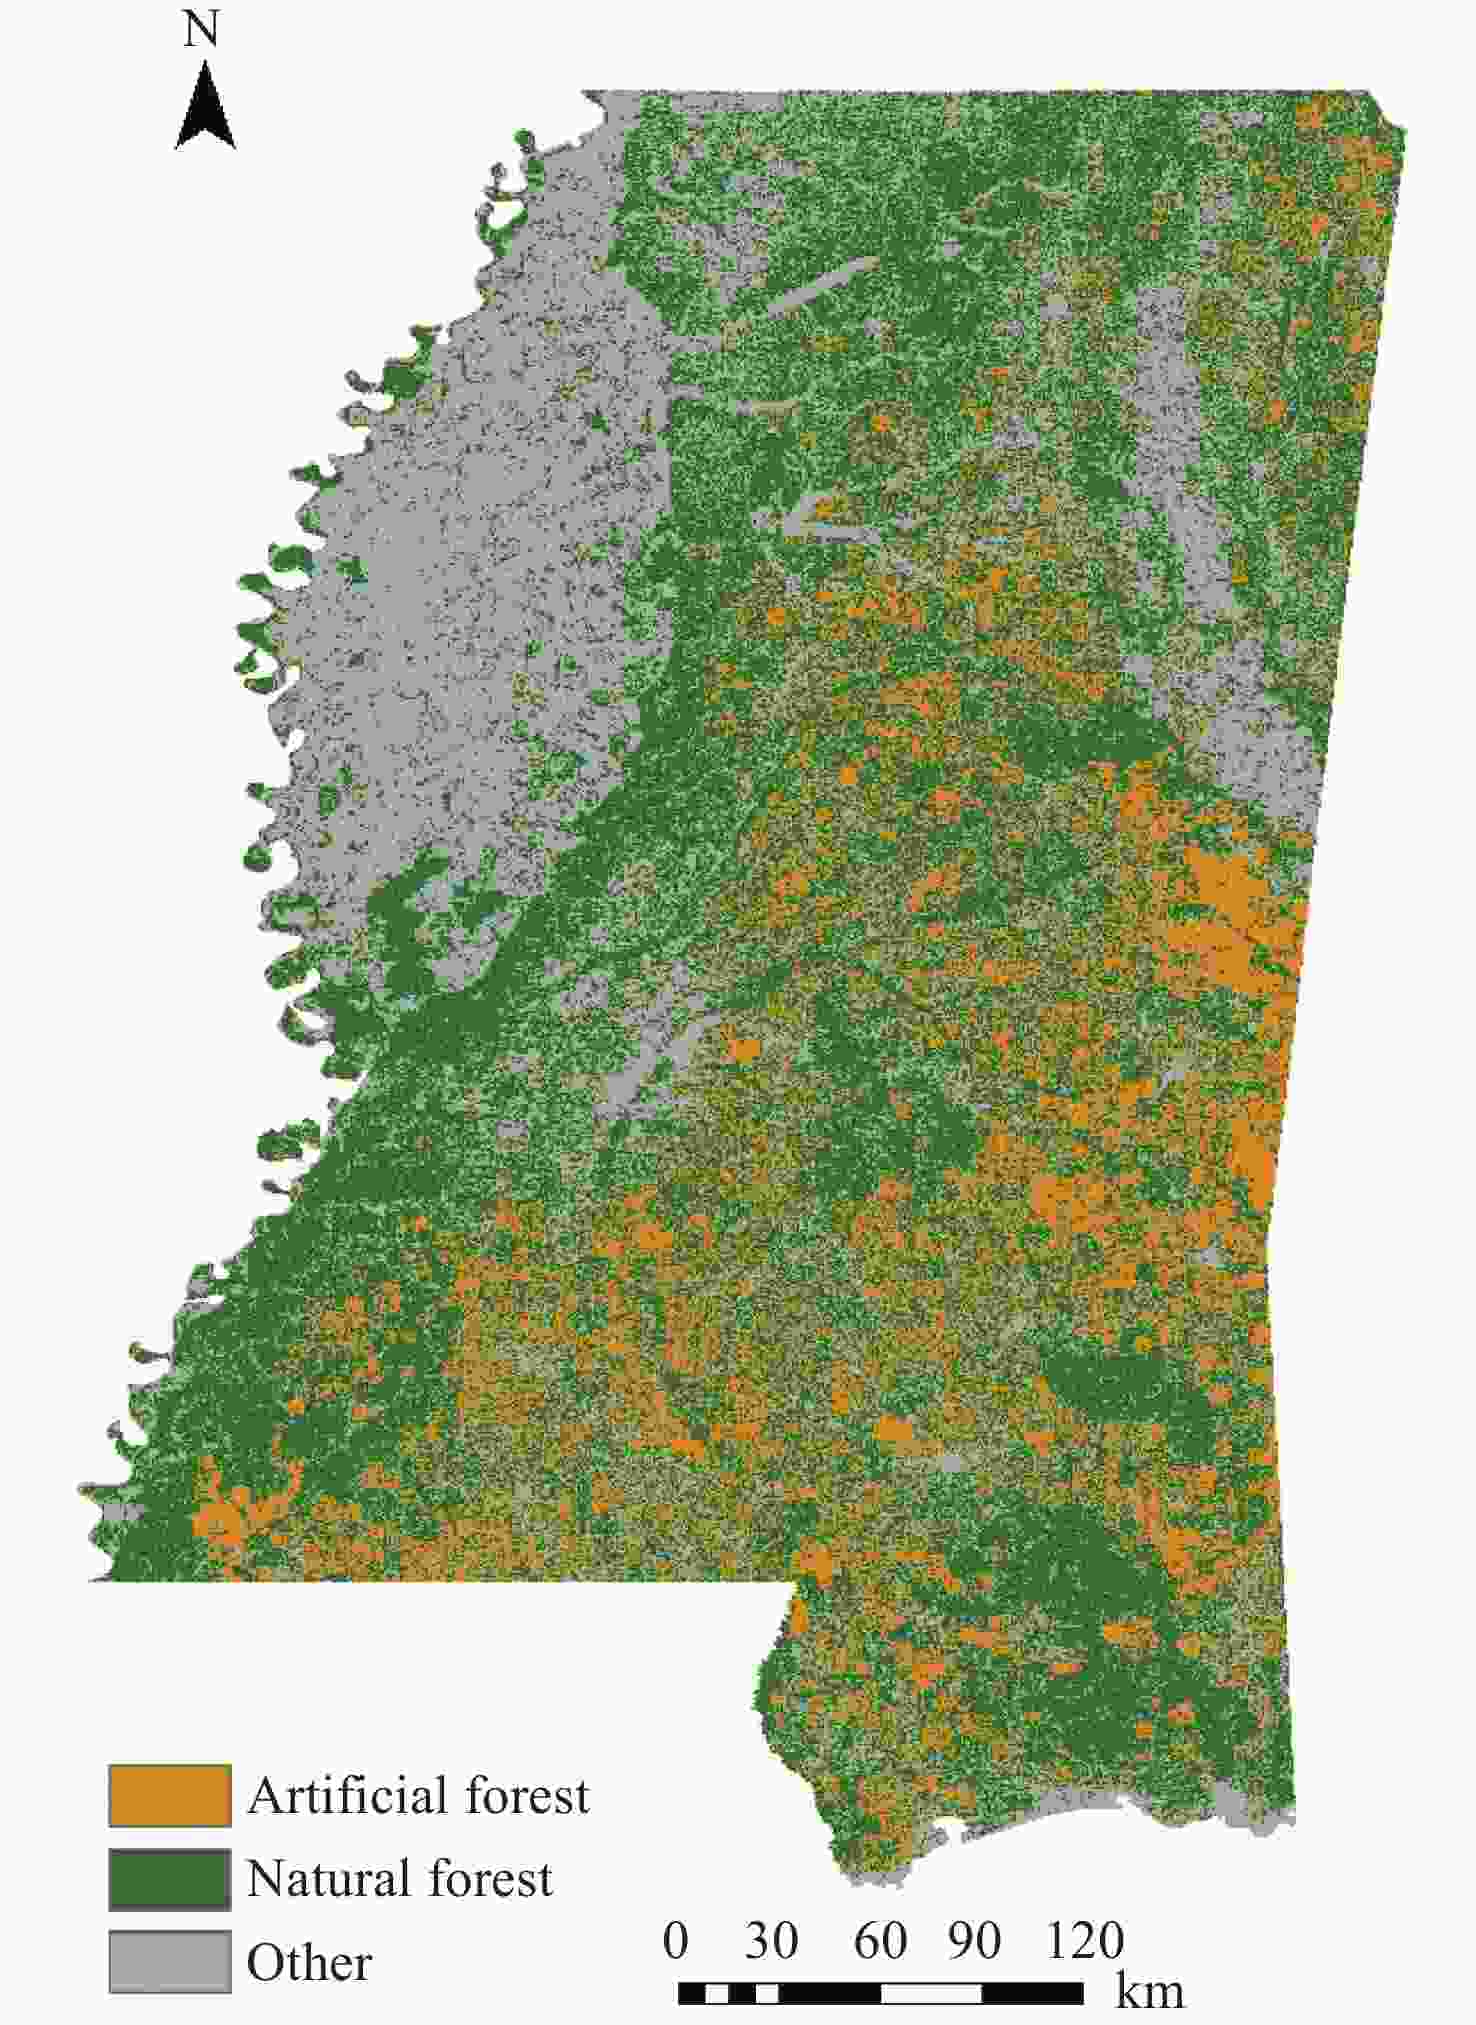
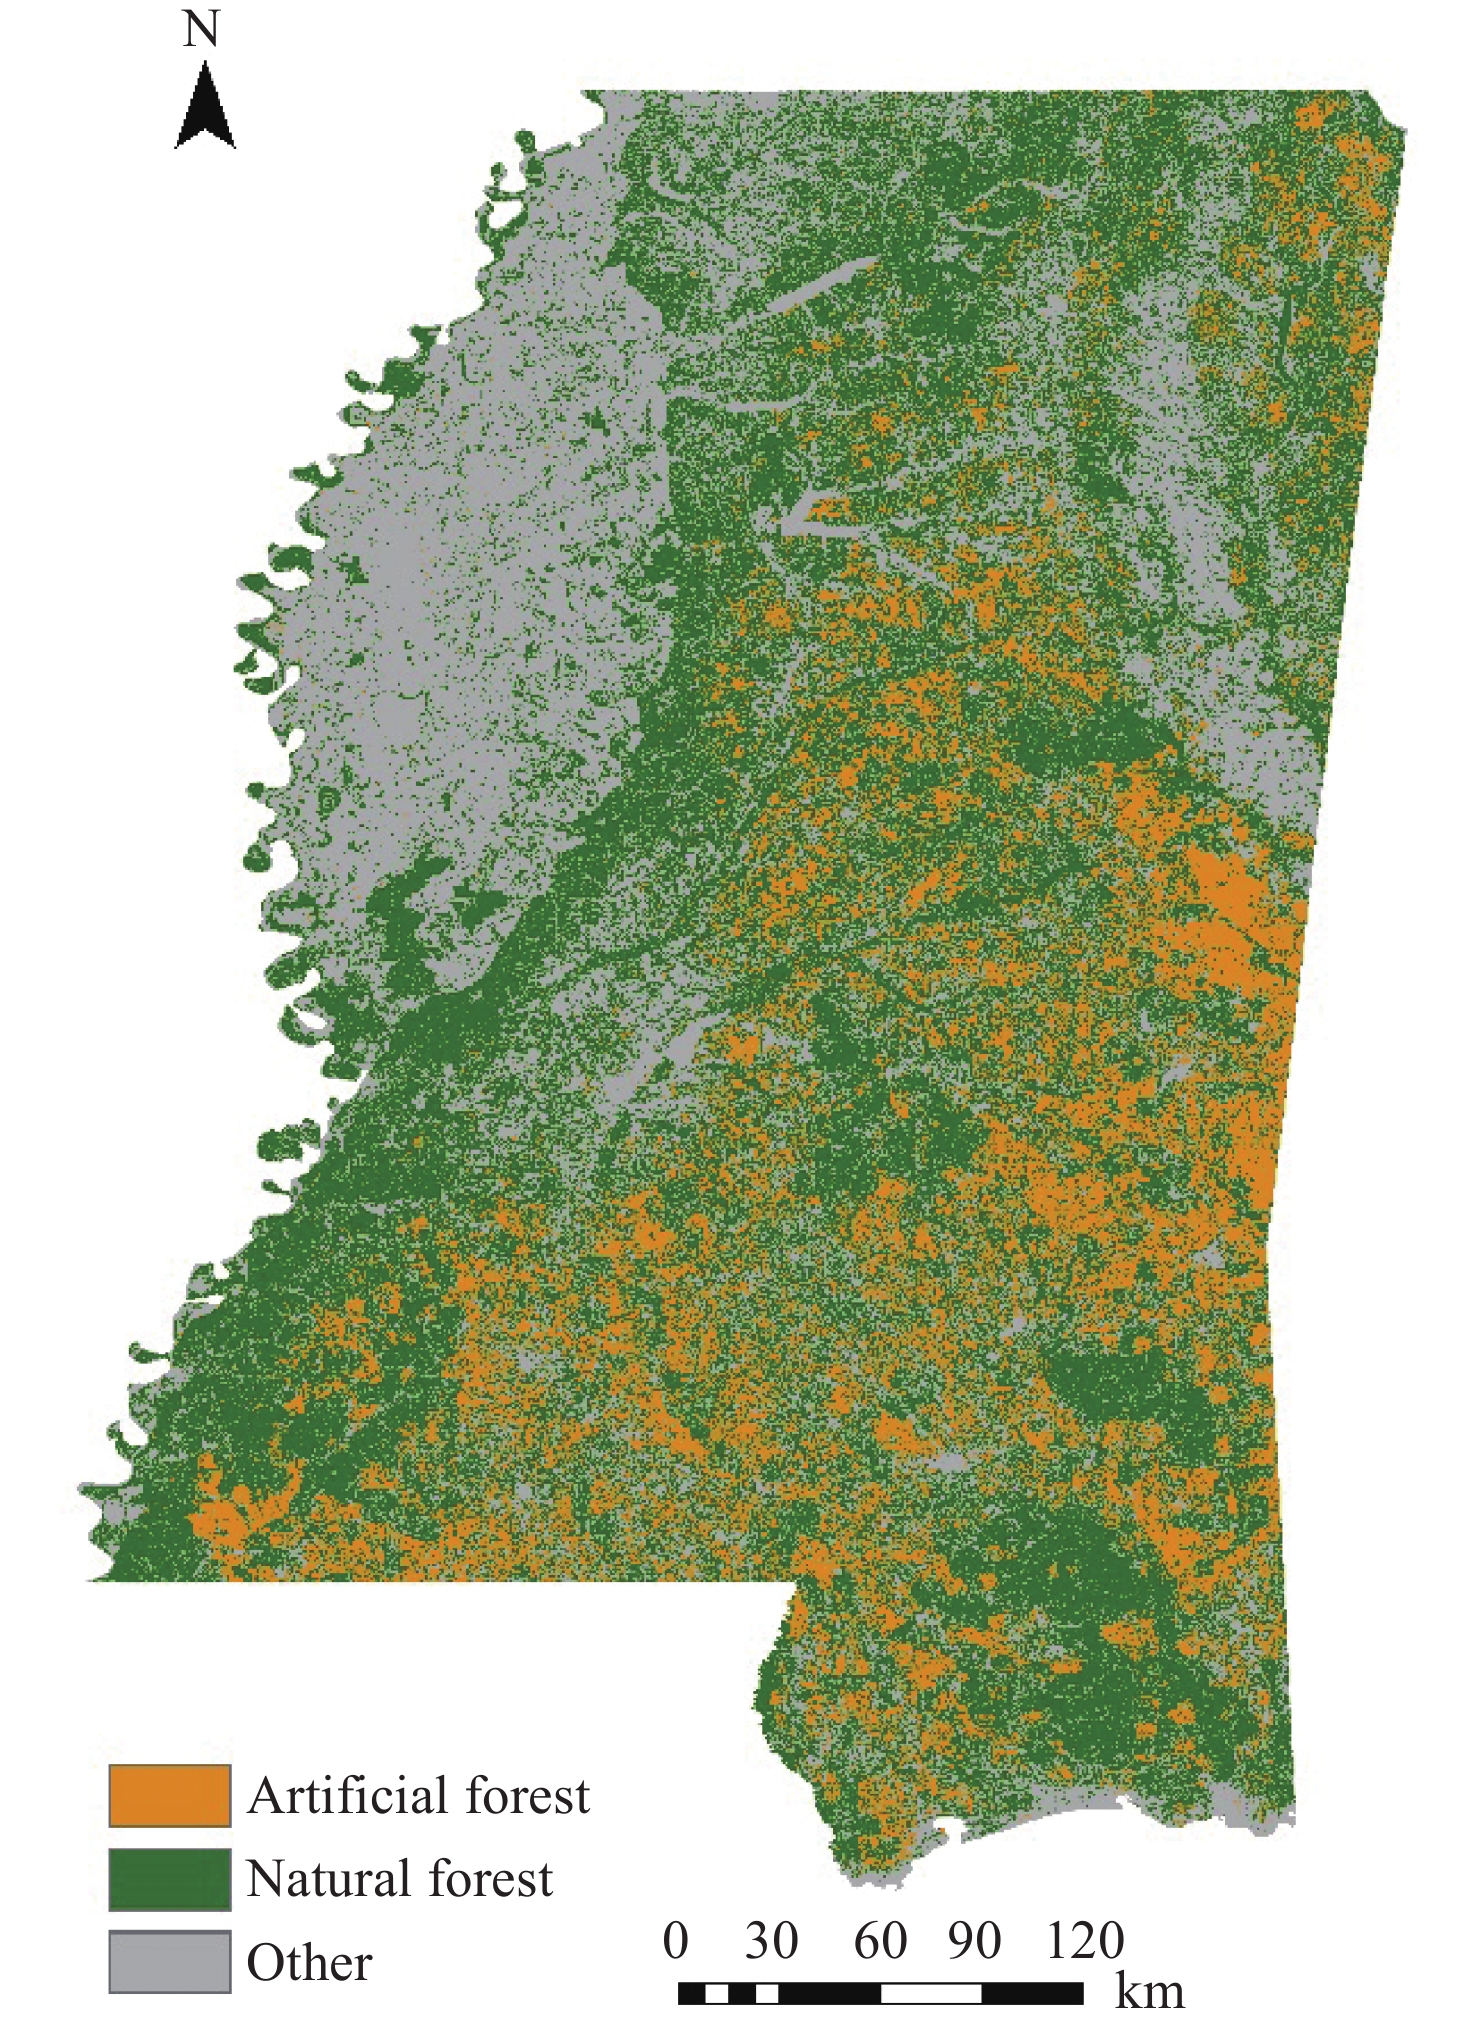
图 14 密西西比州人工林与自然林分布
Figure 14. Distribution of Mississippi plantations and natural forests
表 1 机器学习回归方法对比和参数设定
Table 1. Comparison and parameter setting of machine learning regression methods
机器学习 参数设置 R2 $ {H}_{\mathrm{R}\mathrm{M}\mathrm{S}\mathrm{E}}/ $m 支持向量机 C=1 Ggamana=auto 0.292 5.296 随机森林 Mtry=7, Ntree=500 0.486 4.532  下载: 导出CSV
表 2 星载数据不同获取数据条件下数据一致性的比较
Table 2. Comparison of data consistency under different acquisition conditions
$ r $ $ {M}_{\mathrm{m}\mathrm{a}\mathrm{e}}/\mathrm{m} $ $ {B}_{\mathrm{b}\mathrm{i}\mathrm{a}\mathrm{s}}/\mathrm{m} $ ${N}_{\mathrm{b}\mathrm{i}\mathrm{a}\mathrm{s}\mathrm{r}\mathrm{a}\mathrm{t}\mathrm{i}\mathrm{o} }$/(%) 数据采集时间 白天 0.722 3.558 –1.936 –7.818 夜间 0.821 3.142 –2.206 –8.694 光束类型 强光束 0.808 3.191 –2.045 –8.154 弱光束 0.750 4.002 –2.273 –9.028
下载: 导出CSV
表 3 随机森林回归模型的训练精度和结果图验证精度
Table 3. Training accuracy and result graph validation accuracy of random forest regression models
冠层 训练精度 验证精度 R2 $ {H}_{\mathrm{R}\mathrm{M}\mathrm{S}\mathrm{E}} $ /m R2 $ {H}_{\mathrm{R}\mathrm{M}\mathrm{S}\mathrm{E}} $ /m 最大高度 0.486 4.532 0.489 4.155 平均高度 0.467 2.848 0.427 3.553
下载: 导出CSV
表 4 密西西比州与中国环境因子对比
Table 4. Comparison of environmental factors in Mississippi and China
环境参数 密西西比州 中国 变化范围 均值 标准差 变化范围 均值 标准差 高程/m 0~219 67.91 39.78 0~8535 1795.33 1716.45 坡度/(°) 0~64.51 2.96 2.01 0~70.84 6.47 7.95 湿度指数 2~22.52 6.92 1.62 4~38.1 12.32 5.04 平均降水/mm 41~110 124.37 6.28 0.75~405 47.88 14.56 平均温度/℃ 15~20 17.39 1.02 –23~27 6.49 7.91
下载: 导出CSV
表 5 不同地理区域内森林冠层高度均值
Table 5. Mean values of forest canopy heights in different geographical areas
地理区域 冠层最大高度(Hmax)/m 冠层平均高度(Hmean) /m 差值
(Hmax–Hmean) /m比值
(Hmean /Hmax) /(%)黄土丘陵 26.897 12.628 14.269 46.973 杰克逊草原 24.095 12.315 11.780 50.984 南松山 23.900 12.116 11.787 50.593 平坦林地 23.580 12.137 11.443 51.414 蓬托托克岭 23.396 11.580 11.816 49.471 黑草原 23.416 11.430 11.978 48.786 田纳西河丘陵 23.487 11.570 11.913 49.239
下载: 导出CSV
表 6 不同森林类型差值和比值的对比
Table 6. Comparison of difference and ratio of different tree species
差值 (Hmax–Hmean)/m 比值 (Hmean/Hmax)/(%) 均值 标准差 均值 标准差 常绿林 10.38 2.00 54.91 5.45 混交林 12.33 2.02 50.04 4.97 落叶林 13.72 2.44 45.92 3.32 湿地森林 13.50 2.38 46.05 4.54
下载: 导出CSV
表 7 人工林与天然林差异分析
Table 7. Analysis of differences between planted forests and natural forests
森林类型 人工林占比% 差值 (Hmax–Hmean) /m 比值(Hmean / Hmax) /(%) 人工林 天然林 人工林 天然林 常绿林 31.3 10.16 10.52 54.07 53.84 混交林 25.2 12.02 12.36 50.26 49.47 落叶林 9.9 12.81 13.89 46.04 45.45 湿地森林 15.7 12.29 12.92 47.74 45.67 所有森林 79.1 11.19 12.22 51.23 48.77
下载: 导出CSV
-
[1] HOUGHTON R A. Aboveground forest biomass and the global carbon balance[J]. Global Change Biology, 2005, 11(6): 945-958 doi: 10.1111/j.1365-2486.2005.00955.x [2] ZELLWEGER F, BALTENSWEILER A, GINZLER C, et al. Environmental predictors of species richness in forest landscapes: Abiotic factors versus vegetation structure[J]. Journal of Biogeography, 2016, 43(6): 1080-1090 doi: 10.1111/jbi.12696 [3] NÆSSET E, ØKLAND T. Estimating tree height and tree crown properties using airborne scanning laser in a boreal nature reserve[J]. Remote Sensing of Environment, 2002, 79(1): 105-115 doi: 10.1016/S0034-4257(01)00243-7 [4] DUBAYAH R, BLAIR J B, GOETZ S, et al. The global ecosystem dynamics investigation: high-resolution laser ranging of the Earth’s forests and topography[J]. Science of Remote Sensing, 2020, 1: 100002 doi: 10.1016/j.srs.2020.100002 [5] ZHANG G, GANGULY S, NEMANI R R, et al. Estimation of forest aboveground biomass in California using canopy height and leaf area index estimated from satellite data[J]. Remote Sensing of Environment, 2014, 151: 44-56 doi: 10.1016/j.rse.2014.01.025 [6] SU Y J, GUO Q H, MA Q, et al. SRTM DEM correction in vegetated mountain areas through the integration of spaceborne LiDAR, airborne LiDAR, and optical imagery[J]. Remote Sensing, 2015, 7(9): 11202-11225 doi: 10.3390/rs70911202 [7] SU Y J, GUO Q H, XUE B L, et al. Spatial distribution of forest aboveground biomass in China: estimation through combination of spaceborne lidar, optical imagery, and forest inventory data[J]. Remote Sensing of Environment, 2016, 173: 187-199 doi: 10.1016/j.rse.2015.12.002 [8] GUO Q H, SU Y J, HU T Y, et al. Lidar boosts 3D ecological observations and Modelings: a review and perspective[J]. IEEE Geoscience and Remote Sensing Magazine, 2021, 9(1): 232-257 doi: 10.1109/MGRS.2020.3032713 [9] NAESSET E. Determination of mean tree height of forest stands using airborne laser scanner data[J]. ISPRS Journal of Photogrammetry and Remote Sensing, 1997, 52(2): 49-56 doi: 10.1016/S0924-2716(97)83000-6 [10] WANG Y S, LEHTOMÄKI M, LIANG X L, et al. Is field-measured tree height as reliable as believed-A comparison study of tree height estimates from field measurement, airborne laser scanning and terrestrial laser scanning in a boreal forest[J]. ISPRS Journal of Photogrammetry and Remote Sensing, 2019, 147: 132-145 doi: 10.1016/j.isprsjprs.2018.11.008 [11] LI W, NIU Z, SHANG R, et al. High-resolution mapping of forest canopy height using machine learning by coupling ICESat-2 LiDAR with Sentinel-1, Sentinel-2 and Landsat-8 data[J]. International Journal of Applied Earth Observation and Geoinformation, 2020, 92: 102163 doi: 10.1016/j.jag.2020.102163 [12] SAIKKU M. Mississippi forests and forestry[J]. Journal of American History, 2002, 89(1): 248 [13] ZHAO X Q, GUO Q H, SU Y J, et al. Improved progressive TIN densification filtering algorithm for airborne LiDAR data in forested areas[J]. ISPRS Journal of Photogrammetry and Remote Sensing, 2016, 117: 79-91 doi: 10.1016/j.isprsjprs.2016.03.016 [14] GUO Q H, LI W K, YU H, et al. Effects of topographic variability and Lidar sampling density on several DEM interpolation methods[J]. Photogrammetric Engineering & Remote Sensing, 2010, 76(6): 701-712 doi: 10.14358/pers.76.6.701 [15] NIE S, WANG C, ZENG H C, et al. A revised terrain correction method for forest canopy height estimation using ICESat/GLAS data[J]. ISPRS Journal of Photogrammetry and Remote Sensing, 2015, 108: 183-190 doi: 10.1016/j.isprsjprs.2015.07.008 [16] MARKUS T, NEUMANN T, MARTINO A, et al. The ice, cloud, and land elevation satellite-2 (ICESat-2): science requirements, concept, and implementation[J]. Remote Sensing of Environment, 2017, 190: 260-273 doi: 10.1016/j.rse.2016.12.029 [17] NEUENSCHWANDER A, PITTS K. The ATL08 land and vegetation product for the ICESat-2 Mission[J]. Remote Sensing of Environment, 2019, 221: 247-259 doi: 10.1016/j.rse.2018.11.005 [18] SMITH B, FRICKER H A, GARDNER A S, et al. Pervasive ice sheet mass loss reflects competing ocean and atmosphere processes[J]. Science, 2020, 368(6496): 1239-1242 doi: 10.1126/science.aaz5845 [19] WANG C, ZHU X X, NIE S, et al. Ground elevation accuracy verification of ICESat-2 data: a case study in Alaska, USA[J]. Optics Express, 2019, 27(26): 38168-38179 doi: 10.1364/OE.27.038168 [20] MARTINO A J, NEUMANN T A, KURTZ N T, et al. ICESat-2 mission overview and early performance[C]. Remote Sensing 2019, 11151 (111510C), https://doi.org/10.1117/12.2534938 [21] ZHAO X Q, SU Y J, HU T Y, et al. A global corrected SRTM DEM product for vegetated areas[J]. Remote Sensing Letters, 2018, 9(4): 393-402 doi: 10.1080/2150704X.2018.1425560 [22] LANG A C, HÄRDTLE W, BRUELHEIDE H, et al. Tree morphology responds to neighbourhood competition and slope in species-rich forests of subtropical China[J]. Forest Ecology and Management, 2010, 260(10): 1708-1715 doi: 10.1016/j.foreco.2010.08.015 [23] FICK S E, HIJMANS R J. WorldClim 2: new 1-km spatial resolution climate surfaces for global land areas[J]. International Journal of Climatology, 2017, 37(12): 4302-4315 doi: 10.1002/joc.5086 [24] HOU W J, GAO J B, WU S H, et al. Interannual variations in growing-season NDVI and its correlation with climate variables in the Southwestern Karst Region of China[J]. Remote Sensing, 2015, 7(9): 11105-11124 doi: 10.3390/rs70911105 [25] POTAPOV P, LI X Y, HERNANDEZ-SERNA A, et al. Mapping global forest canopy height through integration of GEDI and Landsat data[J]. Remote Sensing of Environment, 2021, 253: 112165 doi: 10.1016/j.rse.2020.112165 [26] WICKHAM J, STEHMAN S V, SORENSON D G, et al. Thematic accuracy assessment of the NLCD 2016 land cover for the conterminous United States[J]. Remote Sensing of Environment, 2021, 257: 112357 doi: 10.1016/j.rse.2021.112357 [27] TIWARI K, NARINE L L. A comparison of machine learning and geostatistical approaches for mapping forest canopy height over the Southeastern US Using ICESat-2[J]. Remote Sensing, 2022, 14(22): 5651 doi: 10.3390/rs14225651 [28] SOTHE C, GONSAMO A, LOURENÇO R B, et al. Spatially continuous mapping of forest canopy height in Canada by combining GEDI and ICESat-2 with PALSAR and sentinel[J]. Remote Sensing, 2022, 14(20): 5158 doi: 10.3390/rs14205158 [29] SILVEIRA E M O, RADELOFF V C, MARTINUZZI S, et al. Nationwide native forest structure maps for Argentina based on forest inventory data, SAR Sentinel-1 and vegetation metrics from Sentinel-2 imagery[J]. Remote Sensing of Environment, 2023, 285: 113391 doi: 10.1016/j.rse.2022.113391 [30] HUANG W L, MIN W K, DING J Q, et al. Forest height mapping using inventory and multi-source satellite data over Hunan Province in southern China[J]. Forest Ecosystems, 2022, 9: 100006 doi: 10.1016/j.fecs.2022.100006 [31] PHAM T D, LE N N, HA N T, et al. Estimating mangrove above-ground biomass using extreme gradient boosting decision trees algorithm with fused sentinel-2 and ALOS-2 PALSAR-2 Data in Can Gio biosphere reserve, Vietnam[J]. Remote Sensing, 2020, 12(5): 777. doi: 10.3390/rs12050777 [32] National Snow and Ice Data Center. ATL08 product data dictionary[EB/OL]. (2021-07-27)[2023-06-17]. https://icesat-2-scf.gsfc.nasa.gov [33] QUEINNEC M, WHITE J C, COOPS N C. Comparing airborne and spaceborne photon-counting LiDAR canopy structural estimates across different boreal forest types[J]. Remote Sensing of Environment, 2021, 262: 112510 doi: 10.1016/j.rse.2021.112510 [34] NEUENSCHWANDER A L, MAGRUDER L A. Canopy and terrain height retrievals with ICESat-2: a first look[J]. Remote Sensing, 2019, 11(14): 1721 doi: 10.3390/rs11141721 [35] MAGRUDER L, BRUNT K, NEUMANN T, et al. Passive ground-based optical techniques for monitoring the on-orbit ICESat-2 altimeter geolocation and footprint diameter[J]. Earth and Space Science, 2021, 8(10): e2020EA001414 doi: 10.1029/2020EA001414 [36] LUTHCKE S B, THOMAS T C, PENNINGTON T A, et al. ICESat‐2 pointing calibration and geolocation performance[J]. Earth and Space Science, 2021, 8(3): e2020EA001494 doi: 10.1029/2020EA001494 [37] LIU X Q, SU Y J, HU T Y, et al. Neural network guided interpolation for mapping canopy height of China’s forests by integrating GEDI and ICESat-2 data[J]. Remote Sensing of Environment, 2022, 269: 112844 doi: 10.1016/j.rse.2021.112844 [38] SU Y J, MA Q, GUO Q H. Fine-resolution forest tree height estimation across the Sierra Nevada through the integration of spaceborne LiDAR, airborne LiDAR, and optical imagery[J]. International Journal of Digital Earth, 2017, 10(3): 307-323 doi: 10.1080/17538947.2016.1227380 [39] ZHU X X, NIE S, WANG C, et al. Consistency analysis of forest height retrievals between GEDI and ICESat-2[J]. Remote Sensing of Environment, 2022, 281: 113244 doi: 10.1016/j.rse.2022.113244 [40] LIN S, LI Y, LI Y H, et al. Influence of tree size, local forest structure, topography, and soil resource availability on plantation growth in Qinghai Province, China[J]. Ecological Indicators, 2021, 120: 106957 doi: 10.1016/j.ecolind.2020.106957 [41] LI Y, HÄRDTLE W, BRUELHEIDE H, et al. Site and neighborhood effects on growth of tree saplings in subtropical plantations (China)[J]. Forest Ecology and Management, 2014, 327: 118-127 doi: 10.1016/j.foreco.2014.04.039 [42] LUO D, JIN Z, YU Y L, et al. Effects of topography on planted trees in a headwater catchment on the Chinese Loess Plateau[J]. Forests, 2021, 12(6): 792 doi: 10.3390/f12060792 [43] MALAMBO L, POPESCU S C. Assessing the agreement of ICESat-2 terrain and canopy height with airborne lidar over US ecozones[J]. Remote Sensing of Environment, 2021, 266: 112711 doi: 10.1016/j.rse.2021.112711 [44] DU Z R, YU L, YANG J Y, et al. A global map of planting years of plantations[J]. Scientific Data, 2022, 9(1): 141. doi: 10.1038/s41597-022-01260-2 [45] 王云霖. 我国人工林发展研究[J]. 林业资源管理, 2019(1): 6-11WANG Yunlin. Review on China’s plantation development since the reform and opening up[J]. Forest Resources Management, 2019(1): 6-11 [46] 高伟, 叶功富, 游水生, 等. 东山岛海岸带潺槁树天然林的群落结构特征[J]. 南京师大学报(自然科学版), 2011, 34(2): 94-99GAO Wei, YE Gongfu, YOU Shuisheng, et al. Community characters of coastal Litsea glutinosa natural forest on Dongshan Island[J]. Journal of Nanjing Normal University (Natural Science Edition), 2011, 34(2): 94-99 [47] 杨子铎. 湖南栎类天然林林分结构特征及其对林分生长的影响[D]. 长沙: 中南林业科技大学, 2023YANG Ziduo. Structural characteristics of natural oak forests and their effects on forest growth in Hunan Province[D]. Changsha: Central South Unversity of Forestry & Technology, 2023 -
-

 下载:
下载:


计量
- 文章访问数: 2273
- HTML全文浏览量: 653
- PDF下载量: 131
-
被引次数:
0(来源:Crossref)
0(来源:其他)

