Satellite Remote Sensing of Total Suspended Matter Concentration in Hangzhou Bay and Its Adjacent Waters
-
摘要: 近海及海湾总悬浮物是重要的水质参数之一,而杭州湾及其邻近海域是典型的海湾与近岸海域,与人类关系密切。卫星遥感广泛应用于海水总悬浮物浓度的探测与分析。利用现场实测数据,建立了中国HY-1C/D卫星水色水温扫描仪(Chinese Ocean Color and Temperature Scanner, COCTS)及其他当前在轨的典型水色遥感器在杭州湾及邻近海域的总悬浮物卫星遥感反演方法模型,模型平均相对误差不高于19%。反演并融合获得了HY-1C/D等多源卫星2015-2022年杭州湾及邻近海域的总悬浮物浓度卫星遥感及其融合数据。融合数据经实测数据对比验证,两者之间线性相关系数为0.72,平均相对偏差为26%。卫星遥感结果表明,2015-2022年间杭州湾及其邻近海域总悬浮物浓度年际变化不大,其线性变化不超过其年平均浓度值的0.5%。研究结果表明利用包括HY-1C/D卫星COCTS等的海洋水色遥感载荷,可有效遥感反演得到杭州湾及其邻近海域的总悬浮物浓度并分析其时空变化特征。Abstract: The Total Suspended Matter (TSM) in the coastal water area and sea bays is one of the important water quality parameters, and Hangzhou Bay and its adjacent waters are typical gulfs and offshore waters with close relationships with humans. Satellite remote sensing is widely used for monitoring and analyzing the concentration of total suspended matter in seawater. Satellite remote sensing retrieval models of TSM concentration for Chinese Ocean Color and Temperature Scanner (COCTS) on the HY-1C and HY-1D satellites and other typical ocean color remote sensors currently in orbit in Hangzhou Bay and its adjacent waters were developed using in-situ measured data. The average relative errors of the models are not greater than 19%. TSM concentration in Hangzhou Bay and adjacent waters from 2015 to 2022 was retrieved and merged from multi-source satellite data including HY-1C/D. The merged products in this study have been validated against in-situ measured data with the linear correlation coefficient of 0.72 and an average relative error of 26%. The results indicate that the inter-annual variation of the TSM concentration in Hangzhou Bay and its adjacent waters is not significant in the period from January 2015 to December 2022, and its linear variation does not exceed 0.5% of its annual average concentration value. The results of the study indicate that the TSM concentration and its temporal and spatially variation characteristics in Hangzhou Bay and its adjacent waters can be effectively retrieved from space broad ocean color remote sensing payloads including COCTS on the HY-1C/D satellites.
-
Key words:
- Hangzhou Bay /
- Total suspended matter concentration /
- HY-1C/D satellites /
- Remote sensing
-
表 1 卫星数据源信息
Table 1. Satellite data source information used in this study
序号 传感器/卫星 幅宽/ km 空间分辨率/m 时间分辨率/d–1 在轨时间范围(年月) 1 COCTS/HY-1C,HY-1D 3000 1100 2 2018.09-(HY-1C)
2020.06-(HY-1D)2 GOCI/COMS 2500 250 8 2010.06- 3 VIIRS/SNPP,JPSS-1 3000 750 2 2011.10-(SNPP)
2017.11-(JPSS-1)4 MODIS/Terra,Aqua 2330 1000 2 1999.12-(Terra)
2002.05-(Aqua)表 2 杭州湾及其邻近海域TSM浓度遥感反演模型各传感器波段选择信息
Table 2. Bands selection information of various sensors for the retrieval models of TSM concentration in Hangzhou Bay and its adjacent waters
传感器 $ \lambda _{\rm{B}} $/nm $ \lambda _{\rm{G}} $/nm $ \lambda _{\rm{R}} $/nm COCTS 490 565 670 MODIS 488 551 667 VIIRS/SNPP 486 551 671 VIIRS/JPSS-1 489 556 667 GOCI 490 560 665 表 3 杭州湾及其邻近海域TSM浓度遥感反演模型公式系数及其建模效果评价结果信息
Table 3. The formula coefficients and modeling evaluation indicators of TSM concentration remote sensing retrieval models in Hangzhou Bay and its adjacent waters
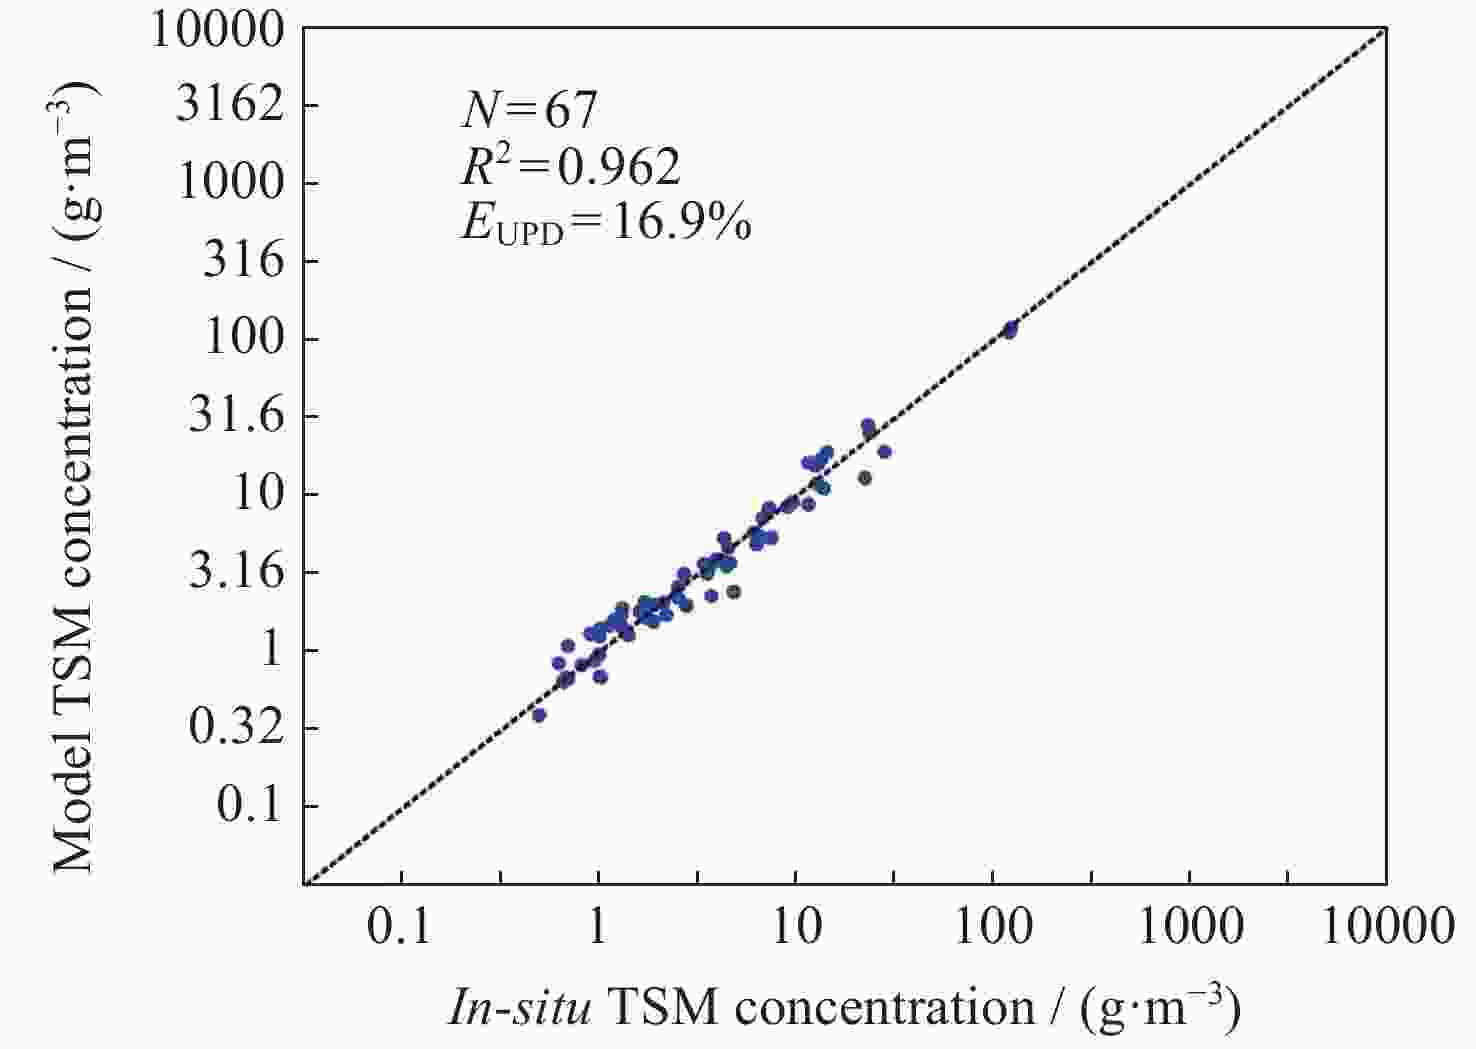
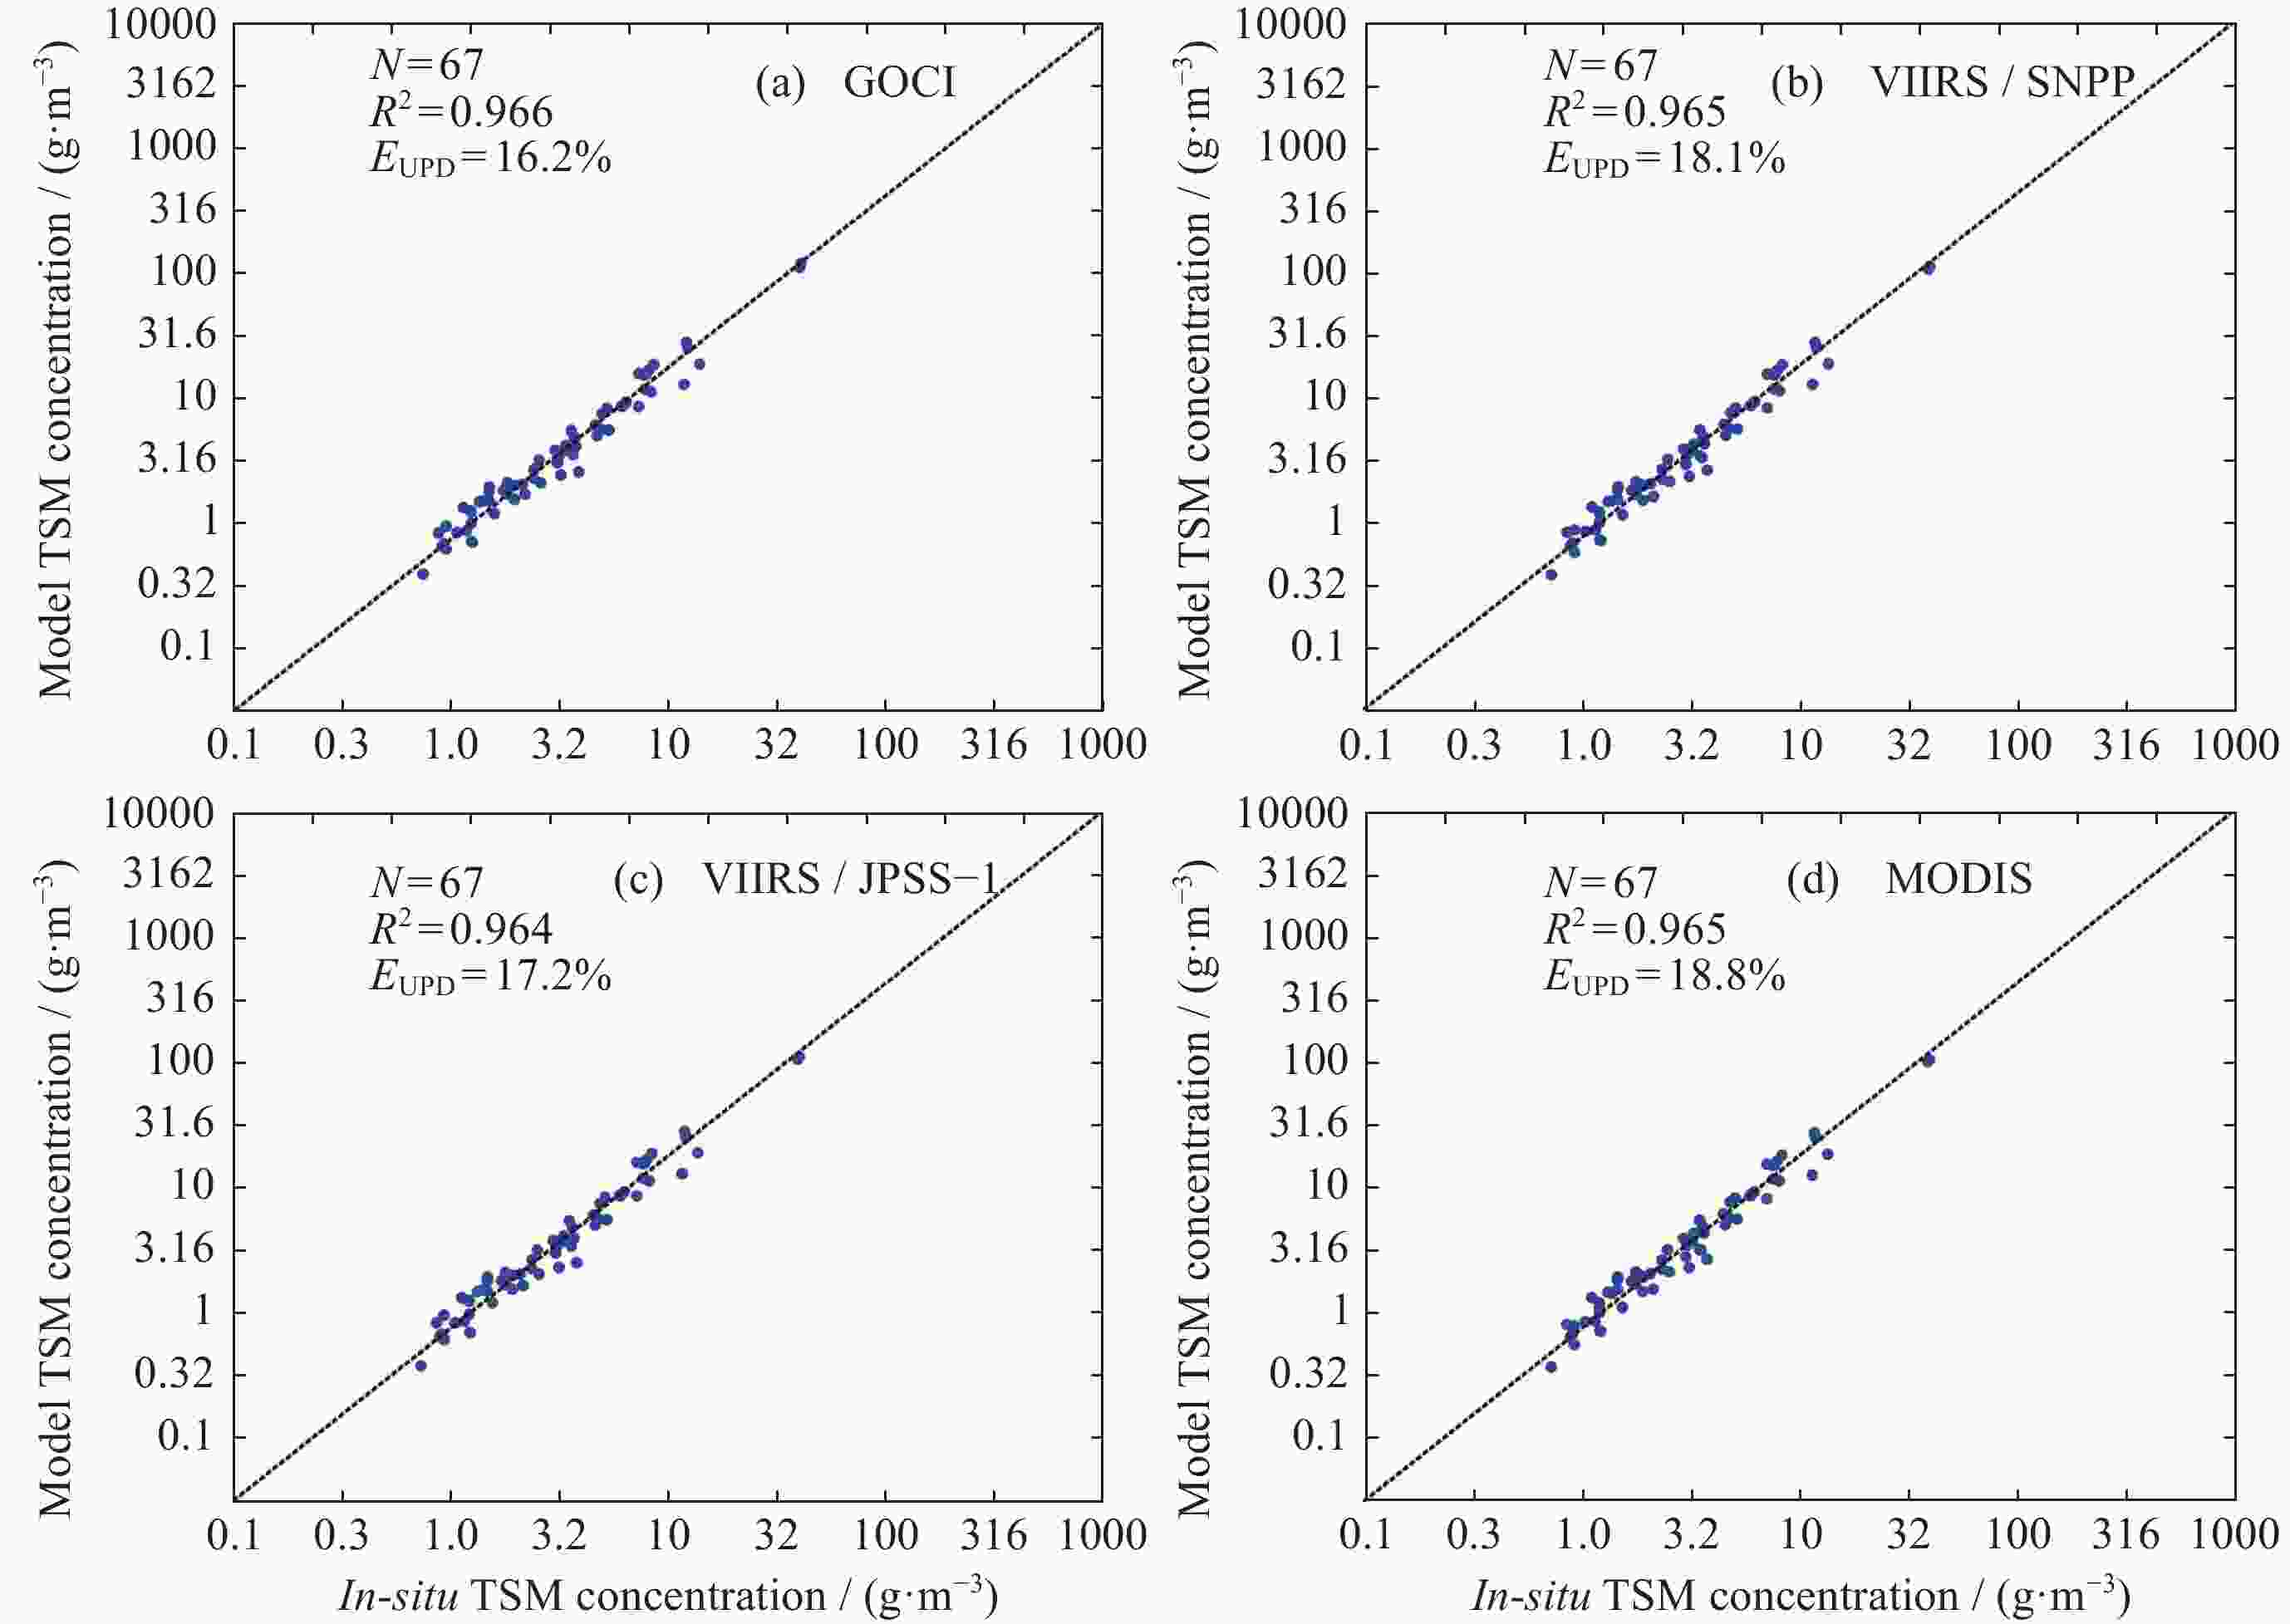
传感器 b0 b1 b2 相关系数${R^2}$ 平均相对误差/(%) COCTS 0.42080 22.79800 –0.33329 0.962 16.90 MODIS 0.60253 24.40700 –0.55732 0.965 18.80 VIIRS/SNPP 0.55215 24.25332 –0.50701 0.965 18.10 VIIRS/JPSS-1 0.49413 23.46630 –0.43409 0.964 17.20 GOCI 0.49282 24.08773 –0.43924 0.966 16.20 表 4 TSM浓度变化分析站点位置信息
Table 4. Location information of the sites for TSM concentration variation analysis
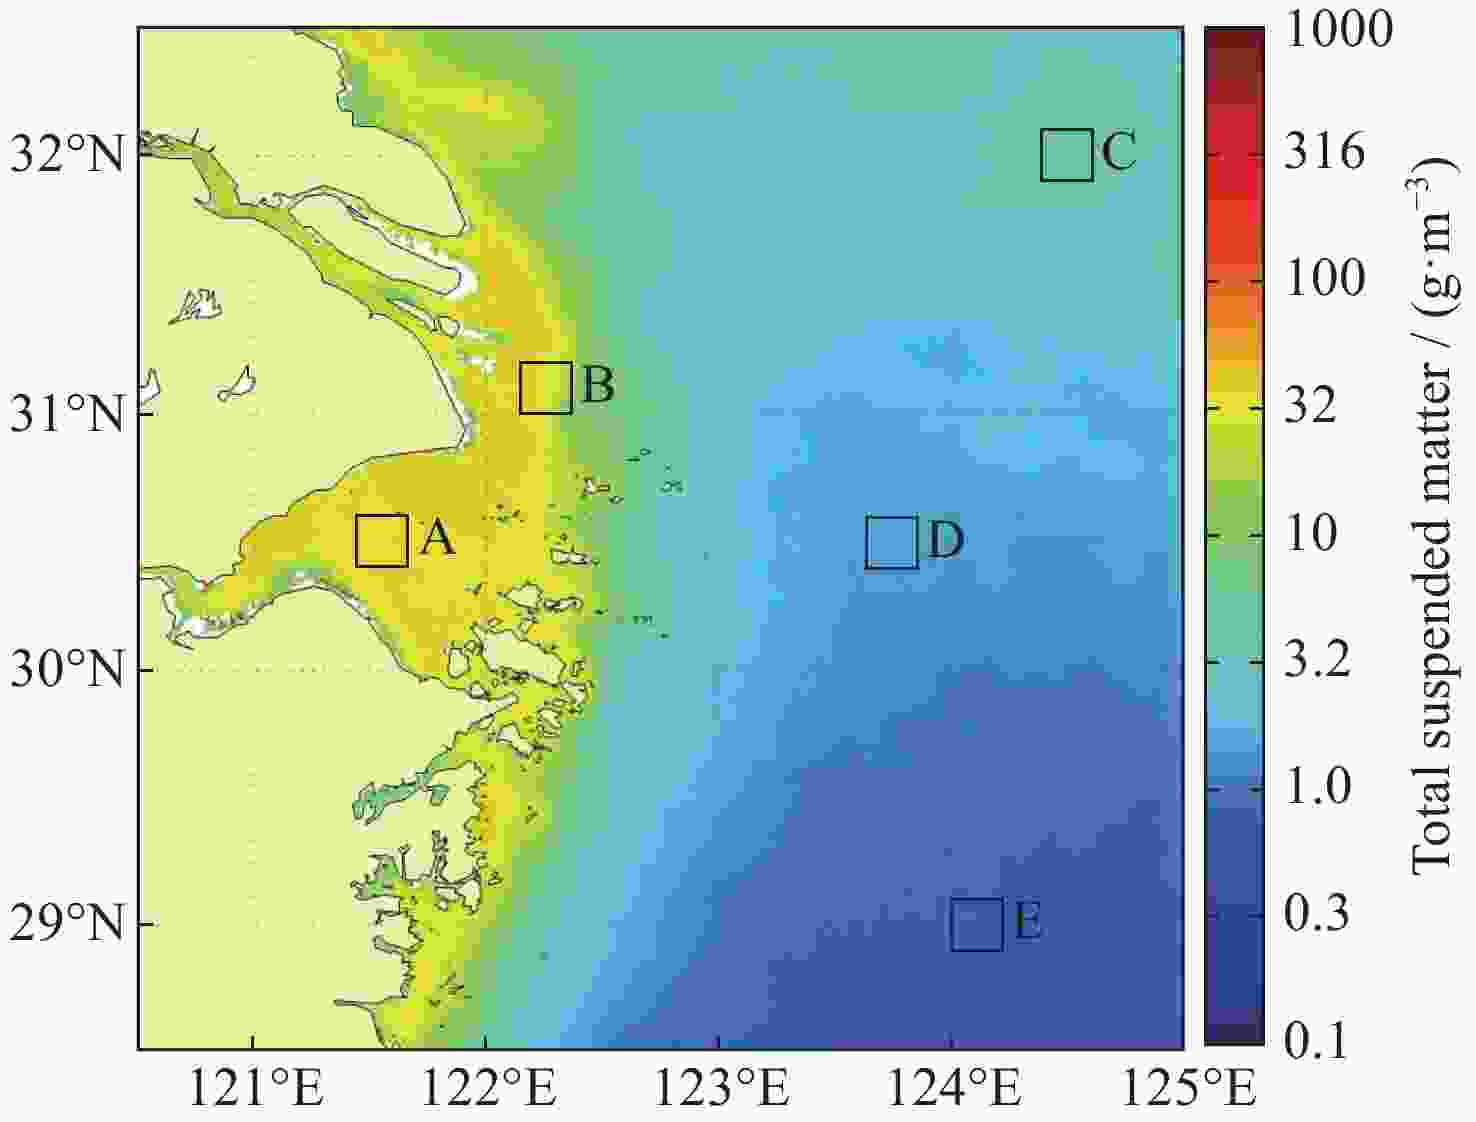
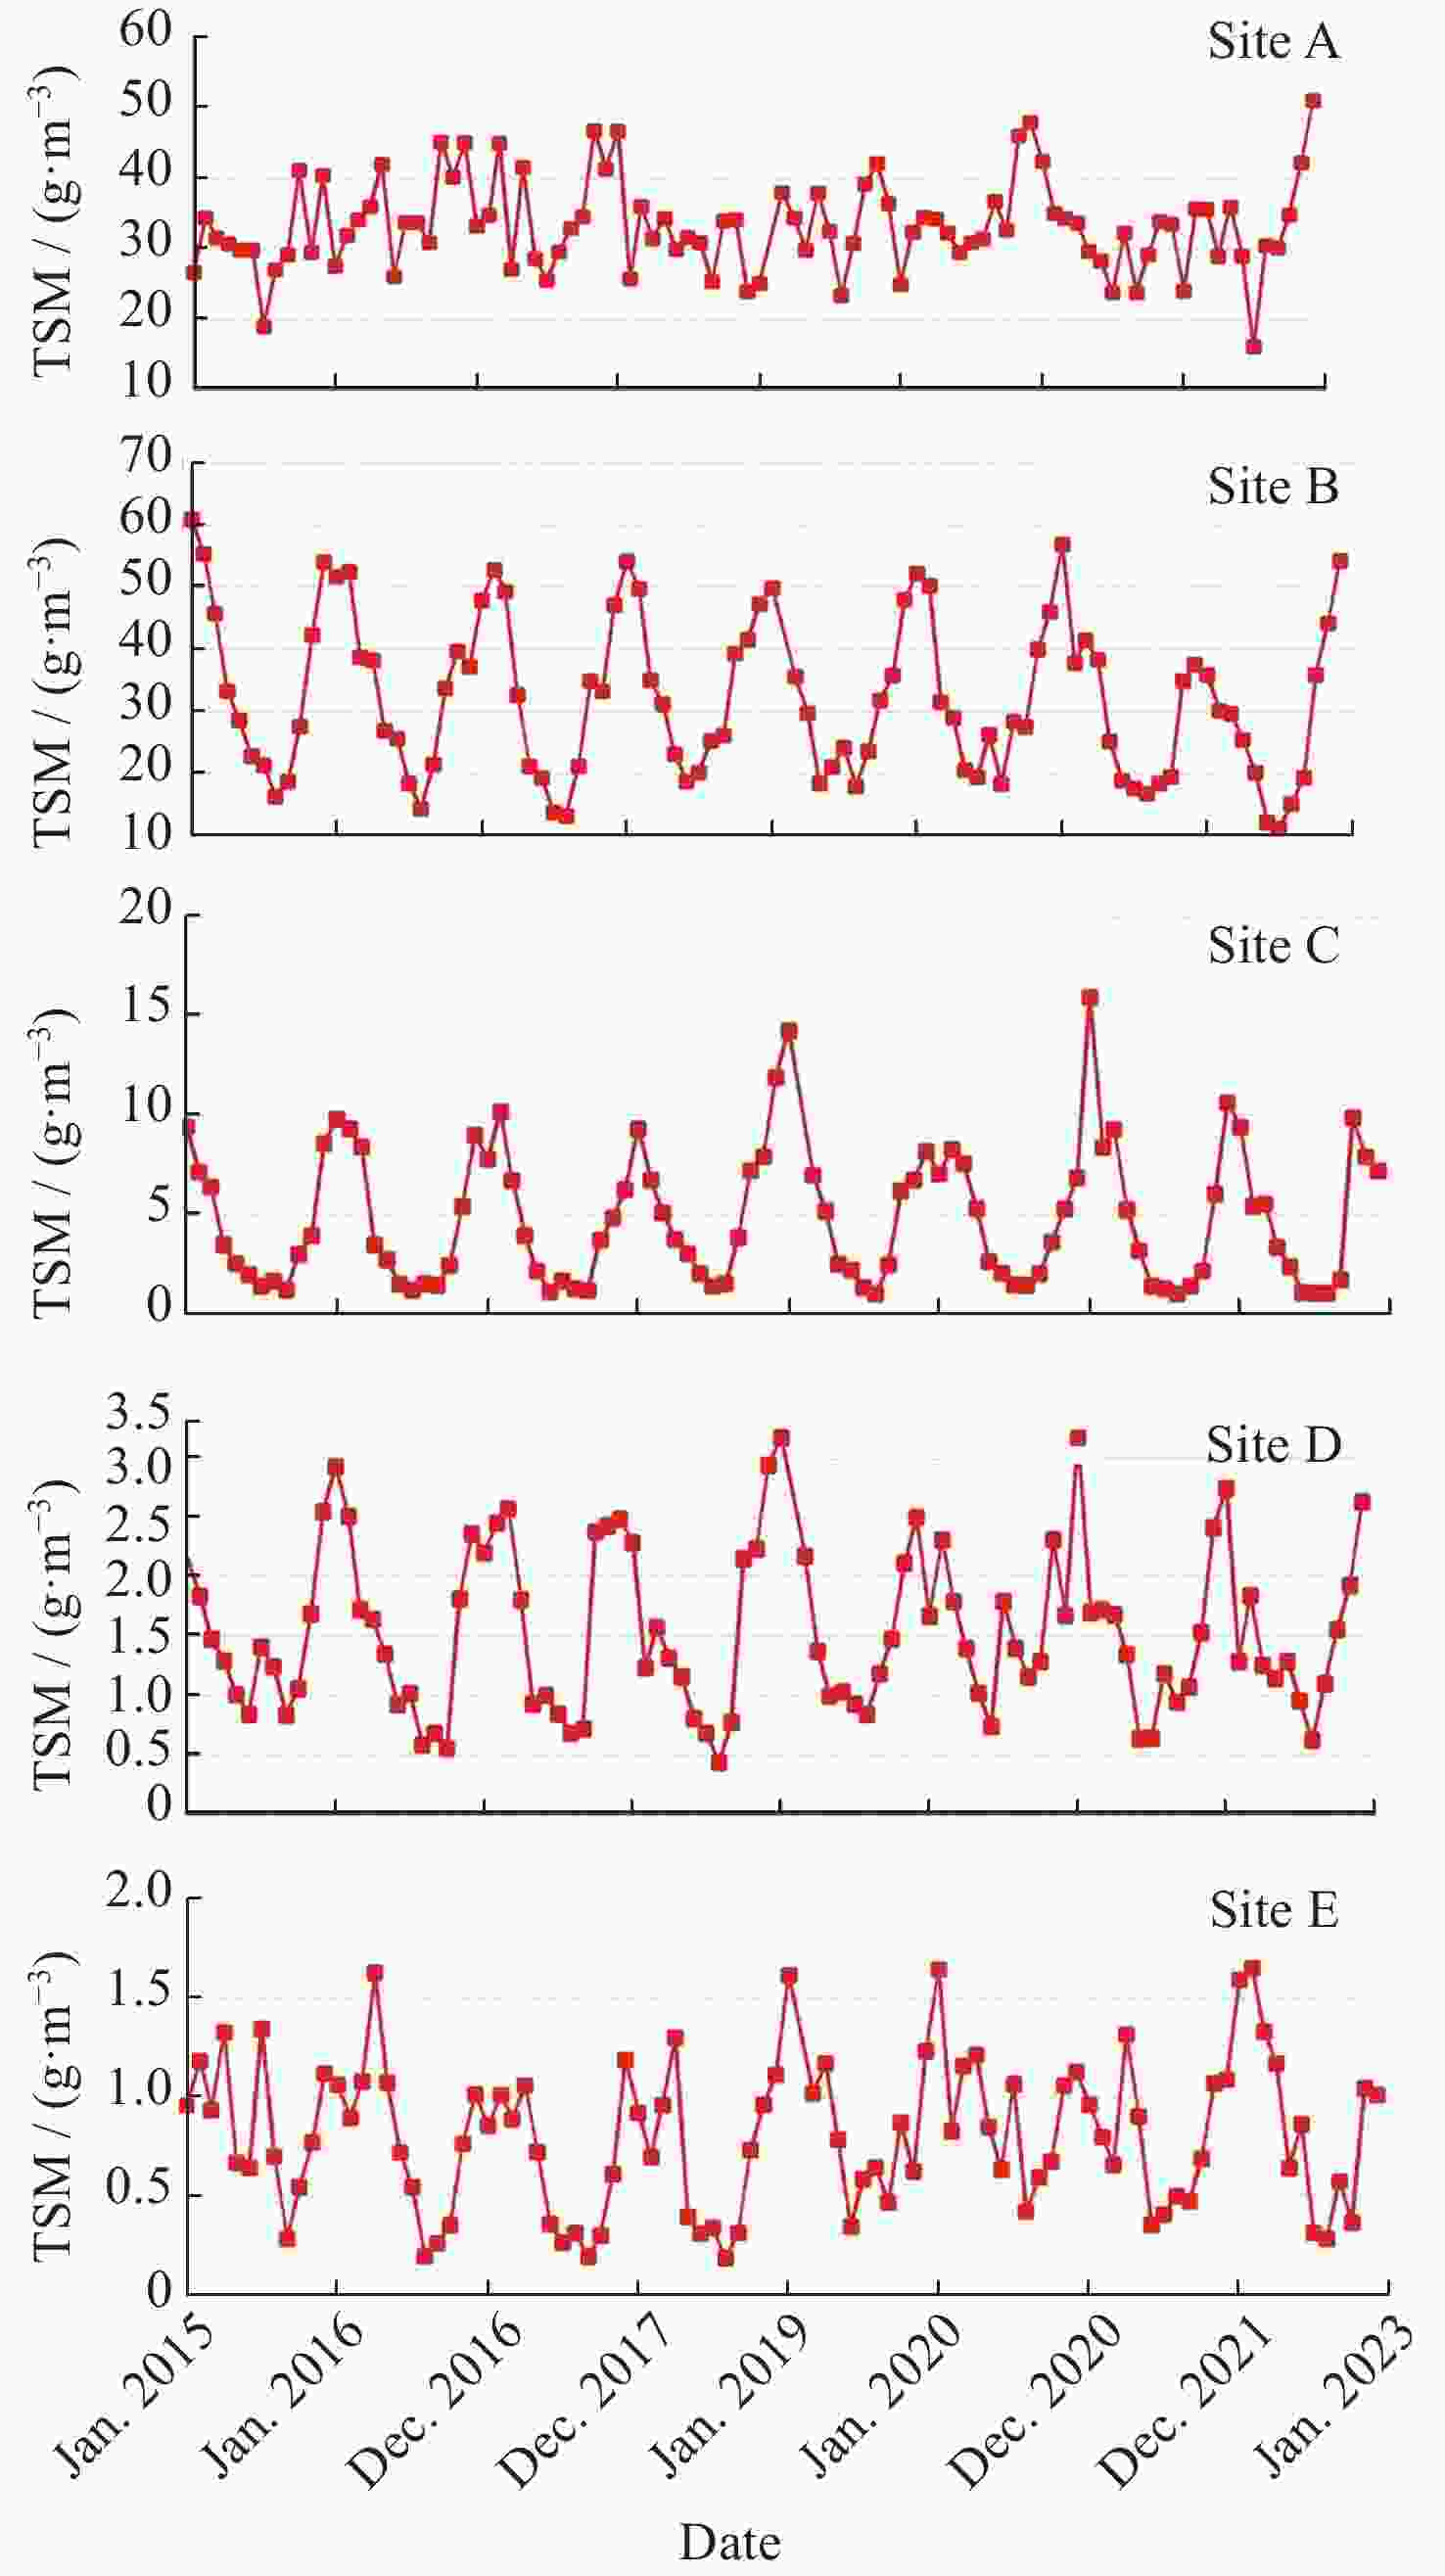
站位 A B C D E 位置 30.50°N, 121.55°E 31.10°N, 122.25°E 32.00°N, 124.50°E 30.50°N, 123.75°E 29.00°N, 124.10°E -
[1] TASSAN S, D'ALCALÁ M R. Water quality monitoring by thematic mapper in coastal environments. A performance analysis of local biooptical algorithms and atmospheric correction procedures[J]. Remote Sensing of Environment, 1993, 45(2): 177-191 doi: 10.1016/0034-4257(93)90041-U [2] TASSAN S. Local algorithms using SeaWiFS data for the retrieval of phytoplankton, pigments, suspended sediment, and yellow substance in coastal waters[J]. Applied Optics, 1994, 33(12): 2369-2378 doi: 10.1364/AO.33.002369 [3] RUDDICK K G, OVIDIO F, RIJKEBOER M. Atmospheric correction of SeaWiFS imagery for turbid coastal and inland waters[J]. Applied Optics, 2000, 39(6): 897-912 doi: 10.1364/AO.39.000897 [4] HE M X, LIU Z S, DU K P, et al. Retrieval of chlorophyll from remote-sensing reflectance in the China seas[J]. Applied Optics, 2000, 39(15): 2467-2474 doi: 10.1364/AO.39.002467 [5] 唐军武, 王晓梅, 宋庆君, 等. 黄、东海二类水体水色要素的统计反演模式[J]. 海洋科学进展, 2004, 22(增刊): 1-7 doi: 10.3969/j.issn.1671-6647.2004.z1.001TANG Junwu, WANG Xiaomei, SONG Qingjun, et al. Statistical inversion models for case II water color elements in the Yellow Sea and East China Sea[J]. Advances in Marine Science, 2004, 22(Suppl.): 1-7 doi: 10.3969/j.issn.1671-6647.2004.z1.001 [6] 马超飞, 蒋兴伟, 唐军武, 等. HY-1 CCD宽波段水色要素反演算法[J]. 海洋学报, 2005, 27(4): 38-44 doi: 10.3321/j.issn:0253-4193.2005.04.005MA Chaofei, JIANG Xingwei, TANG Junwu, et al. Inverse algorithms of ocean constituents for HY-1/CCD broadband data[J]. Acta Oceanologica Sinica, 2005, 27(4): 38-44 doi: 10.3321/j.issn:0253-4193.2005.04.005 [7] HE X Q, PAN D L, MAO Z H. Atmospheric correction of SeaWiFS imagery for turbid coastal and inland waters[J]. Acta Oceanologica Sinica, 2004, 23(4): 609-615 [8] HE X Q, BAI Y, PAN D L, et al. Atmospheric correction of satellite ocean color imagery using the ultraviolet wavelength for highly turbid waters[J]. Optics Express, 2012, 20(18): 20754-2077 doi: 10.1364/OE.20.020754 [9] HE X Q, BAI Y, PAN D L, et al. Using geostationary satellite ocean color data to map the diurnal dynamics of suspended particulate matter in coastal waters[J]. Remote Sensing of Environment, 2013, 133: 225-239 doi: 10.1016/j.rse.2013.01.023 [10] ZHANG M W, TANG J W, DONG Q, et al. Retrieval of total suspended matter concentration in the Yellow and East China Seas from MODIS imagery[J]. Remote Sensing of Environment, 2010, 114(2): 392-403 doi: 10.1016/j.rse.2009.09.016 [11] MOLKOV A A, FEDOROV S V, PELEVIN V V, et al. Regional models for high-resolution retrieval of chlorophyll a and TSM concentrations in the Gorky reservoir by Sentinel-2 imagery[J]. Remote Sensing, 2019, 11(10): 1215 doi: 10.3390/rs11101215 [12] 江彬彬, 张霄宇, 杜泳, 等. 基于GOCI的近岸高浓度悬浮泥沙遥感反演——以杭州湾及邻近海域为例[J]. 浙江大学学报(理学版), 2015, 42(2): 220-227 doi: 10.3785/j.issn.1008-9497.2015.02.017JIANG Binbin, ZHANG Xiaoyu, DU Yong, et al. Retrieving high concentration of suspended sediments based on GOCI: An example of coastal water around Hangzhou Bay, China[J]. Journal of Zhejiang University (Science Edition), 2015, 42(2): 220-227 doi: 10.3785/j.issn.1008-9497.2015.02.017 [13] 李渊, 郭宇龙, 程春梅, 等. 基于OLCI数据的杭州湾悬浮物浓度估算及其产品适用性分析[J]. 海洋学报, 2019, 41(9): 156-169 doi: 10.3969/j.issn.0253-4193.2019.09.015LI Yuan, GUO Yulong, CHENG Chunmei, et al. Remote estimation of total suspended matter concentration in the Hangzhou Bay based on OLCI and its water color product applicability analysis[J]. Haiyang Xuebao, 2019, 41(9): 156-169 doi: 10.3969/j.issn.0253-4193.2019.09.015 [14] 程乾, 刘波, 李婷, 等. 基于高分1号杭州湾河口悬浮泥沙浓度遥感反演模型构建及应用[J]. 海洋环境科学, 2015, 34(4): 558-563,577 doi: 10.13634/j.cnki.mes.2015.04.015CHENG Qian, LIU Bo, LI Ting, et al. Research on remote sensing retrieval of suspended sediment concentration in Hangzhou Bay by GF-1 satellite[J]. Marine Environmental Science, 2015, 34(4): 558-563,577 doi: 10.13634/j.cnki.mes.2015.04.015 [15] 邵宇杰, 胡越凯, 周斌, 等. 基于GF-4卫星的杭州湾悬浮泥沙浓度遥感监测研究[J]. 海洋学报, 2020, 42(9): 134-142 doi: CNKI:SUN:SEAC.0.2020-09-014SHAO Yujie, HU Yuekai, ZHOU Bin, et al. Remote sensing monitoring of suspended sediment concentration based on GF-4 satellite in the Hangzhou Bay[J]. Haiyang Xuebao, 2020, 42(9): 134-142 doi: CNKI:SUN:SEAC.0.2020-09-014 [16] YE X M, LIU J Q, LIN M S, et al. Sea surface temperatures derived from COCTS onboard the HY-1C satellite[J]. IEEE Journal of Selected Topics in Applied Earth Observations and Remote Sensing , 2021, 14 : 1038-1047. DOI: 10.1109/JSTARS.2020.3033317 [17] YE X M, LIU J Q, LIN M S, et al. Global ocean Chlorophyll-a concentrations derived from COCTS onboard the HY-1C satellite and their preliminary evaluation[J]. IEEE Transactions on Geoscience and Remote Sensing, 2021, 59(12): 9914-9926 doi: 10.1109/TGRS.2020.3036963 [18] YE X M, LIU J Q, LIN M S, et al. Evaluation of sea surface temperatures derived from the HY-1D satellite[J]. IEEE Journal of Selected Topics in Applied Earth Observations and Remote Sensing, 2022, 15: 654-665 doi: 10.1109/JSTARS.2021.3137230 [19] CAI L N, ZHOU M R, LIU J Q, et al. HY-1C observations of the impacts of islands on suspended sediment distribution in Zhoushan coastal waters, China[J]. Remote Sensing, 2020, 12(11): 1766 doi: 10.3390/rs12111766 [20] 禹定峰, 周燕, 马万栋, 等. 基于HICO模拟数据的杭州湾水体悬浮物浓度遥感反演[J]. 国土资源遥感, 2018, 30(4): 171-175YU Dingfeng, ZHOU Yan, MA Wandong, et al. Retrieval of total suspended matter concentration in Hangzhou Bay based on simulated HICO from in situ hyperspectral data[J]. Remote Sensing for Land and Resources, 2018, 30(4): 171-175 [21] MÉLIN F, CHUPRIN A, GRANT M, et al. Ocean Colour Data Bias Correction and Merging, Algorithm Theoretical Baseline Document of Ocean Colour Climate Change Initiative (OC_CCI) – Phase Two[OL], April 2016, Issue: 3.7, ESA / ESRIN. https://docs.pml.space/share/s/2RVhiuK2SWyhbSthqDDoxg) -
-


 下载:
下载:
