


基于隐空间插值自编码器的卫星遥测参数异常检测
doi: 10.11728/cjss2024.06.2023-0147 cstr: 32142.14.cjss.2023-0147
-
 周台春 男, 1999年2月生于湖北黄冈, 中国科学院国家空间科学中心计算机应用技术专业硕士研究生, 主要研究方向为大数据处理分析技术、遥测参数异常检测和凸函数不等式及其应用等. E-mail: taichunzhou@163.com
 -
 肖志刚 男, 1976年9月生于河南周口, 中国科学院国家空间科学中心副研究员, 硕士生导师, 主要研究方向为卫星智能运控技术、大数据处理分析技术和卫星载荷健康管理技术等. E-mail: xiaozhigang@nssc.ac.cn
作者简介:
通讯作者:
Anomaly Detection of Satellite Telemetry Data Based on Latent Space Interpolation Autoencoder
-
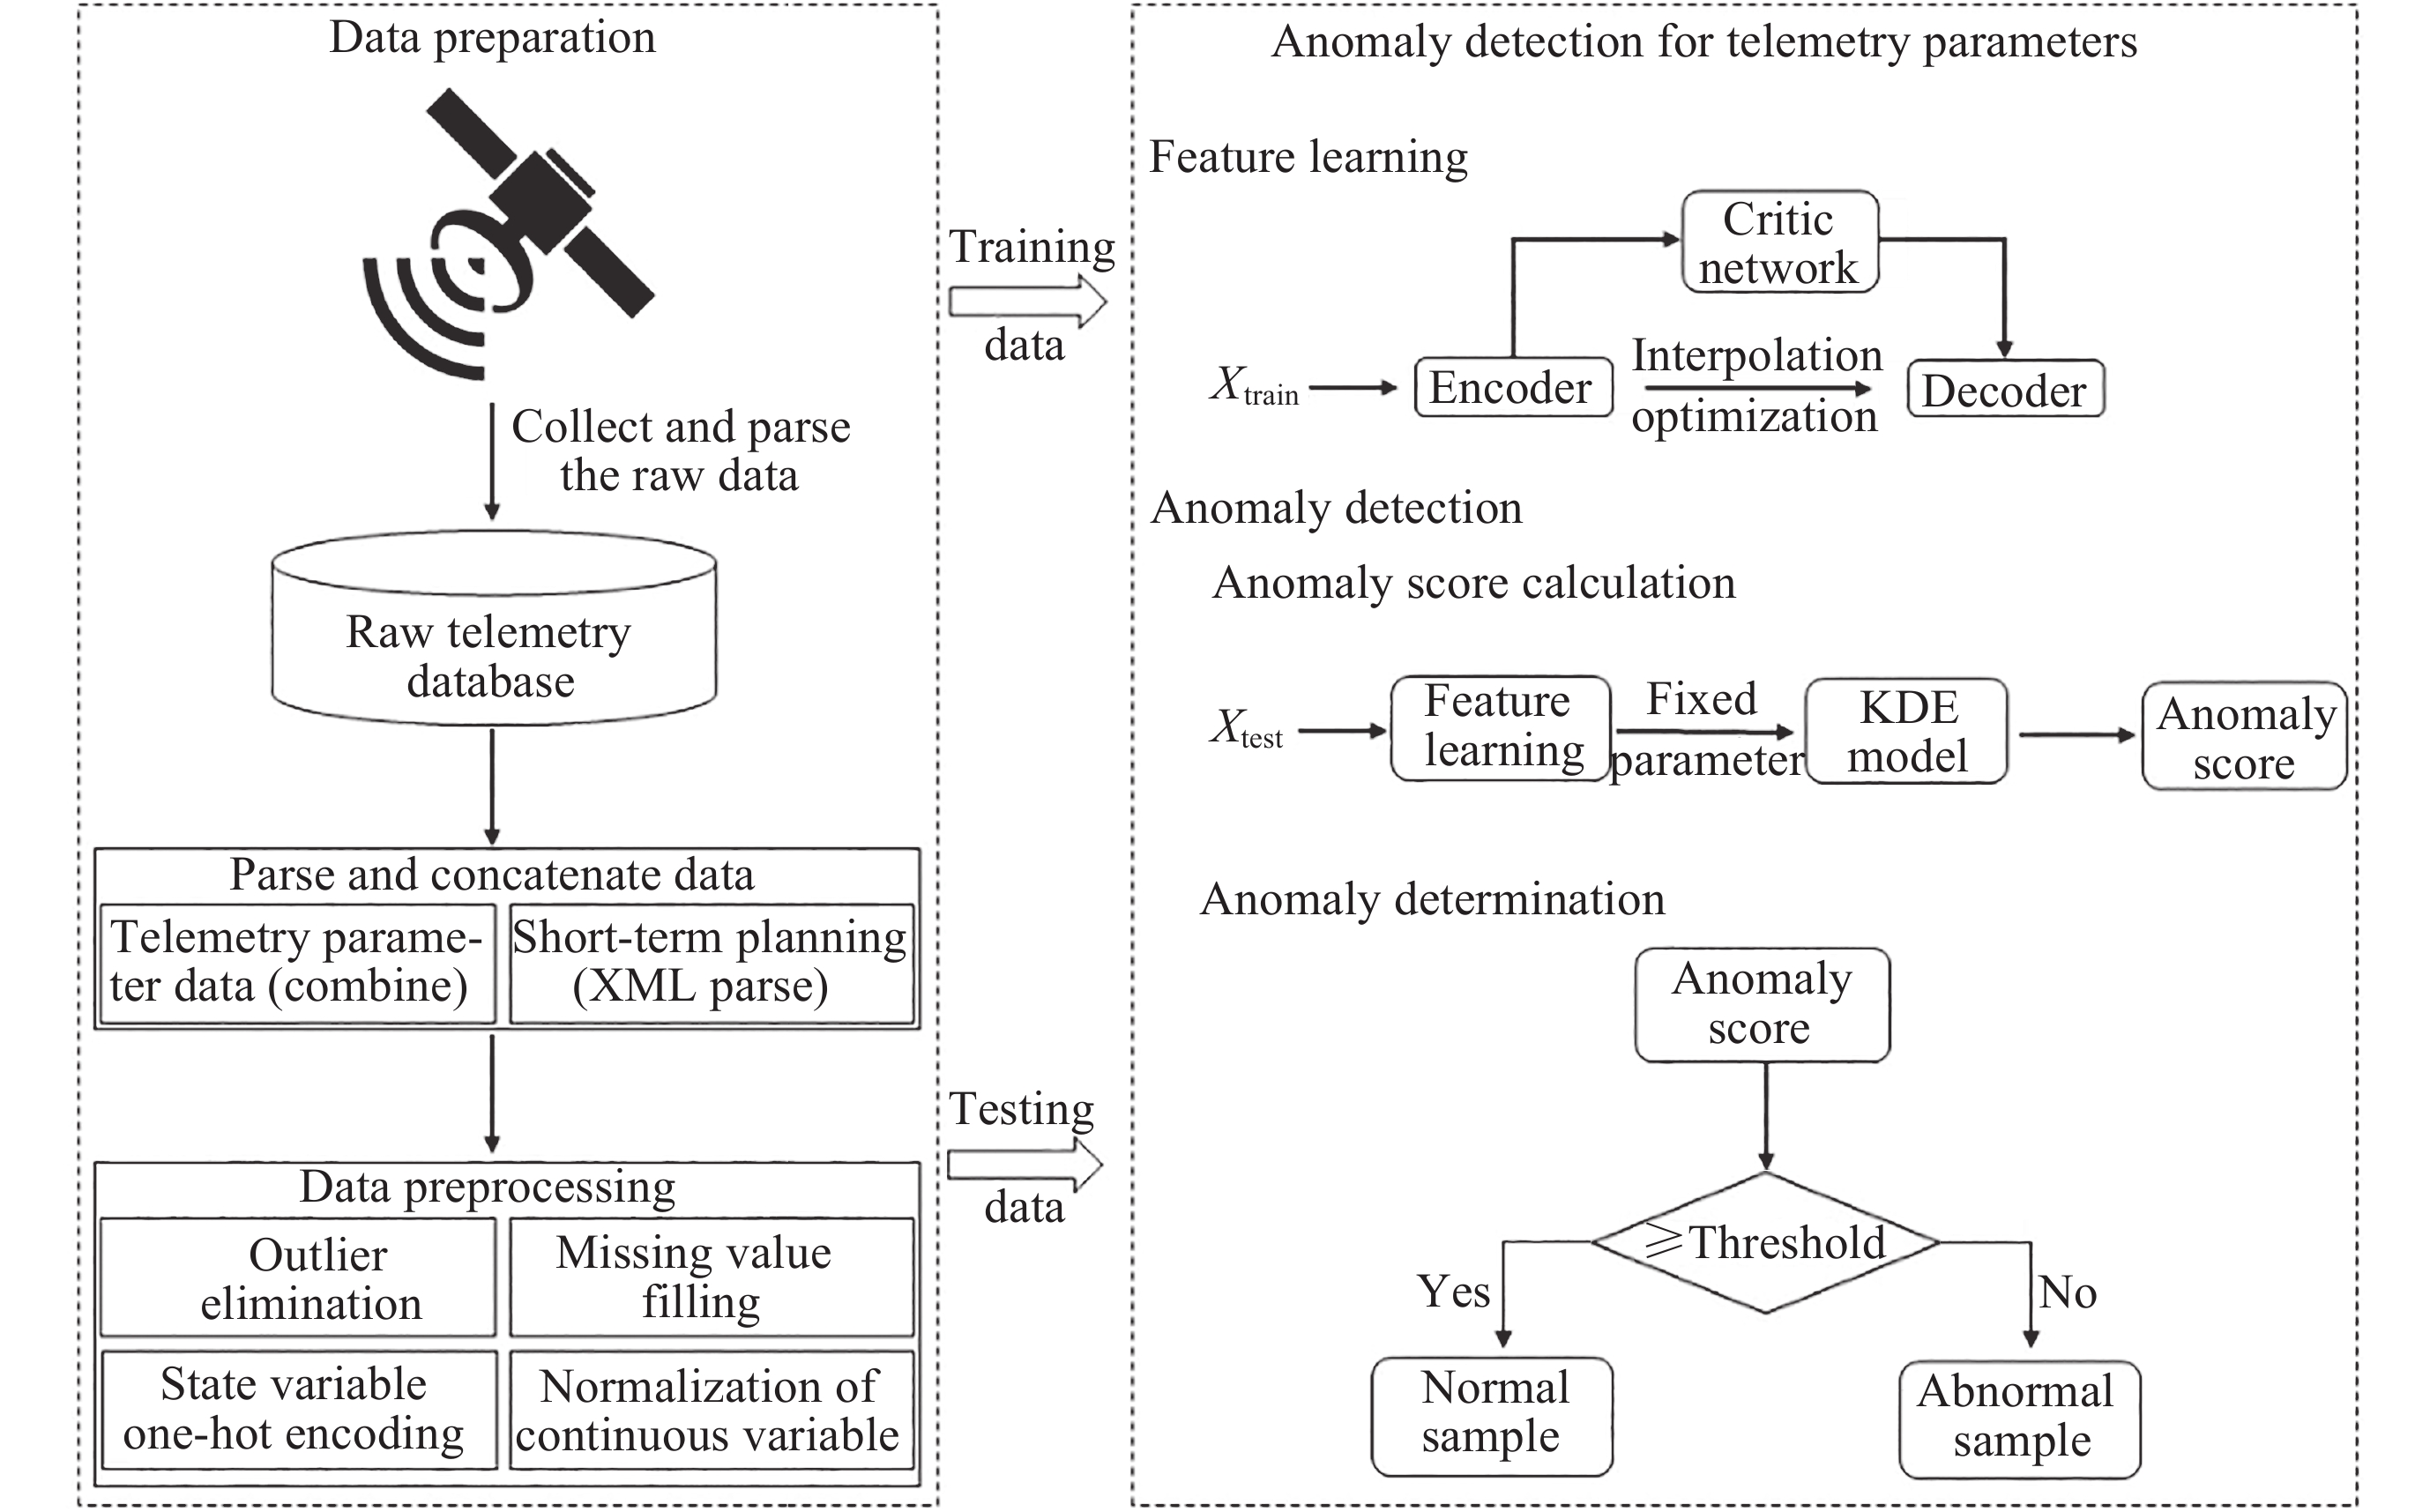
摘要: 卫星遥测参数是地面运管系统评估卫星在轨运行正常状态的关键指标, 遥测参数异常检测对于保障卫星安全可靠运行和任务顺利执行至关重要. 针对现有卫星遥测异常检测算法对参数特征提取存在区分度缺乏、有效异常决策信息提取不充分等问题, 本文提出一种基于隐空间插值优化的异常检测方法, 将隐空间优化约束后的自编码器的表示学习能力与核密度估计方法的密度估计能力相结合, 有效地进行异常检测. 采用量子科学卫星的真实遥测参数数据和公开数据集进行验证, 其结果表明所提方法在真实遥测参数上比最优对比方法的Auc值和F1值分别提升了5.6%和5.8%. 与其他异常检测算法相比, 该方法有较强的正常和异常样本辨别能力, 有效解决了特征缺乏区分性以及决策信息提取不充分的问题, 同时具有良好的噪声抗干扰性和有效性.Abstract: Satellite telemetry parameters are the critical indicators for the ground operation and management system to assess the normal state of satellite operation in orbit, and anomaly detection of telemetry parameters is essential to guarantee the safe and reliable operation of satellites and the smooth execution of tasks. In response to the existing satellite telemetry anomaly detection algorithms for parameter feature extraction there is a lack of differentiation, effective anomaly decision-making information is not sufficiently extracted and other problems, this paper proposes an anomaly detection method based on the optimization of latent space interpolation, the latent space optimization constraints after the self-coder’s representation learning ability and the density estimation ability of the Kernel Density Estimation (KDE) method are combined to effectively carry out the anomaly detection. Real telemetry parameter data from quantum science satellites and public datasets are used for validation, and the results show that the proposed method improves the Auc and F1 values over the optimal comparison method by 5.6% and 5.8%, respectively, on real telemetry parameters. Compared with other anomaly detection algorithms, the proposed method has strong ability to discriminate normal and abnormal samples, effectively solves the problems of lack of differentiation of features and insufficient extraction of decision information, and has good noise immunity and effectiveness.
-

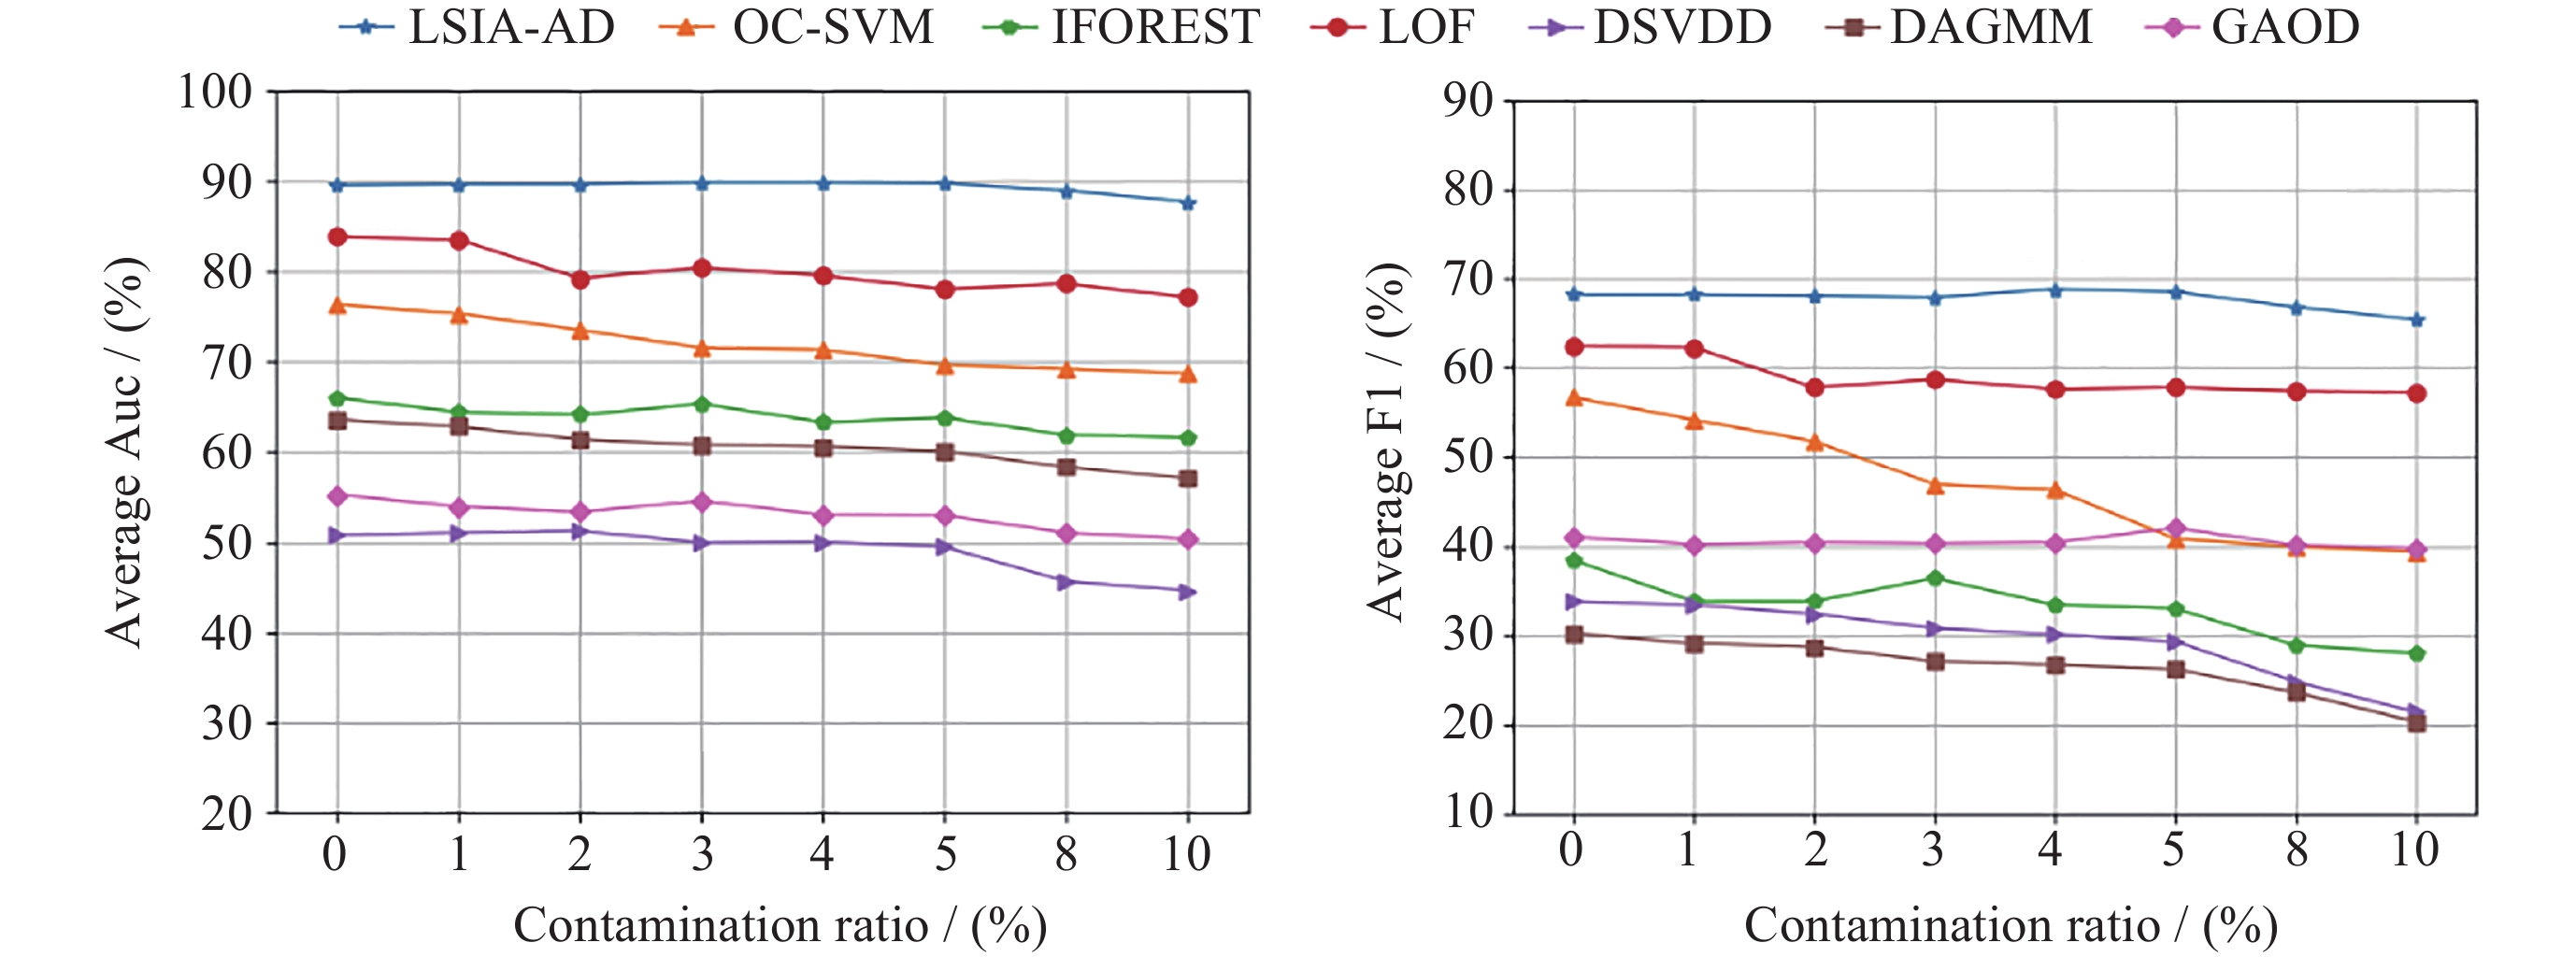
图 3 在Micius数据集上添加不同污染比例数据的异常检测结果
Figure 3. Anomaly detection results on contaminated training data on the Micius dataset
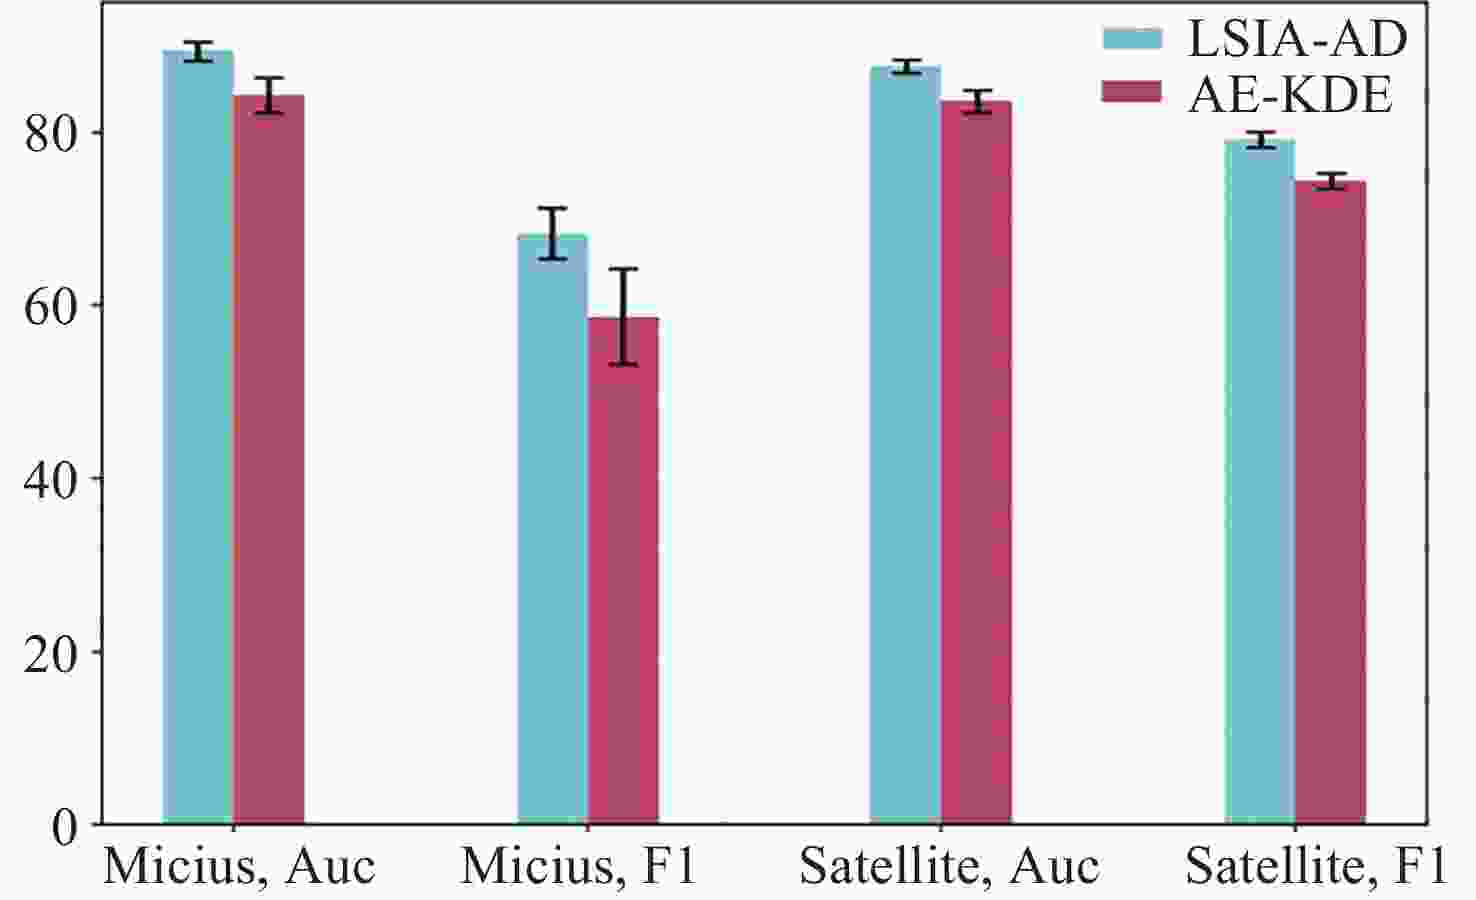
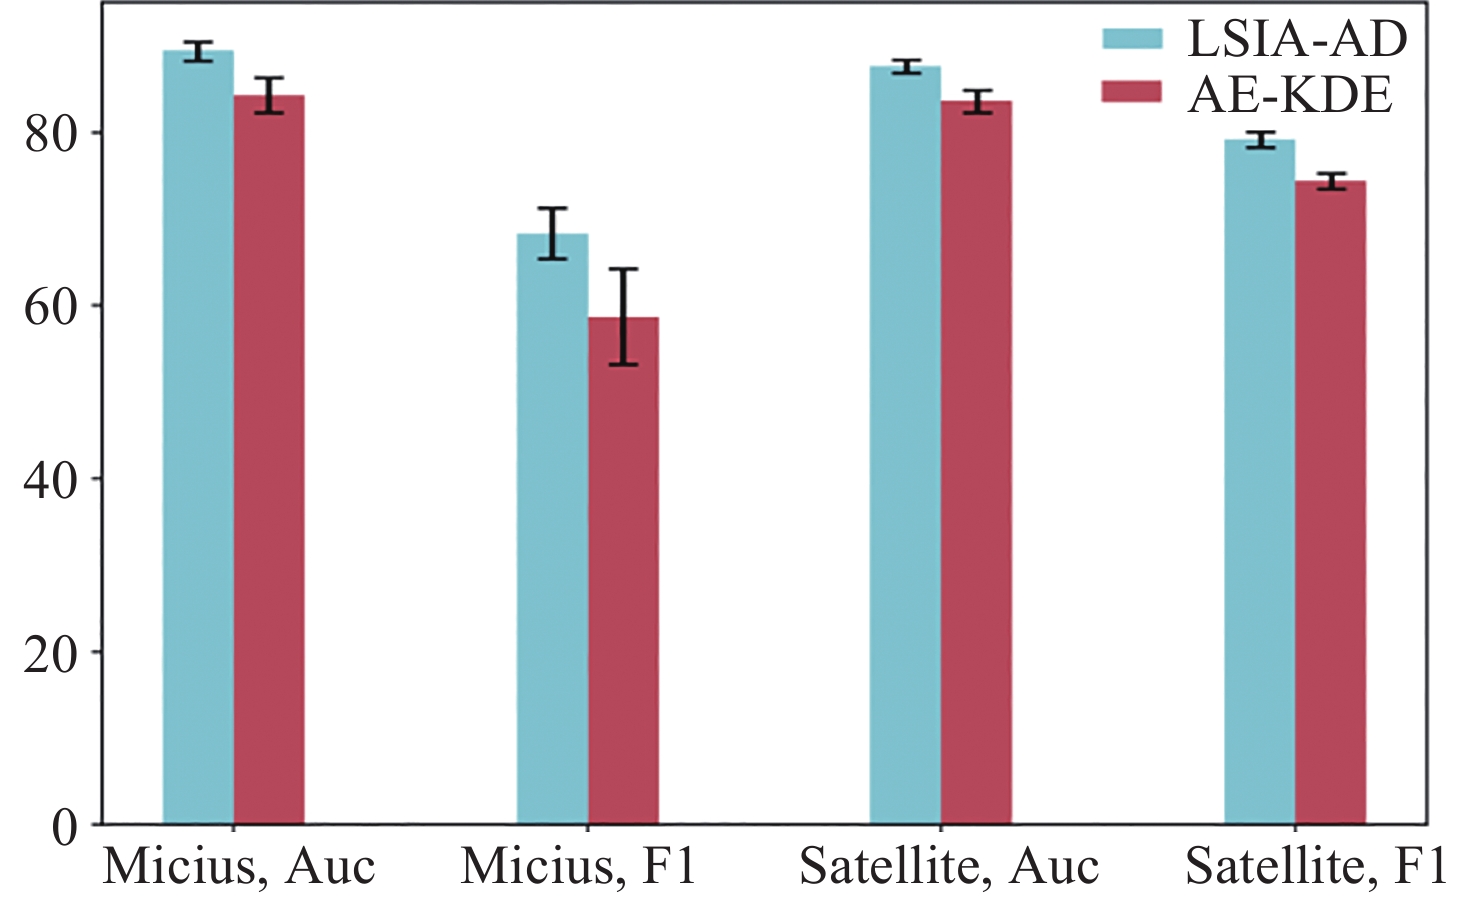
图 4 隐空间插值对LSIA-AD算法Auc和F1的影响
Figure 4. Impact of latent space interpolation on Auc and F1 of LSIA-AD algorithm
表 1 解析出的原始遥测数据
Table 1. Parsed raw telemetry data
Time (UT) P0x1356WW68 P0x1060WW9 P0x1060WW7 $ \cdots $ P0x1060WW123 7 Jan. 2017 01:03 10.45200062 –51.59808349 –0.23409990 $ \cdots $ –1.05939996 01:07 10.45200062 –46.31356811 –0.20004299 $ \cdots $ –0.47624000 01:10 1.24800002 –32.03112792 –0.00009200 $ \cdots $ 0.34847998 $ \vdots $ $ \vdots $ $ \vdots $ $ \vdots $ $ \vdots $ $ \vdots $ $ \vdots $ 28 Feb. 2019 01:39 0.312000006 32.17395019 –0.137237995 $ \cdots $ 1.004840016 01:40 0.156000003 30.81161499 –0.075713999 $ \cdots $ 0.819400012 01:41 0.312000006 29.042785644 –0.04183999 $ \cdots $ 0.641279995  下载: 导出CSV
表 2 对实验类型数据的提取和编码
Table 2. Extraction and coding of experimental type data
Start time (UT) End time (UT) Experiment type Label experiment 7 Jan. 2017 00:11 7 Jan. 2017 00:44 星地量子纠缠分发 3 01:44 7 Jan. 2017 03:09 地星量子隐形传态 1 23:45 8 Jan. 2017 01:10 星地量子密钥分发 2 $ \vdots $ $ \vdots $ $ \vdots $ $ \vdots $ $ \vdots $ $ \vdots $ 23 Jan. 2019 01:34 23 Jan. 2019 02:59 星地量子纠缠分发 3 23:36 24 Jan. 2019 01:01 星地量子纠缠分发 3 23 Jan. 2019 23:16 25 Jan. 2019 00:41 星地量子密钥分发 2 $ \vdots $ $ \vdots $ $ \vdots $ $ \vdots $ $ \vdots $ $ \vdots $
下载: 导出CSV
表 3 拼接后的数据
Table 3. Data after concatenation
Time (UT) P0x1356WW68 P0x1060WW9 $ \cdots $ P0x1060WW123 Labels 7 Jan. 2017 01:03 10.45200062 –51.59808349 $ \cdots $ –1.05939996 3 01:07 10.45200062 –46.31356811 $ \cdots $ –0.47624000 1 01:10 1.24800002 –32.03112792 $ \cdots $ 0.34847998 2 $ \vdots $ $ \vdots $ $ \vdots $ $ \vdots $ $ \vdots $ $ \vdots $ 28 Feb. 2019 01:39 0.312000006 32.17395019 $ \cdots $ 1.004840016 3 01:40 0.156000003 30.81161499 $ \cdots $ 0.819400012 1 01:41 0.312000006 29.042785644 $ \cdots $ 0.641279995 2
下载: 导出CSV
表 4 实验数据集的基本信息
Table 4. Basic information of the experimental dataset
数据集 维度 样本数 样本异常比例 Satellite* 36 6535 0.316 Micius 23 205522 0.034
下载: 导出CSV
表 5 各实验数据集上LSIA-AD与对比算法的平均 Auc和F1 (%)
Table 5. Average Auc and F1 score (%) for LSIA-AD and baseline algorithms on experimental datasets
Method Micius Satellite Auc ± Std F1 ± Std Auc ± Std F1 ± Std OC-SVM 76.3 ± 0.6 56.7 ± 0.8 75.8 ± 0.5 67.8 ± 0.4 IFOREST 66.0 ± 2.2 38.4 ± 5.5 80.1 ± 1.3 68.8 ± 0.7 LOF 83.8 ± 0.6 62.5 ± 1.0 84.4 ± 0.8 74.4 ± 0.7 DSVDD 50.7 ± 7.3 33.8 ± 9.1 72.5 ± 4.4 65.1 ± 3.8 DAGMM 63.7 ± 6.8 30.2 ± 8.4 86.1 ± 2.1 69.4 ± 3.5 GAOD 64.9 ± 5.5 49.7 ± 6.7 76.8 ± 3.6 67.3 ± 3.3 LSIA-AD 89.4 ± 1.1 68.3 ± 2.9 87.6 ± 0.8 79.2 ± 0.9 注 加粗的数值表示最优结果.
下载: 导出CSV
表 6 关于Auc和F1的Wilcoxon检验p值
Table 6. Auc values and Wilcoxon rank-sum test p-values for F1
Dataset DAGMM IFOREST DSVDD OC-SVM LOF GAOD Auc Micius 3.39×10⁻⁸ 3.38×10⁻⁸ 3.38×10⁻⁸ 3.40×10⁻⁸ 3.40×10⁻⁸ 3.39×10⁻⁸ Satellite 1.11×10⁻² 3.38×10⁻⁸ 3.39×10⁻⁸ 3.40×10⁻⁸ 4.59×10⁻⁸ 3.39×10⁻⁸ F1 Micius 3.40×10⁻⁸ 3.41×10⁻⁸ 3.39×10⁻⁸ 3.40×10⁻⁸ 6.00×10⁻⁷ 7.56×10⁻⁹ Satellite 3.33×10⁻³ 3.38×10⁻⁸ 3.39×10⁻⁸ 3.37×10⁻⁸ 3.95×10⁻⁸ 3.36×10⁻⁸
下载: 导出CSV
表 7 不同深度学习算法的资源消耗情况
Table 7. Resource consumption of different deep learning algorithms
DSVDD DAGMM GAOD LSIA-AD Micius 运行时间/s 400.0 4114.0 483 1245.0 消耗内存/MByte 566.1 1872.5 1995.3 1748.8 Satellite 运行时间/s 294.0 1340.0 467.0 308.0 消耗内存/MByte 485.7 1726.6 1964.3 1593.0
下载: 导出CSV
-
[1] 刘恩雨. 卫星姿态控制系统故障诊断方法及健康管理研究[D]. 沈阳: 沈阳理工大学, 2023LIU Enyu. Research on Fault diagnosis Method and Health Management of satellite Attitude Control System[D]. Shenyang: Shenyang Ligong University, 2023 [2] 李虎, 郭国航, 胡钛, 等. 遥测参数数据载荷状态判别集成学习方法[J]. 国防科技大学学报, 2021, 43(6): 33-40 doi: 10.11887/j.cn.202106005LI HU, GUO Guohang, HU Tai, et al. Ensemble learning for state recognition of payload from telemetry data[J]. Journal of National University of Defense Technology, 2021, 43(6): 33-40 doi: 10.11887/j.cn.202106005 [3] JIANG H X, ZHANG K, WANG J Y, et al. Anomaly detection and identification in satellite telemetry data based on pseudo-period[J]. Applied Sciences, 2020, 10(1): 103 [4] YAIRI T, TAKEISHI N, ODA T, et al. A data-driven health monitoring method for satellite housekeeping data based on probabilistic clustering and dimensionality reduction[J]. IEEE Transactions on Aerospace and Electronic Systems, 2017, 53(3): 1384-1401 doi: 10.1109/TAES.2017.2671247 [5] 刘超. 基于深度学习的航天器异常检测方法研究[D]. 哈尔滨: 哈尔滨工业大学, 2022LIU Chao. Spacecraft Anomaly Detection Method based on the Deep Learning Research[D]. Harbin: Harbin Industrial University, 2022 [6] 王婵, 王慧泉, 金仲和. 皮纳卫星遥测数据异常检测聚类分析方法[J]. 哈尔滨工业大学学报, 2018, 50(4): 110-116WANG Chan, WANG Huiquan, JIN Zhonghe. Pico-satellite telemetry anomaly detection through clustering[J]. Journal of Harbin Institute of Technology, 2018, 50(4): 110-116 [7] ZHANG L W, YU J S, TANG D Y, et al. Anomaly detection for spacecraft using hierarchical agglomerative clustering based on maximal information coefficient[C]//2020 15th IEEE Conference on Industrial Electronics and Applications (ICIEA). Kristiansand, Norway: IEEE, 2020: 1848-1853 [8] SHI X T, PANG J Y, LIU D T, et al. Satellite telemetry time series clustering with improved key points series segmentation[C]//2017 Prognostics and System Health Management Conference (PHM-Harbin). Harbin, China: IEEE, 2017: 1-7 [9] PAN D W, LIU D T, ZHOU J, et al. Anomaly detection for satellite power subsystem with associated rules based on kernel principal component analysis[J]. Microelectronics Reliability, 2015, 55(9/10): 2082-2086 [10] 李海玲, 董广然, 党琦. 一种航天器异常检测案例关联方法[J]. 电讯技术, 2018, 58(7): 843-847LI Hailing, DONG Guangran, DANG Qi. A spacecraft anomaly detection case correlation method[J]. Telecommunication Engineering, 2018, 58(7): 843-847 [11] LI C L, SOHN K, YOON J, et al. CutPaste: Self-supervised learning for anomaly detection and localization[C]//2021 IEEE/CVF Conference on Computer Vision and Pattern Recognition (CVPR). Nashville, TN, USA: IEEE, 2021: 9659-9669 [12] LIU Y F, ZHUANG C Q, LU F. Unsupervised two-stage anomaly detection[OL]. arXiv preprint arXiv: 2103.11671, 2021 [13] DENG T Q, YE D S, MA R, et al. Low-rank local tangent space embedding for subspace clustering[J]. Information Sciences, 2020, 508: 1-21 doi: 10.1016/j.ins.2019.08.060 [14] ERFANI S M, RAJASEGARAR S, KARUNASEKERA S, et al. High-dimensional and large-scale anomaly detection using a linear one-class SVM with deep learning[J]. Pattern Recognition, 2016, 58: 121-134 doi: 10.1016/j.patcog.2016.03.028 [15] RUMELHART D E, HINTON G E, WILLIAMS R J. Learning representations by back-propagating errors[J]. Nature, 1986, 323(6088): 533-536 doi: 10.1038/323533a0 [16] BERTHELOT D, RAFFEL C, ROY A, et al. Understanding and improving interpolation in autoencoders via an adversarial regularizer[OL]. arXiv preprint arXiv 1807.07543, 2018 [17] SCHÖLKOPF B, WILLIAMSON R, SMOLA A, et al. Support vector method for novelty detection[C]//Proceedings of the 12th International Conference on Neural Information Processing Systems. Denver, CO: MIT Press, 1999: 582-588 [18] LIU F T, TING K M, ZHOU Z H. Isolation forest[C]//2008 Eighth IEEE International Conference on Data Mining. Pisa, Italy: IEEE, 2008: 413-422 [19] BREUNIG M M, KRIEGEL H P, NG R T, et al. LOF: Identifying density-based local outliers[J]. ACM SIGMOD Record, 2000, 29(2): 93-104 doi: 10.1145/335191.335388 [20] RUFF L, VANDERMEULEN R, GÖRNITZ N, et al. Deep one-class classification[C]//Proceedings of the 35th International Conference on Machine Learning (PMLR). Stockholm, Sweden, 2018: 4393-4402 [21] ZONG B, SONG Q, MIN M R, et al. Deep autoencoding gaussian mixture model for unsupervised anomaly detection[C]//6th International Conference on Learning Representations (ICLR). Vancouver, BC, Canada, 2018 : 1-19 [22] BERGMAN L, HOSHEN Y. Classification-based anomaly detection for general data[OL]. arXiv preprint arXiv: 2005.02359, 2020 -
-

 下载:
下载:

计量
- 文章访问数: 845
- HTML全文浏览量: 738
- PDF下载量: 93
-
被引次数:
0(来源:Crossref)
0(来源:其他)

