


基于一维残差卷积神经网络的Pi2脉动识别模型
doi: 10.11728/cjss2025.01.2024-0018 cstr: 32142.14.cjss.2024-0018
-
 张怡悦 女, 1999年6月出生, 现为中国科学院大学、中国科学院国家空间科学中心在读硕士生, 主要研究方向为机器学习在超低频波识别中的应用. E-mail: zhangyiyue21@mails.ucas.ac.cn
 -
 邹自明 男, 1971年5月出生, 现为中国科学院国家空间科学中心研究员, 博士生导师, 主要研究方向为日地空间信息系统技术、机器学习在空间物理中的应用等. E-mail: mzou@nssc.ac.cn
作者简介:
通讯作者:
Identification Model of Pi2 Pulsation Based on One-dimensional Residual Convolutional Neural Network
-
摘要: Pi2脉动是一种不规则的超低频波(Ultra-Low Frequency, ULF), 是磁层与电离层耦合的重要瞬态响应, 其发生与亚暴爆发有密切的关系. Pi2脉动作为地球磁层中的一种扰动现象, 其发生信号隐藏在地磁场分量观测数据中. 面对持续增长的观测数据量, 如何有效地判断某段地磁场分量观测数据中是否有Pi2脉动发生, 是构建Pi2脉动识别模型的关键. 利用子午工程磁通门磁力仪观测的地磁场分量数据, 基于一维残差卷积神经网络(One-Dimensional Residual Convolutional Neural Network, 1D-ResCNN), 构建了一个端到端的Pi2脉动识别模型, 用于判别某段地磁场分量观测数据中是否有Pi2脉动发生. 实验结果表明, 该模型与现有公开发表的Pi2脉动机器学习识别模型相比, 具有更高的识别准确率和更低的虚报率、漏报率.
-
关键词:
- Pi2脉动 /
- Pi2脉动识别模型 /
- 一维残差卷积神经网络
Abstract: Pi2 pulsations are irregular ultra-low frequency waves, representing a significant transient response to the coupling between the magnetosphere and ionosphere. Their occurrence is associated with onset of substorms. As a disturbance phenomenon in the Earth’s magnetosphere, the occurrence signal of Pi2 pulsations is hidden within the observation data of geomagnetic field components. Addressing the increasing amount of observation data, how to efficiently determine whether Pi2 pulsation has occurred in a segment of geomagnetic field component observational data is the key to build a Pi2 pulsation identification model. Based on the time series observation data of the FGM from the Chinese Meridian Project and One-Dimensional Residual Convolutional Neural Network (1D-ResCNN), this paper establishes an end-to-end Pi2 pulsation identification model. This model can distinguish whether Pi2 pulsation occurs in the observation data of a certain geomagnetic field component. Experimental results show that this model has higher recognition accuracy and lower false positive rate and false negative rate than the existing Pi2 pulsation machine learning identification model. -
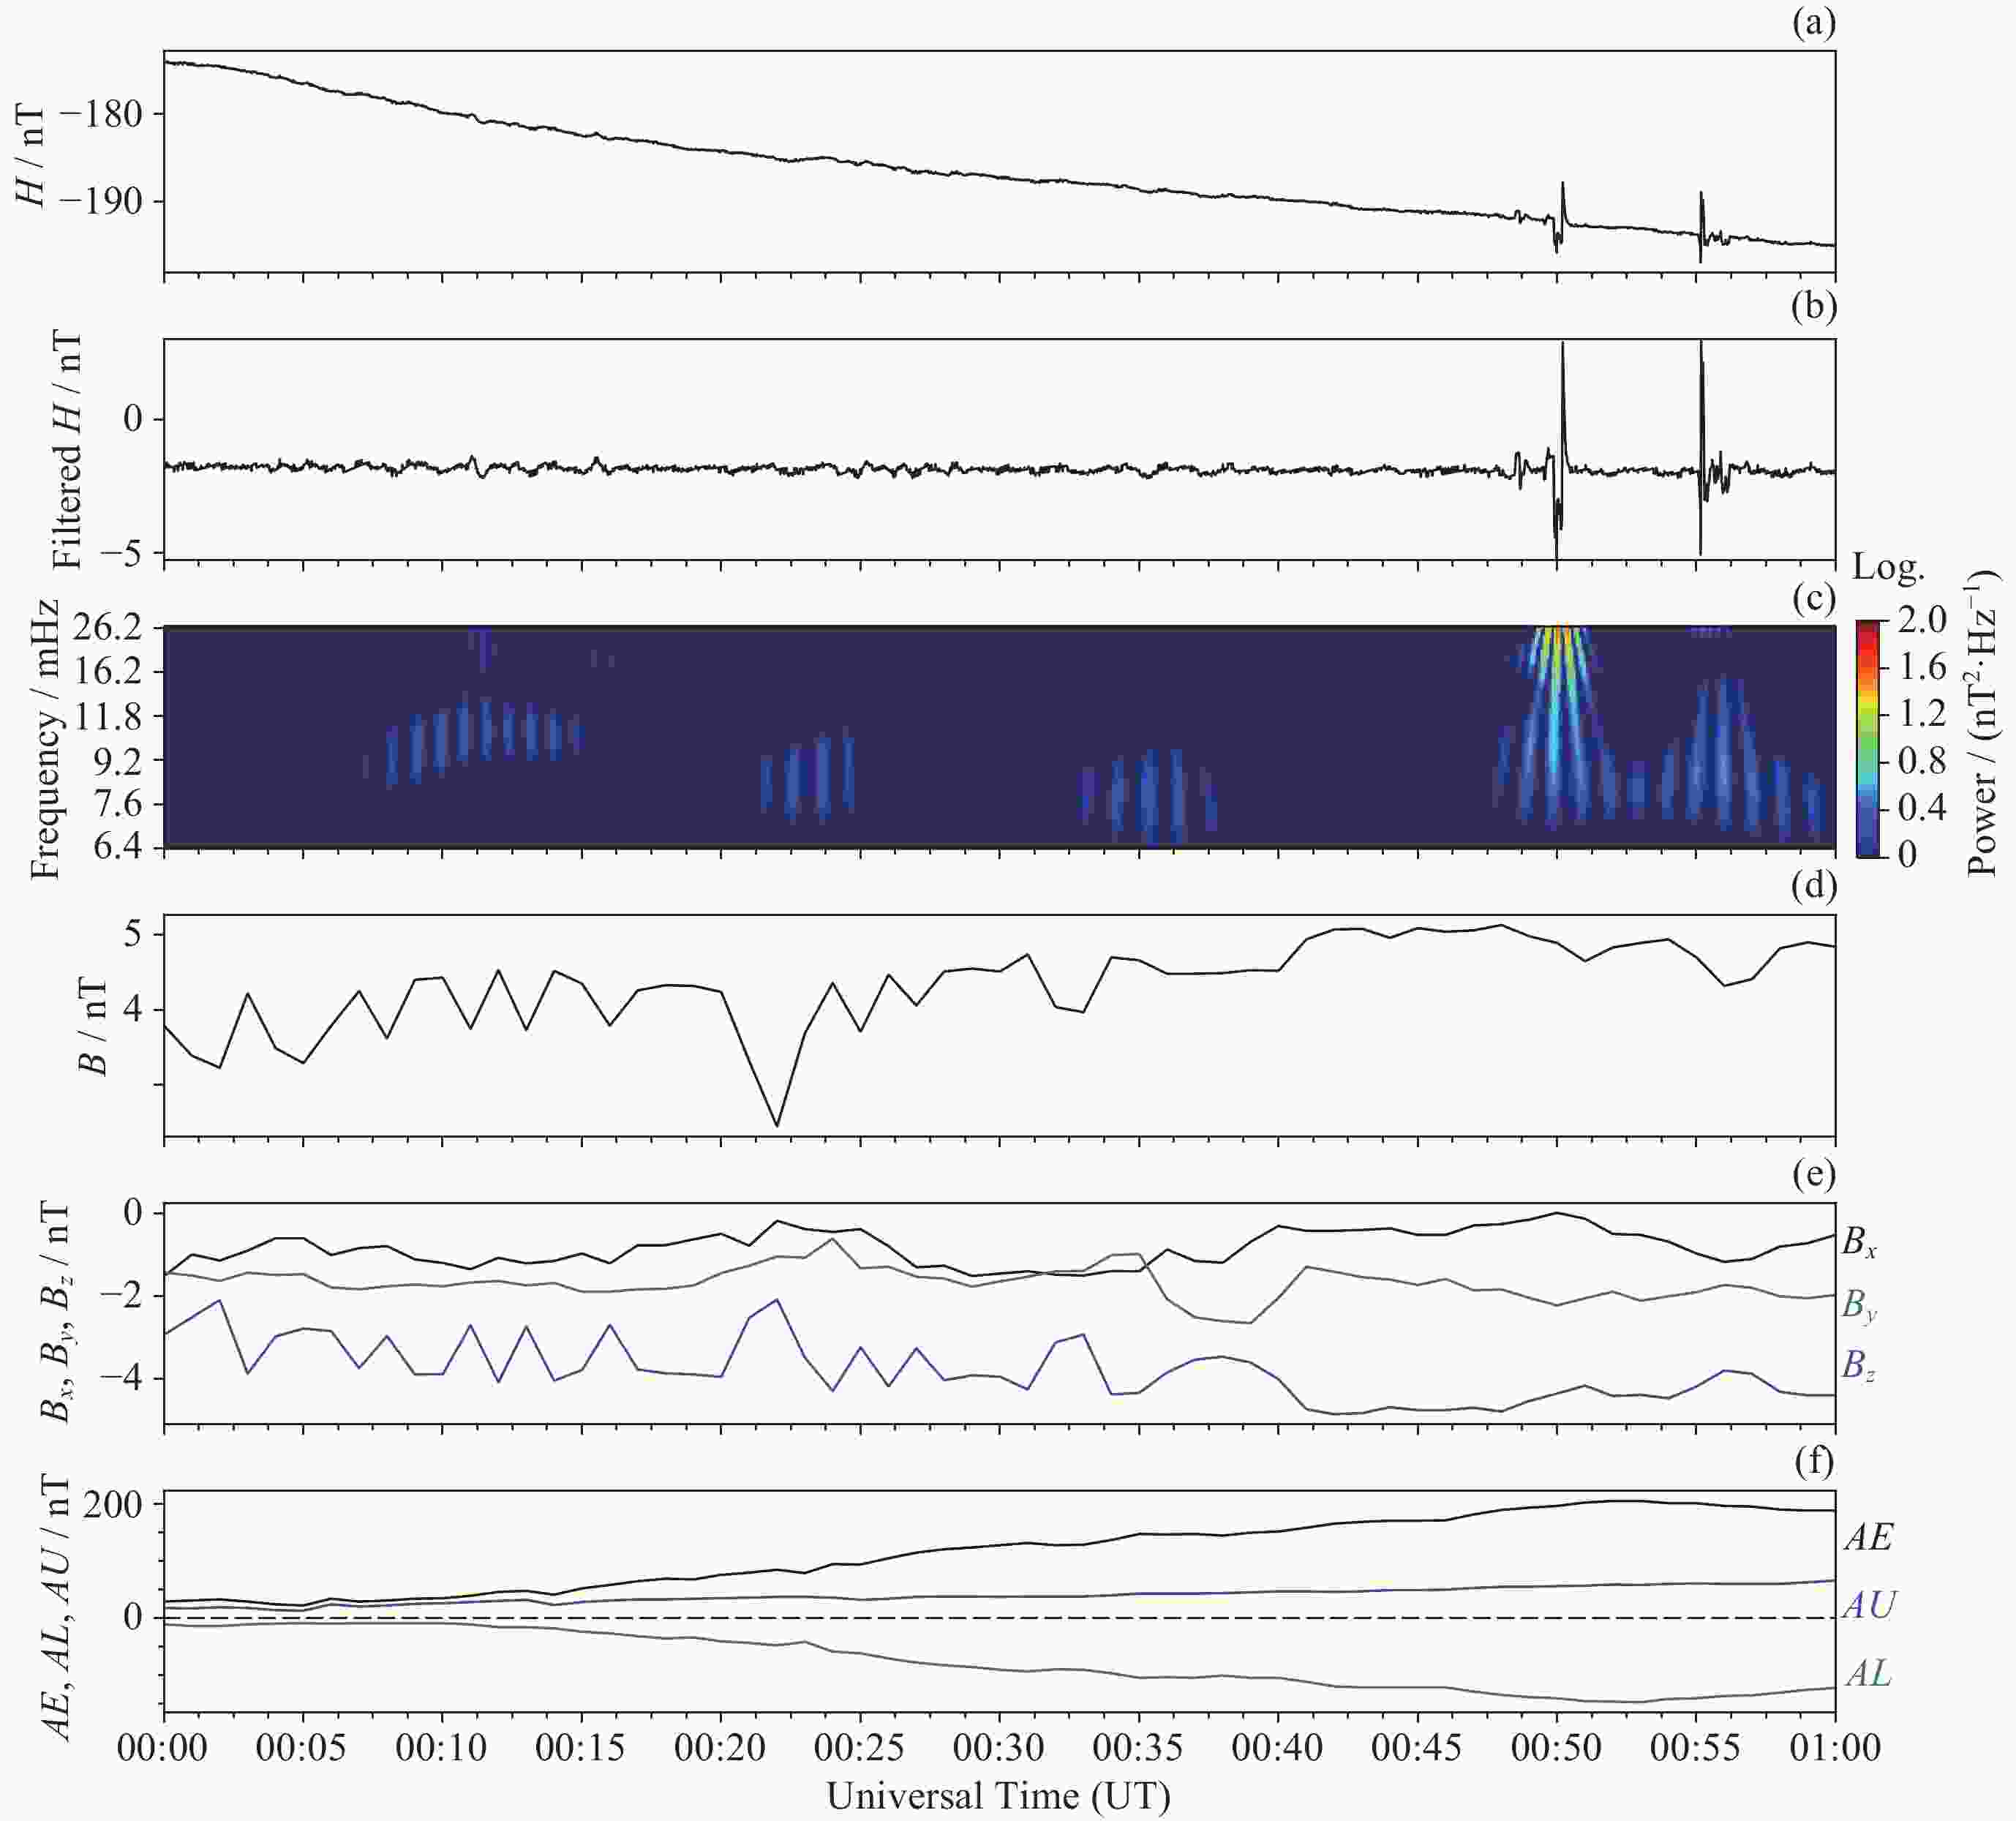
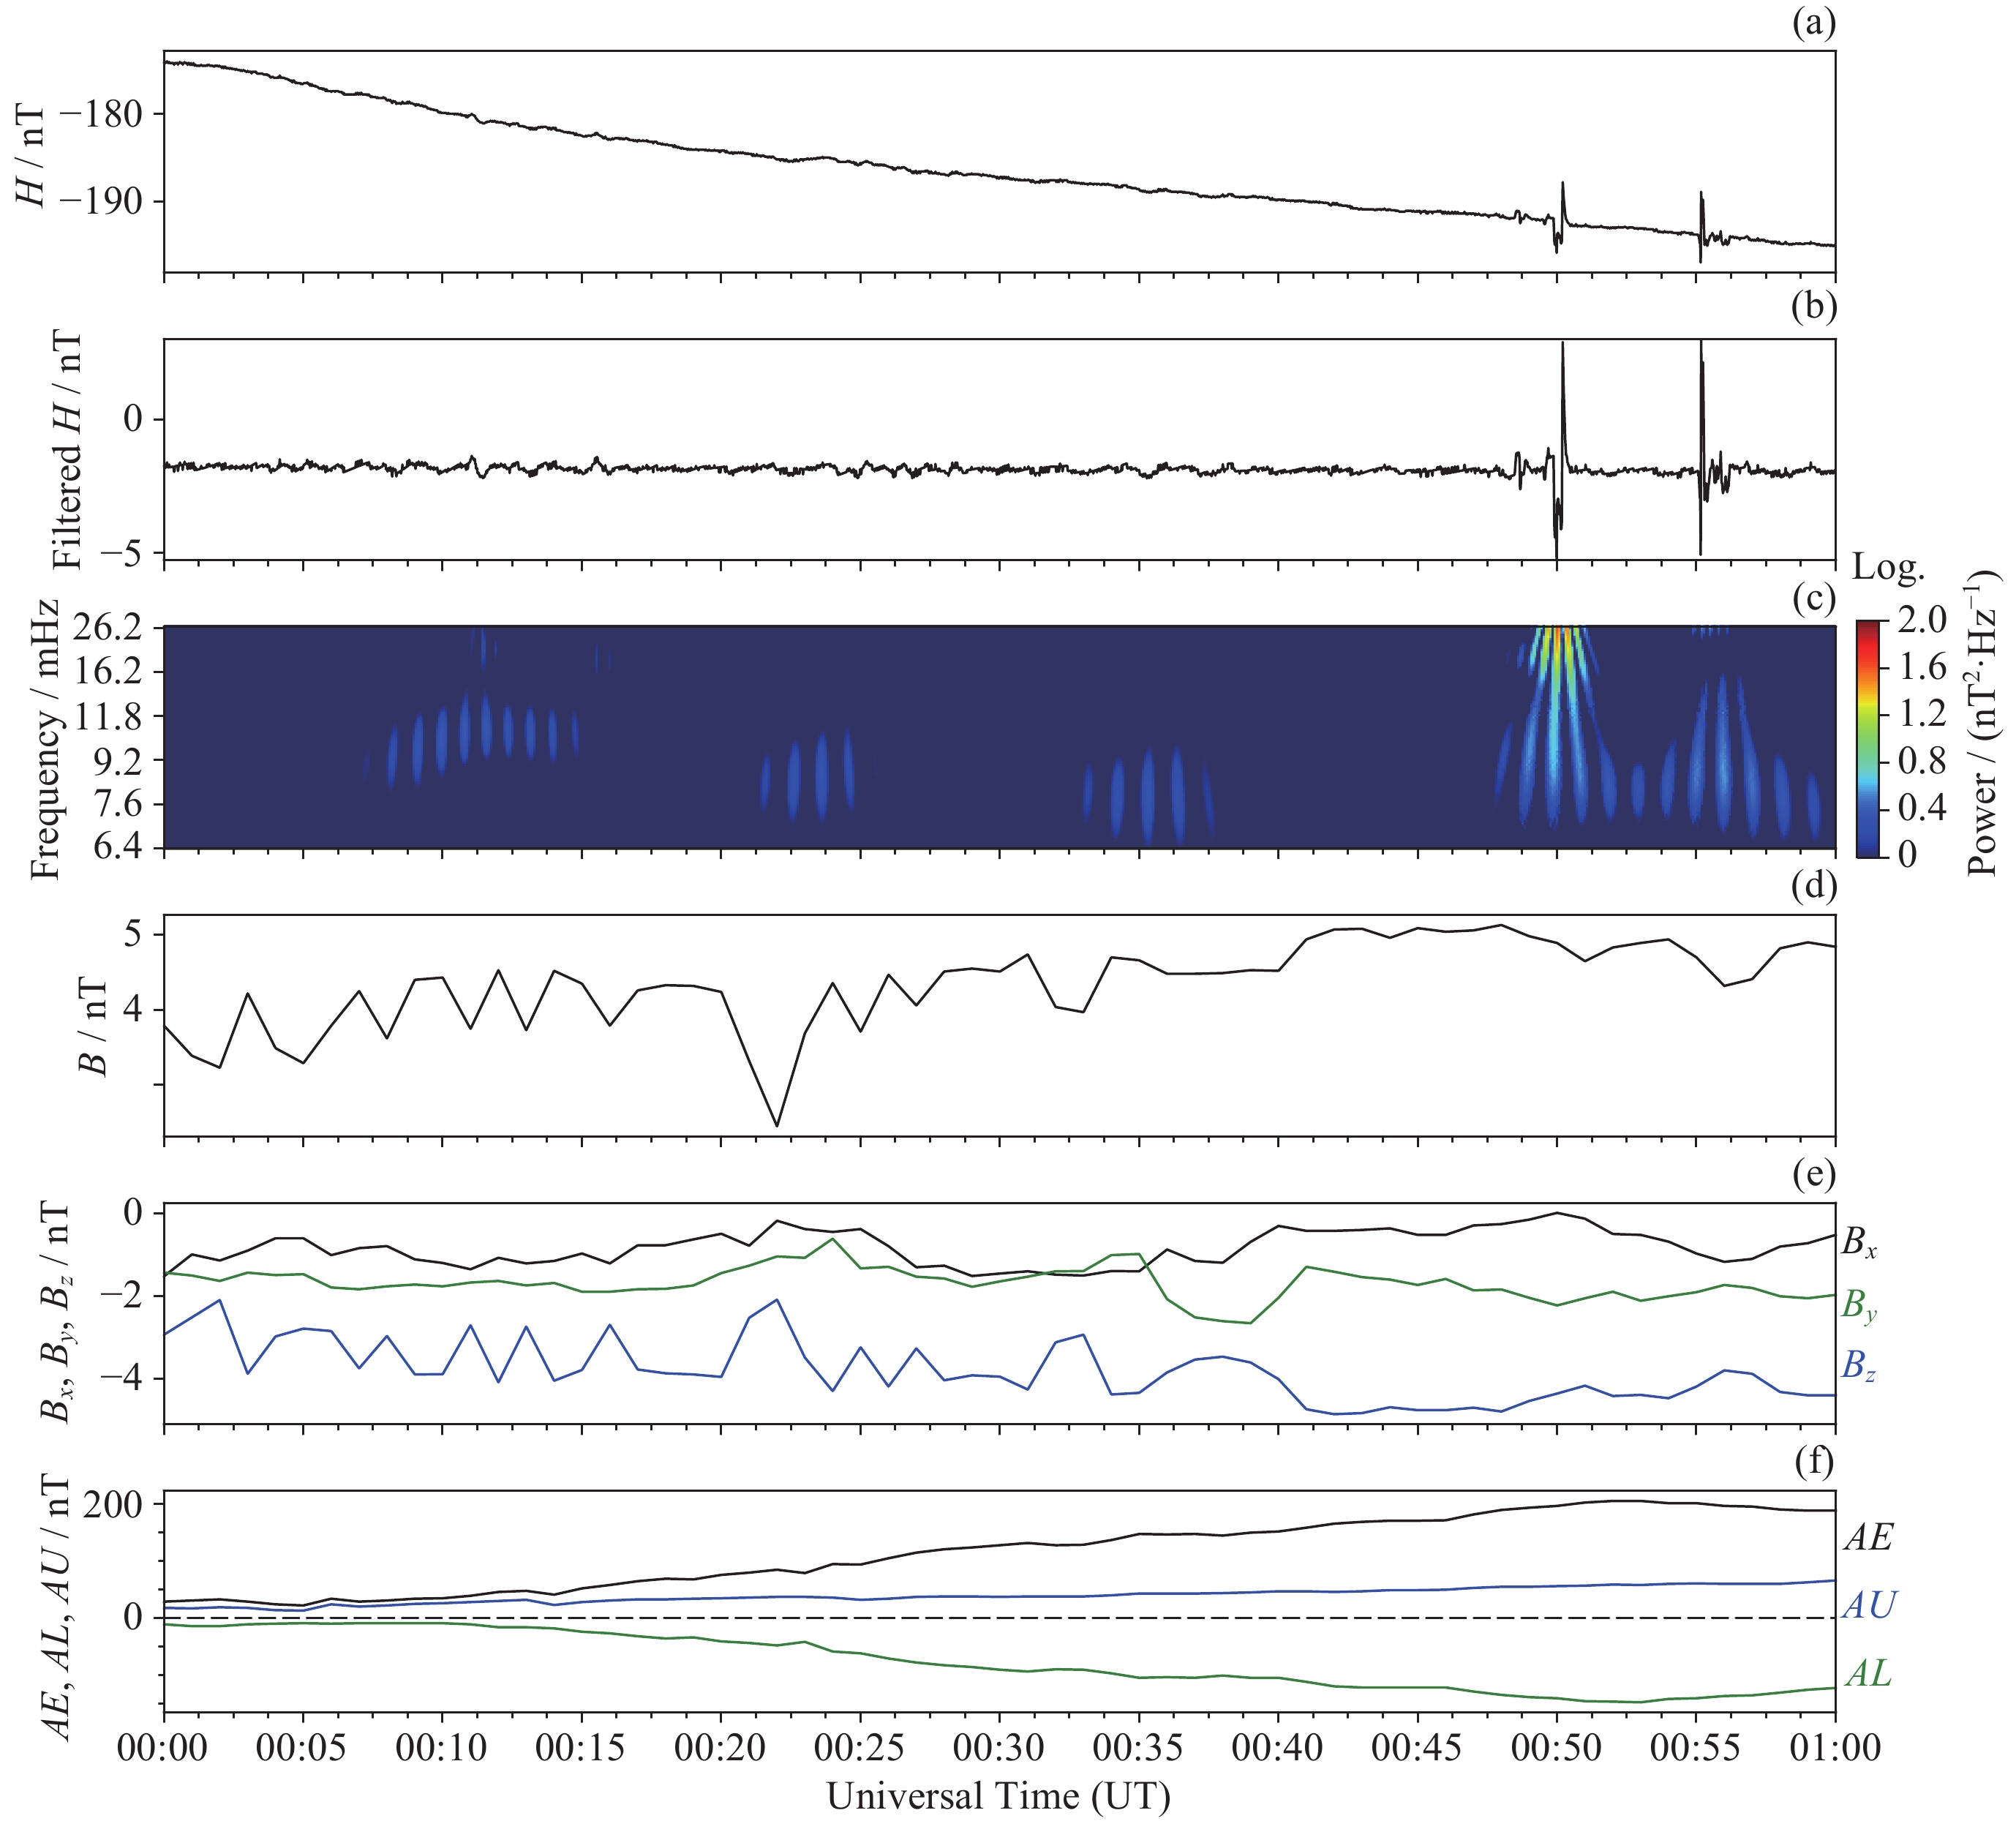
图 1 候选事件中的非Pi2脉动事件举例 (2019年9月24日00:00 UT-01:00 UT漠河站磁力仪观测数据)
Figure 1. Example of non-Pi2 pulsation event in candidate events (MHT magnetometer data during 00:00 UT-01:00 UT on 24 September 2019)
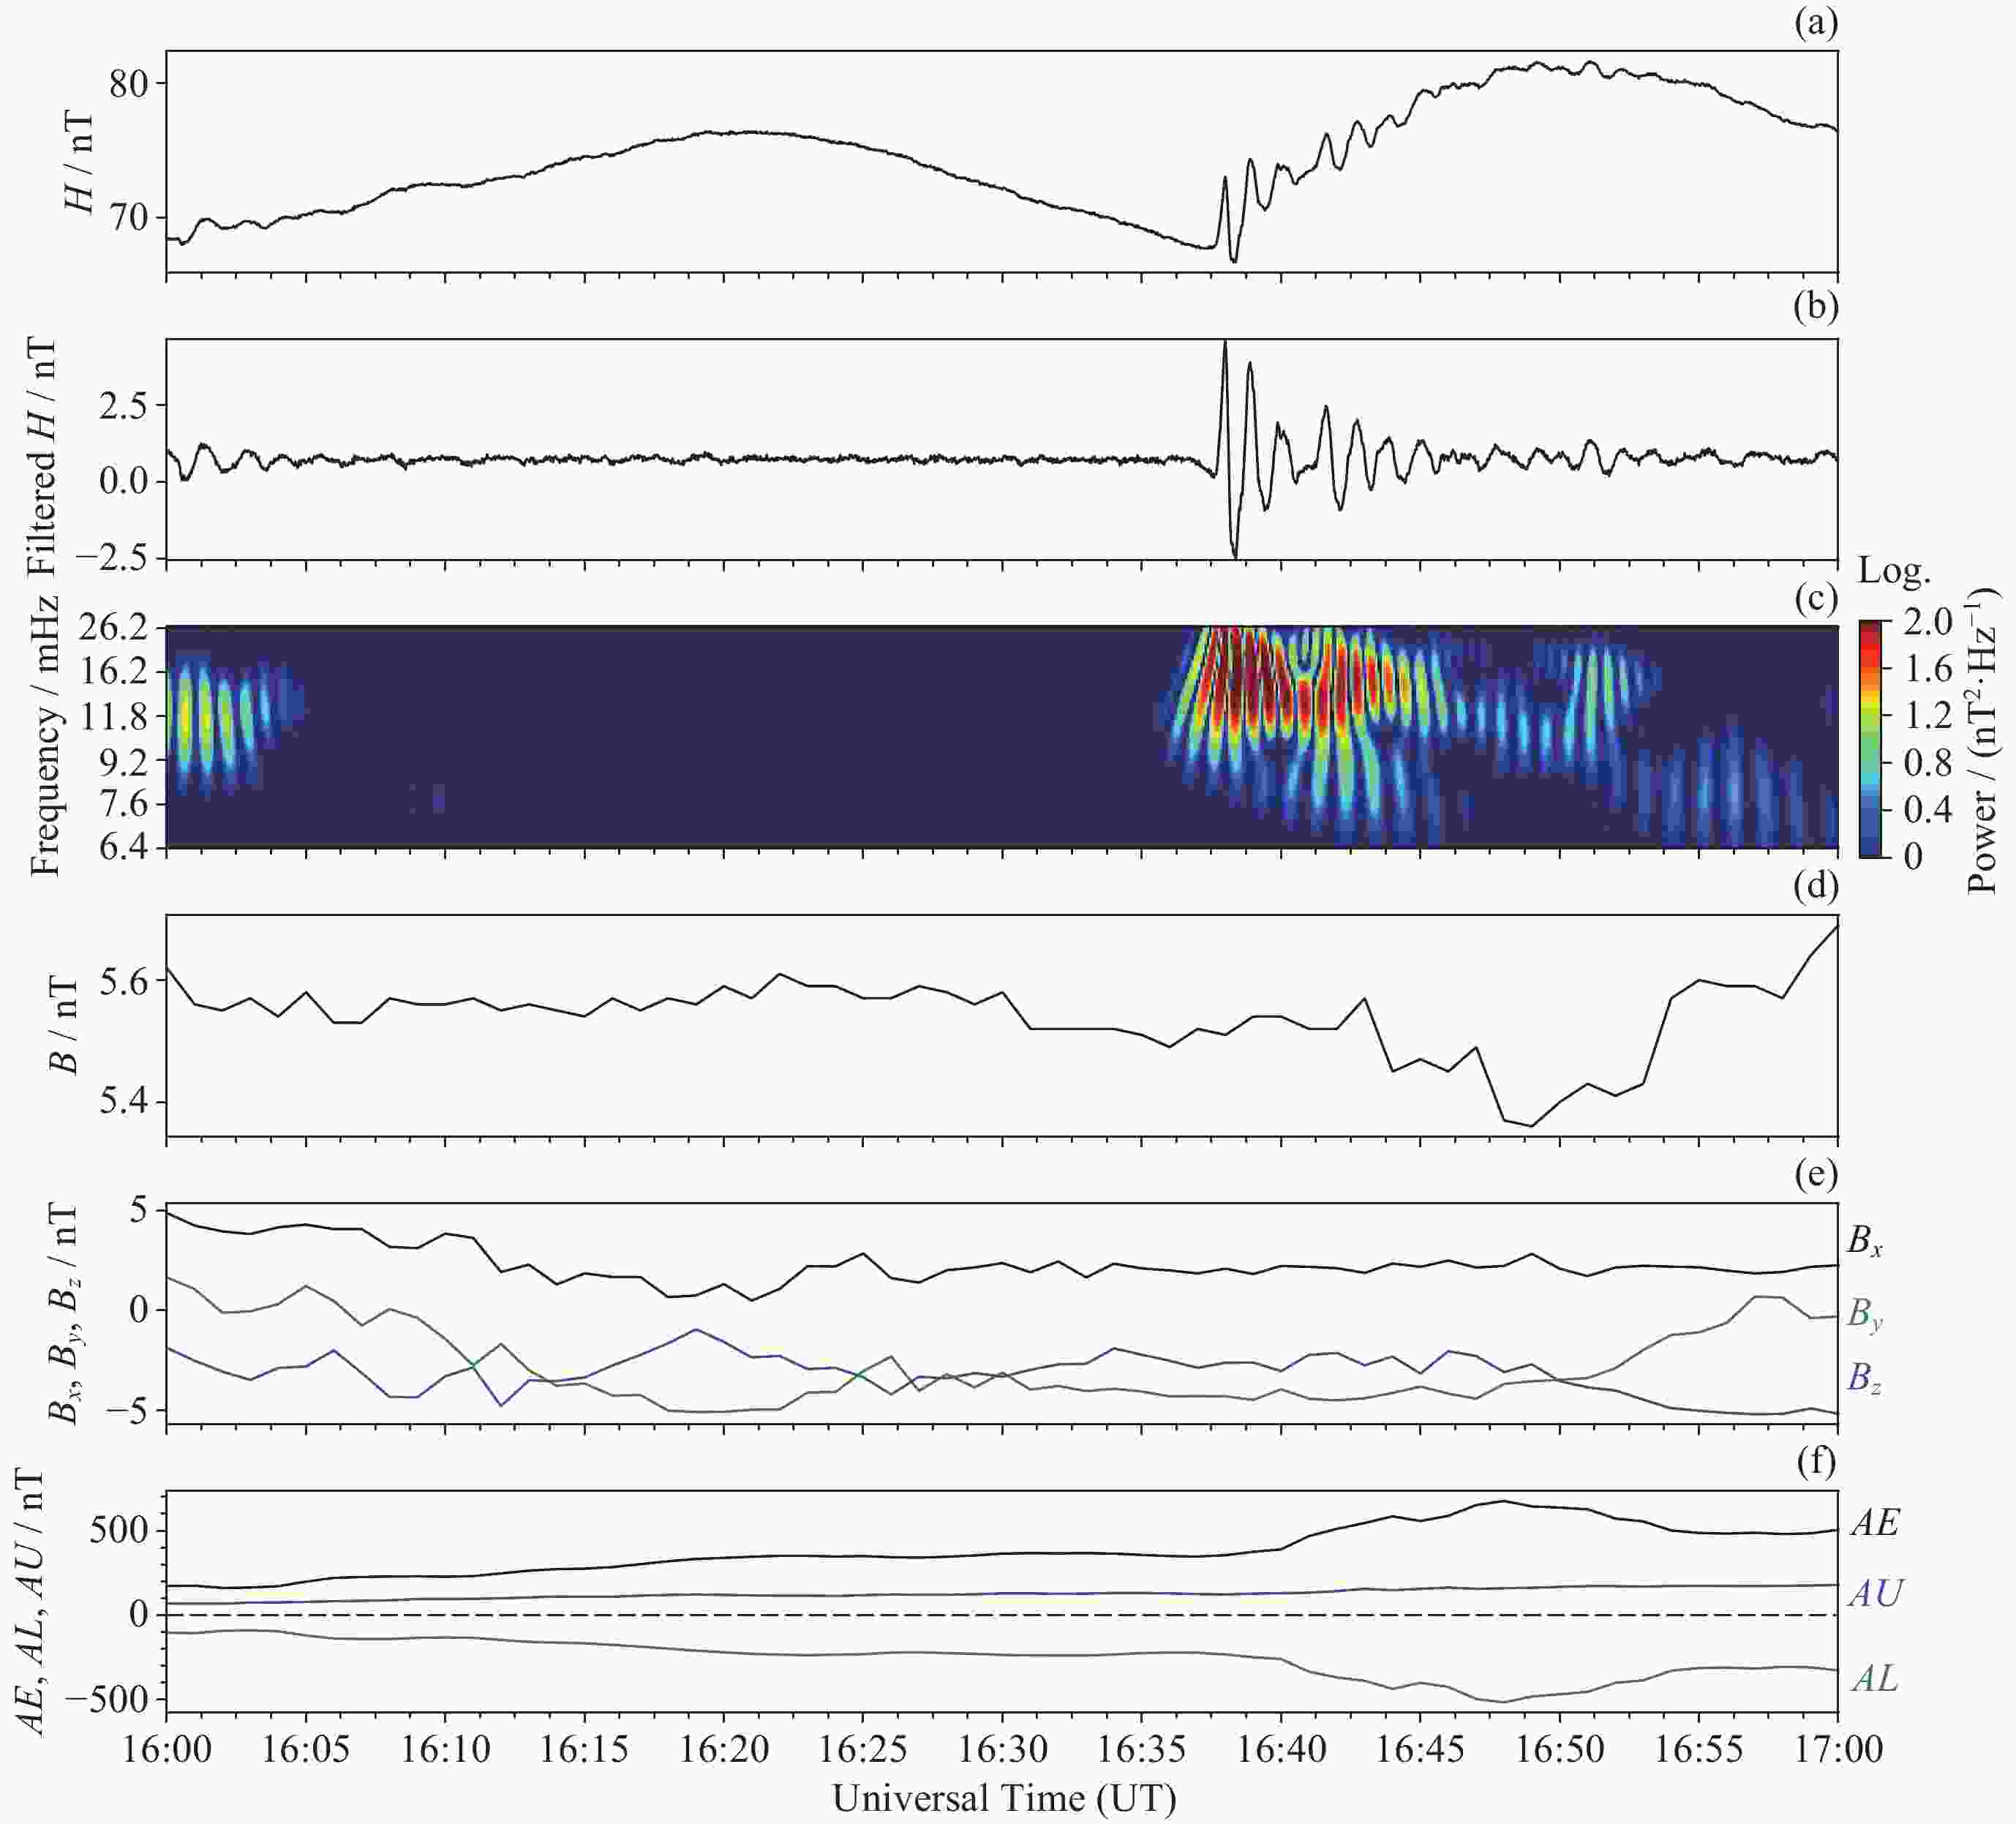
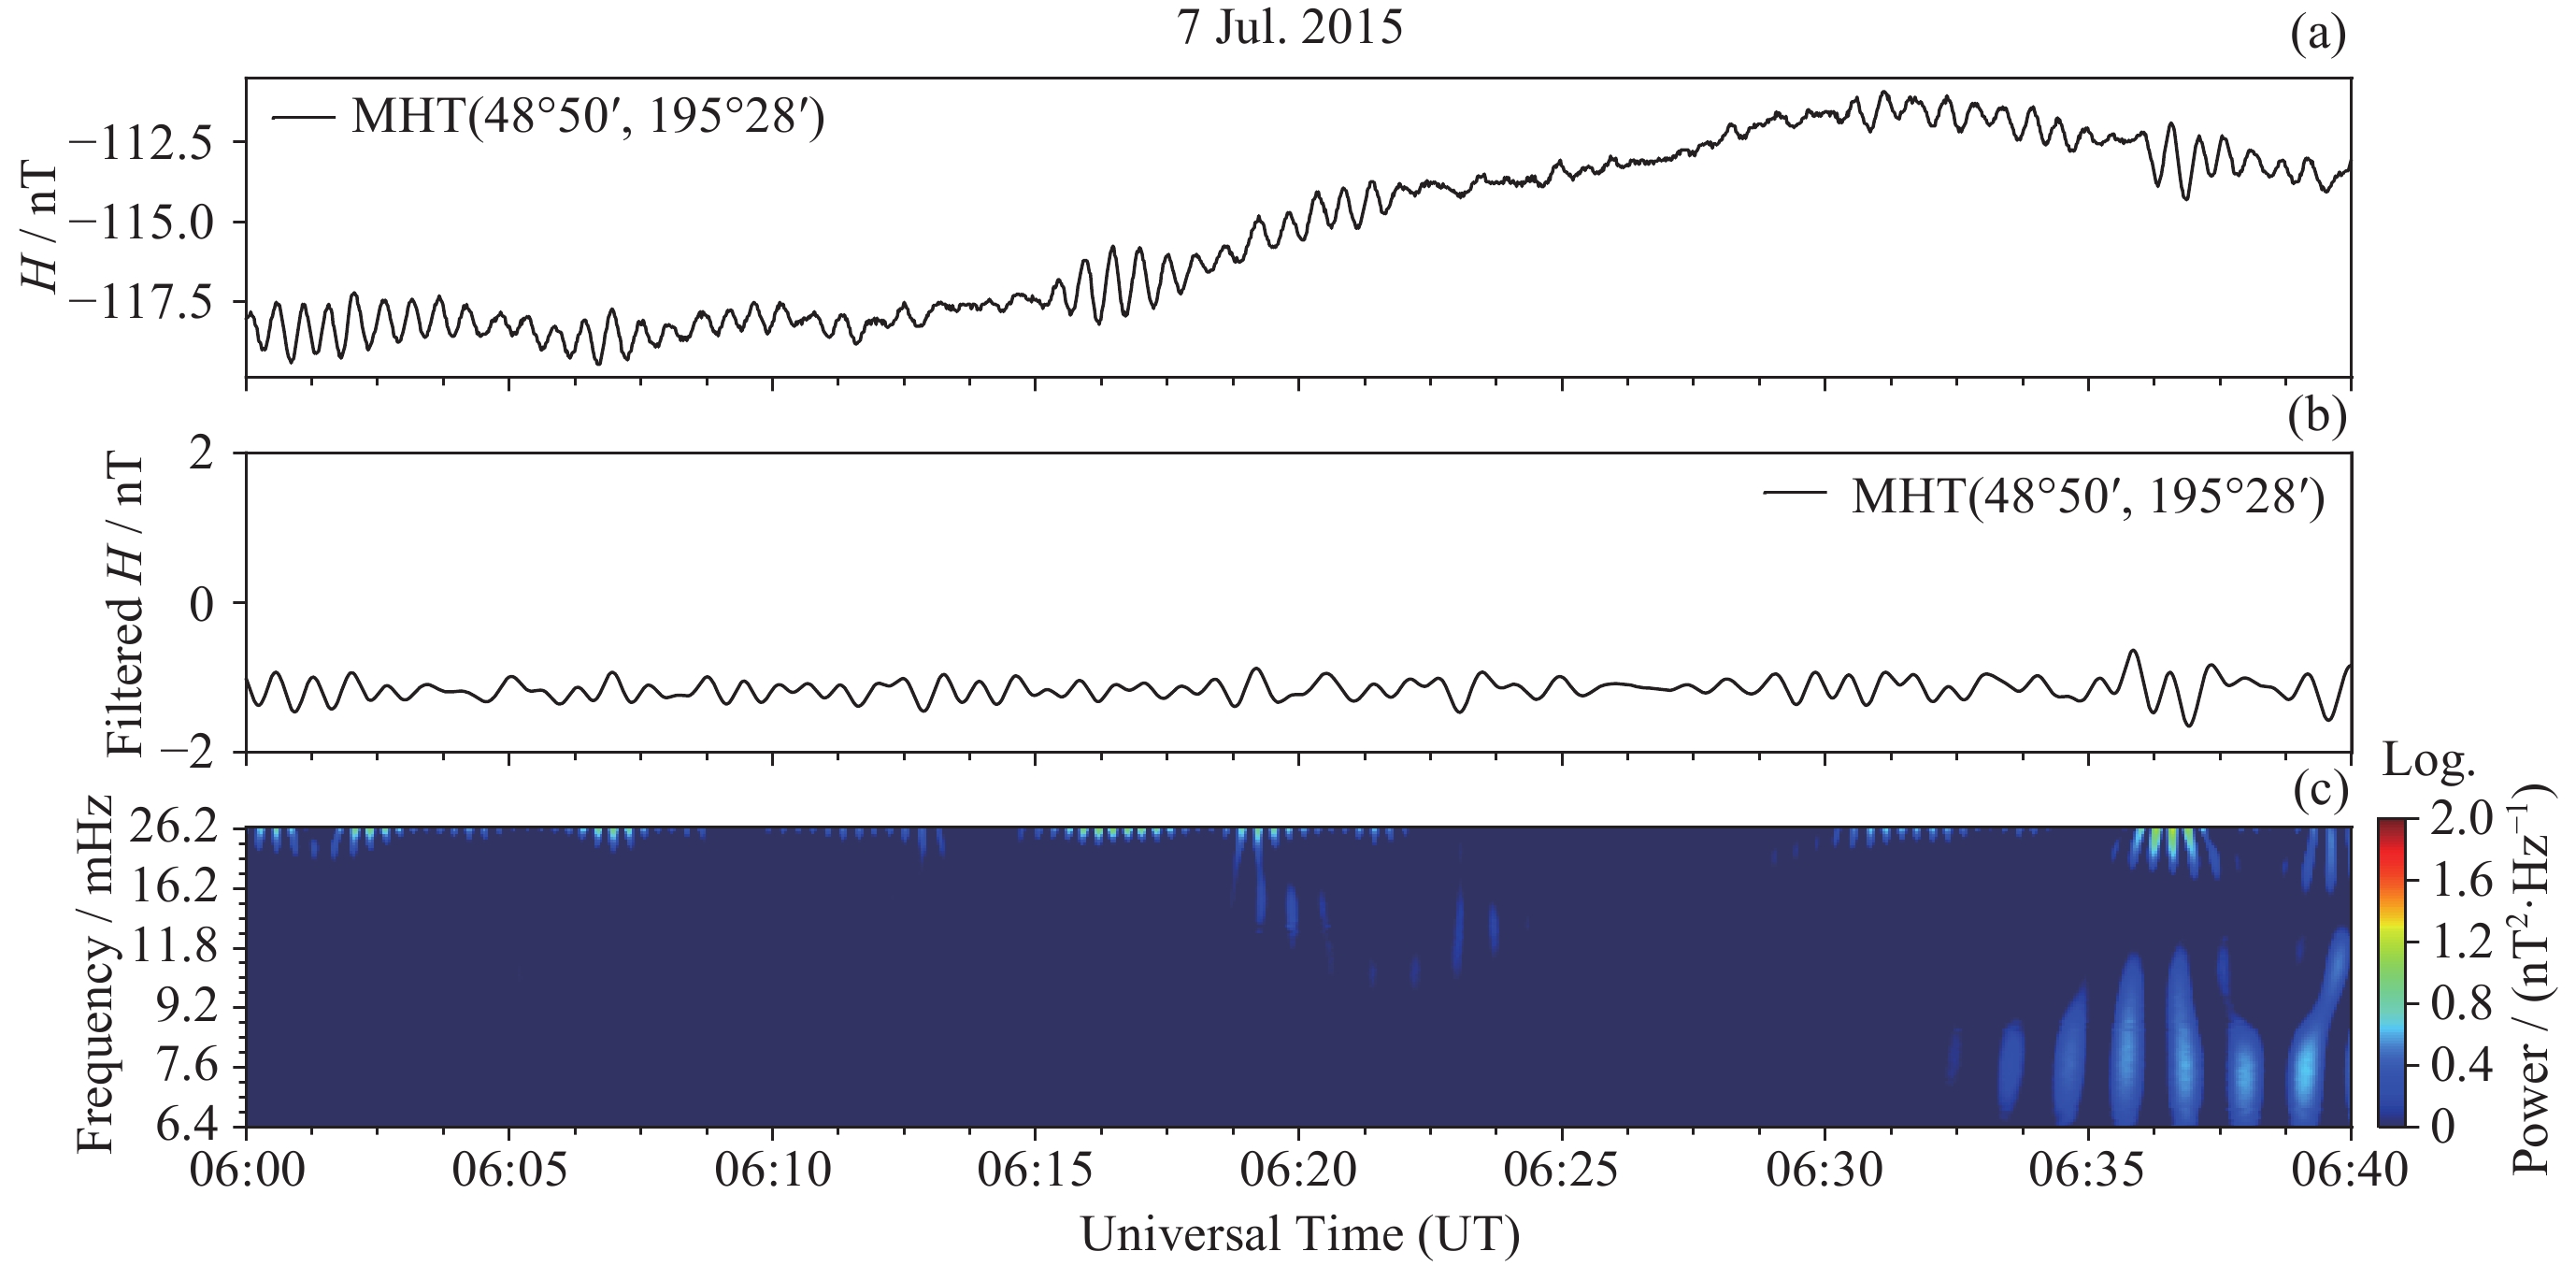
图 2 候选事件中的Pi2脉动事件举例 (2011年6月1日16:00 UT-17:00 UT漠河站磁力仪观测数据)
Figure 2. Example of Pi2 pulsation event in candidate events (MHT magnetometer data during 16:00 UT-17:00 UT on 1 June 2011)
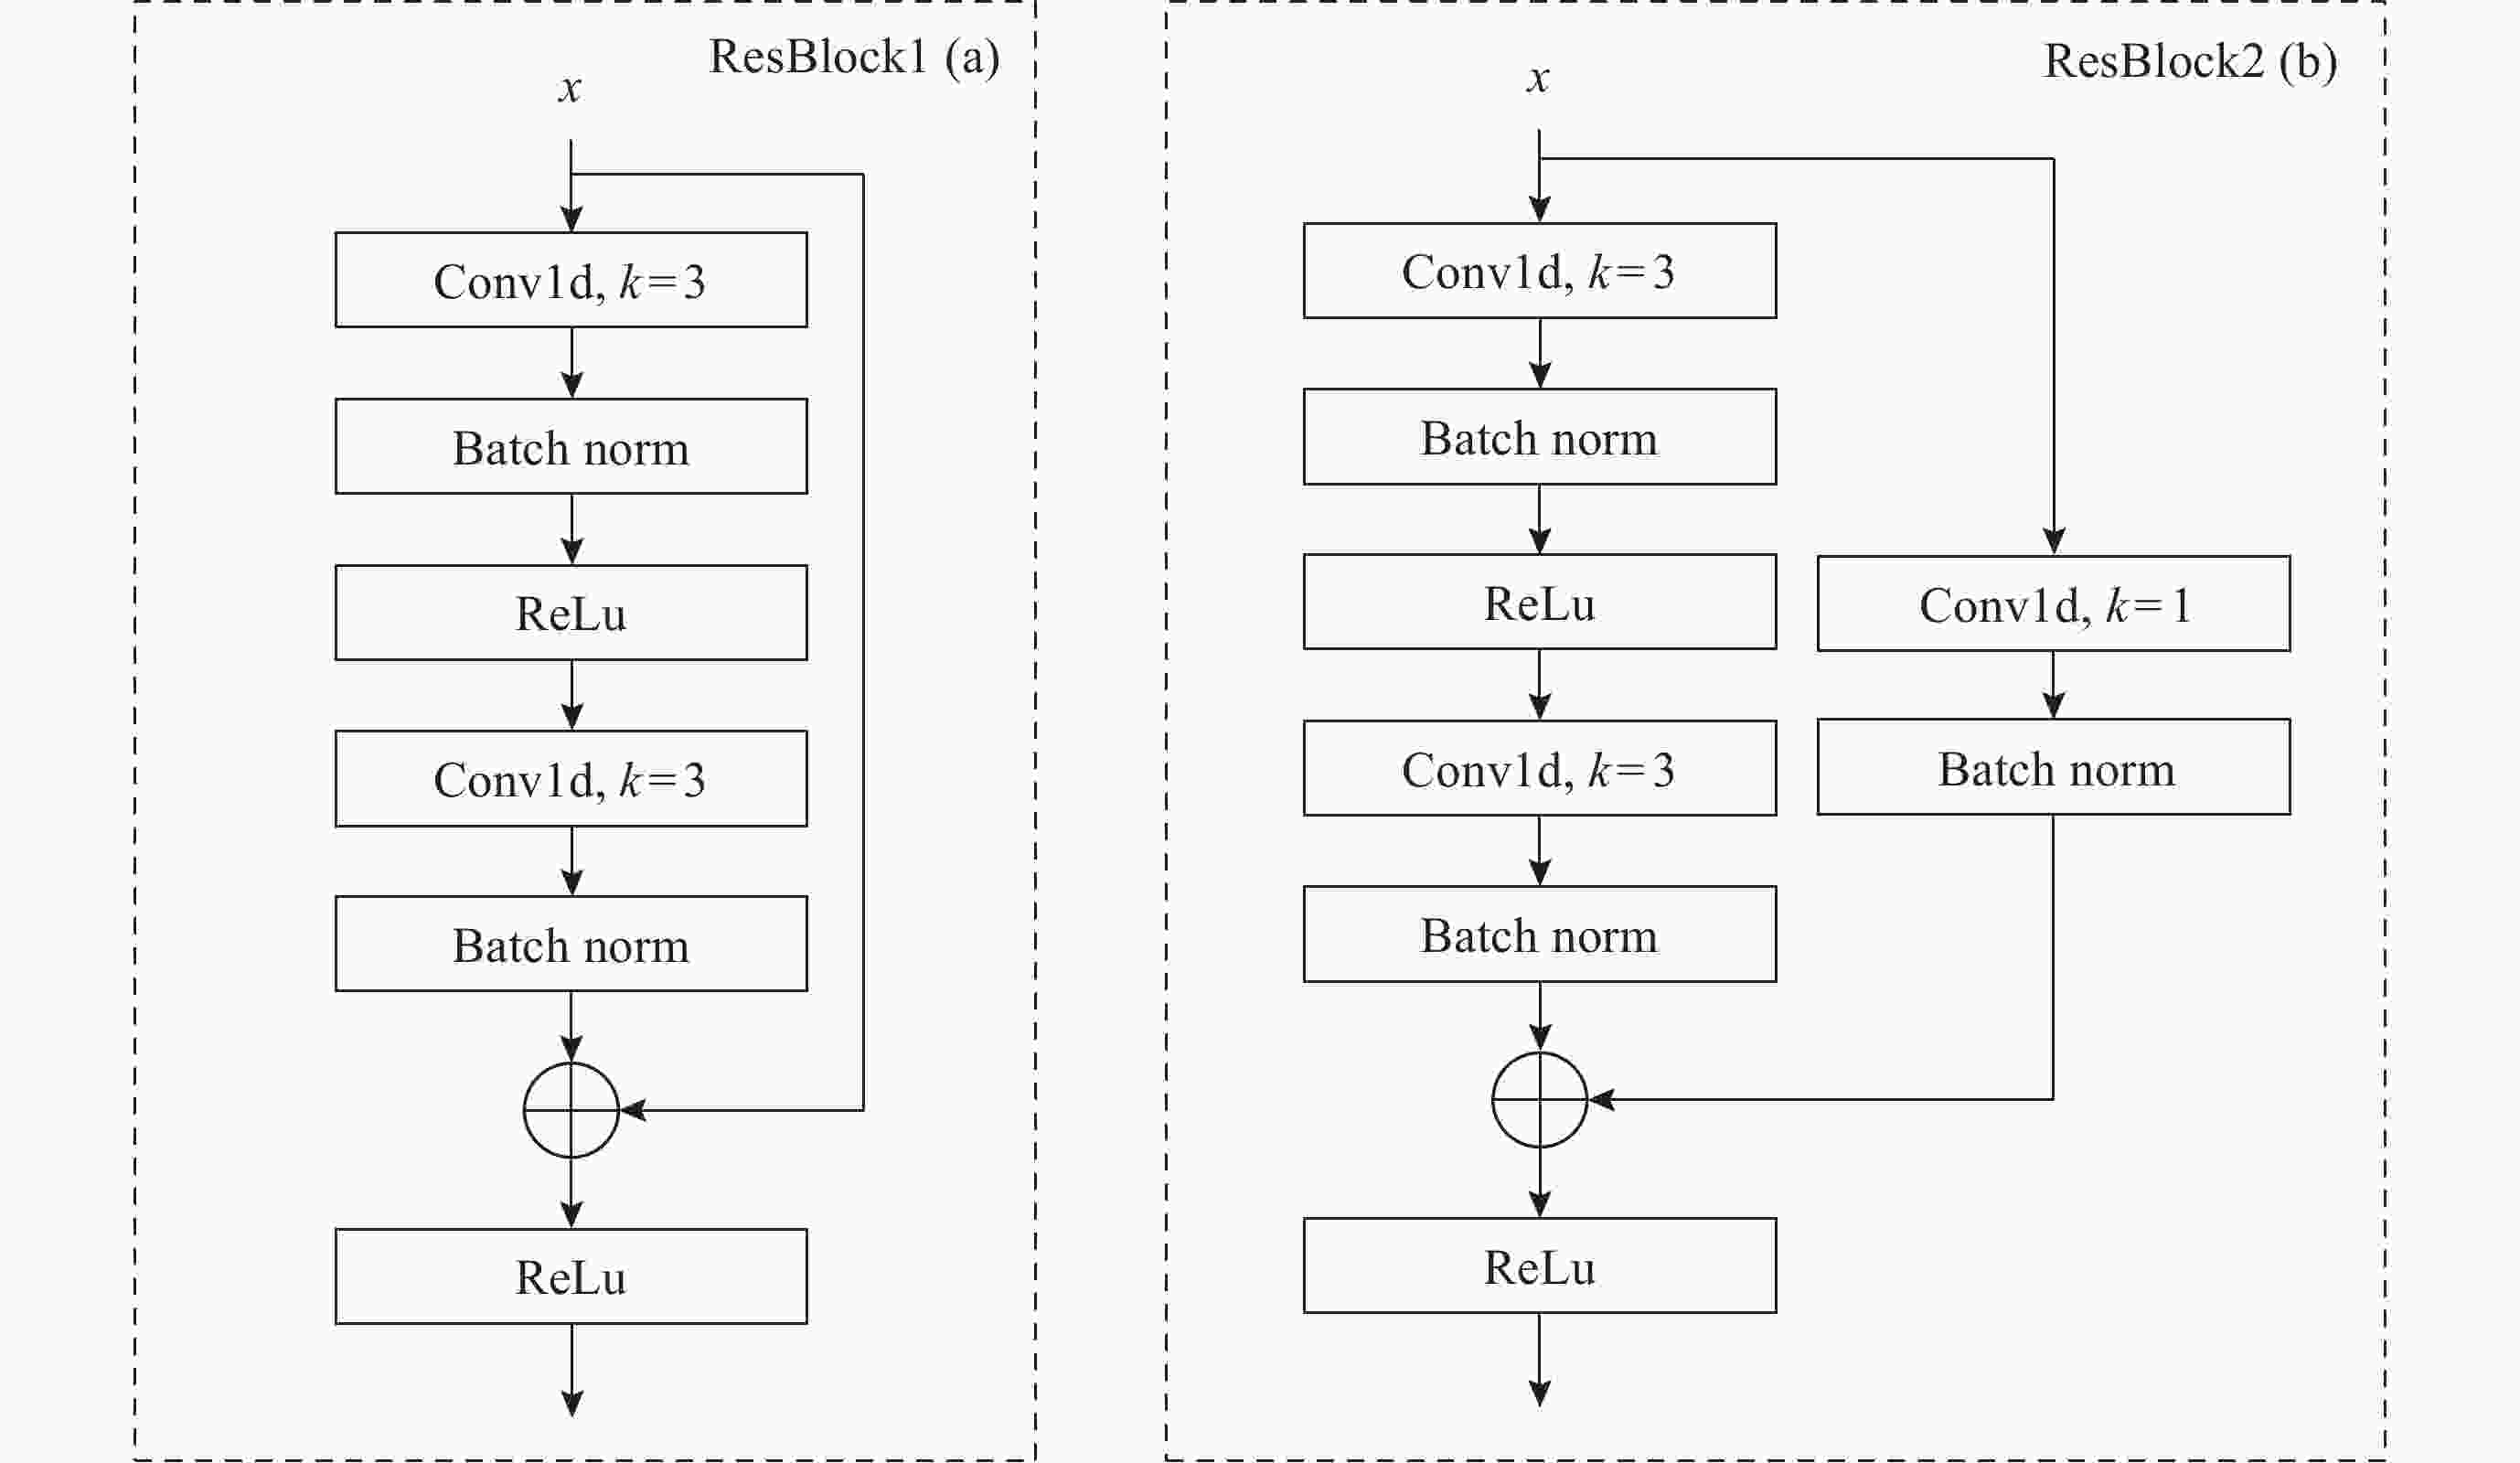
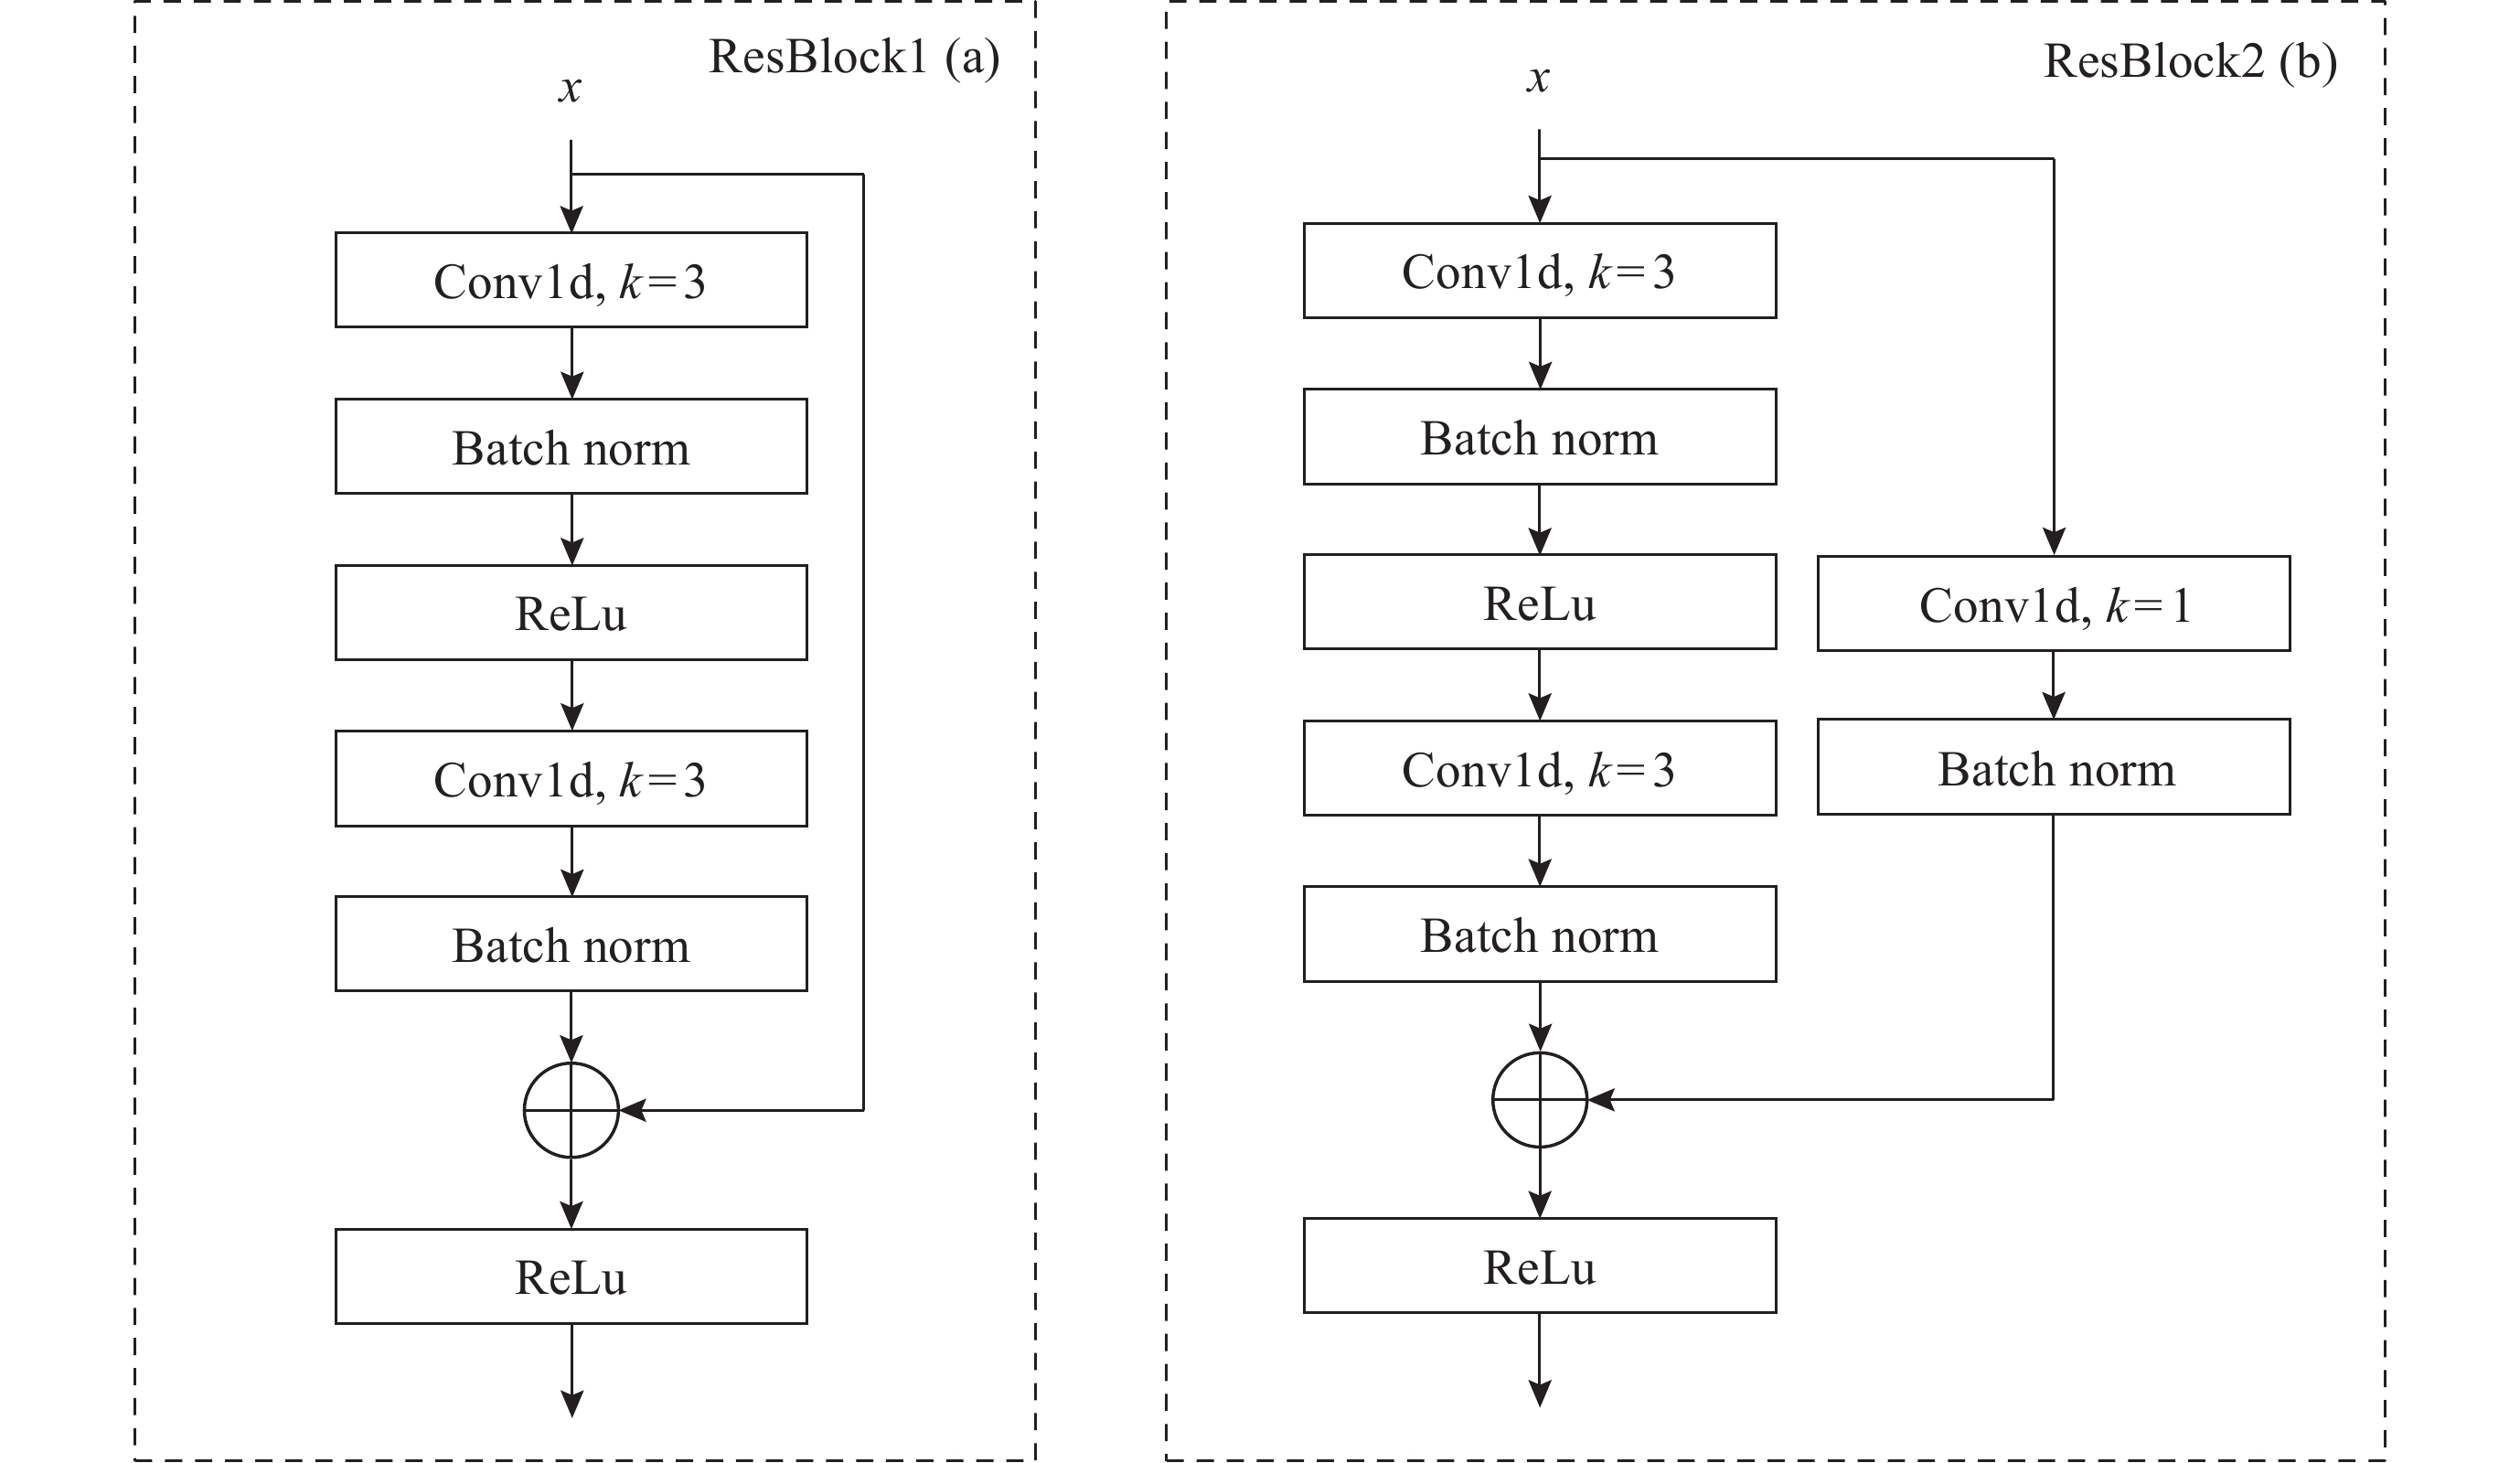
图 5 直接相加的残差模块ResBlock1 (a)和具有线性变换的残差模块ResBlock2 (b)
Figure 5. ResBlock1 with direct addition (a) and ResBlock2 with linearly transformation to match the dimension (b)
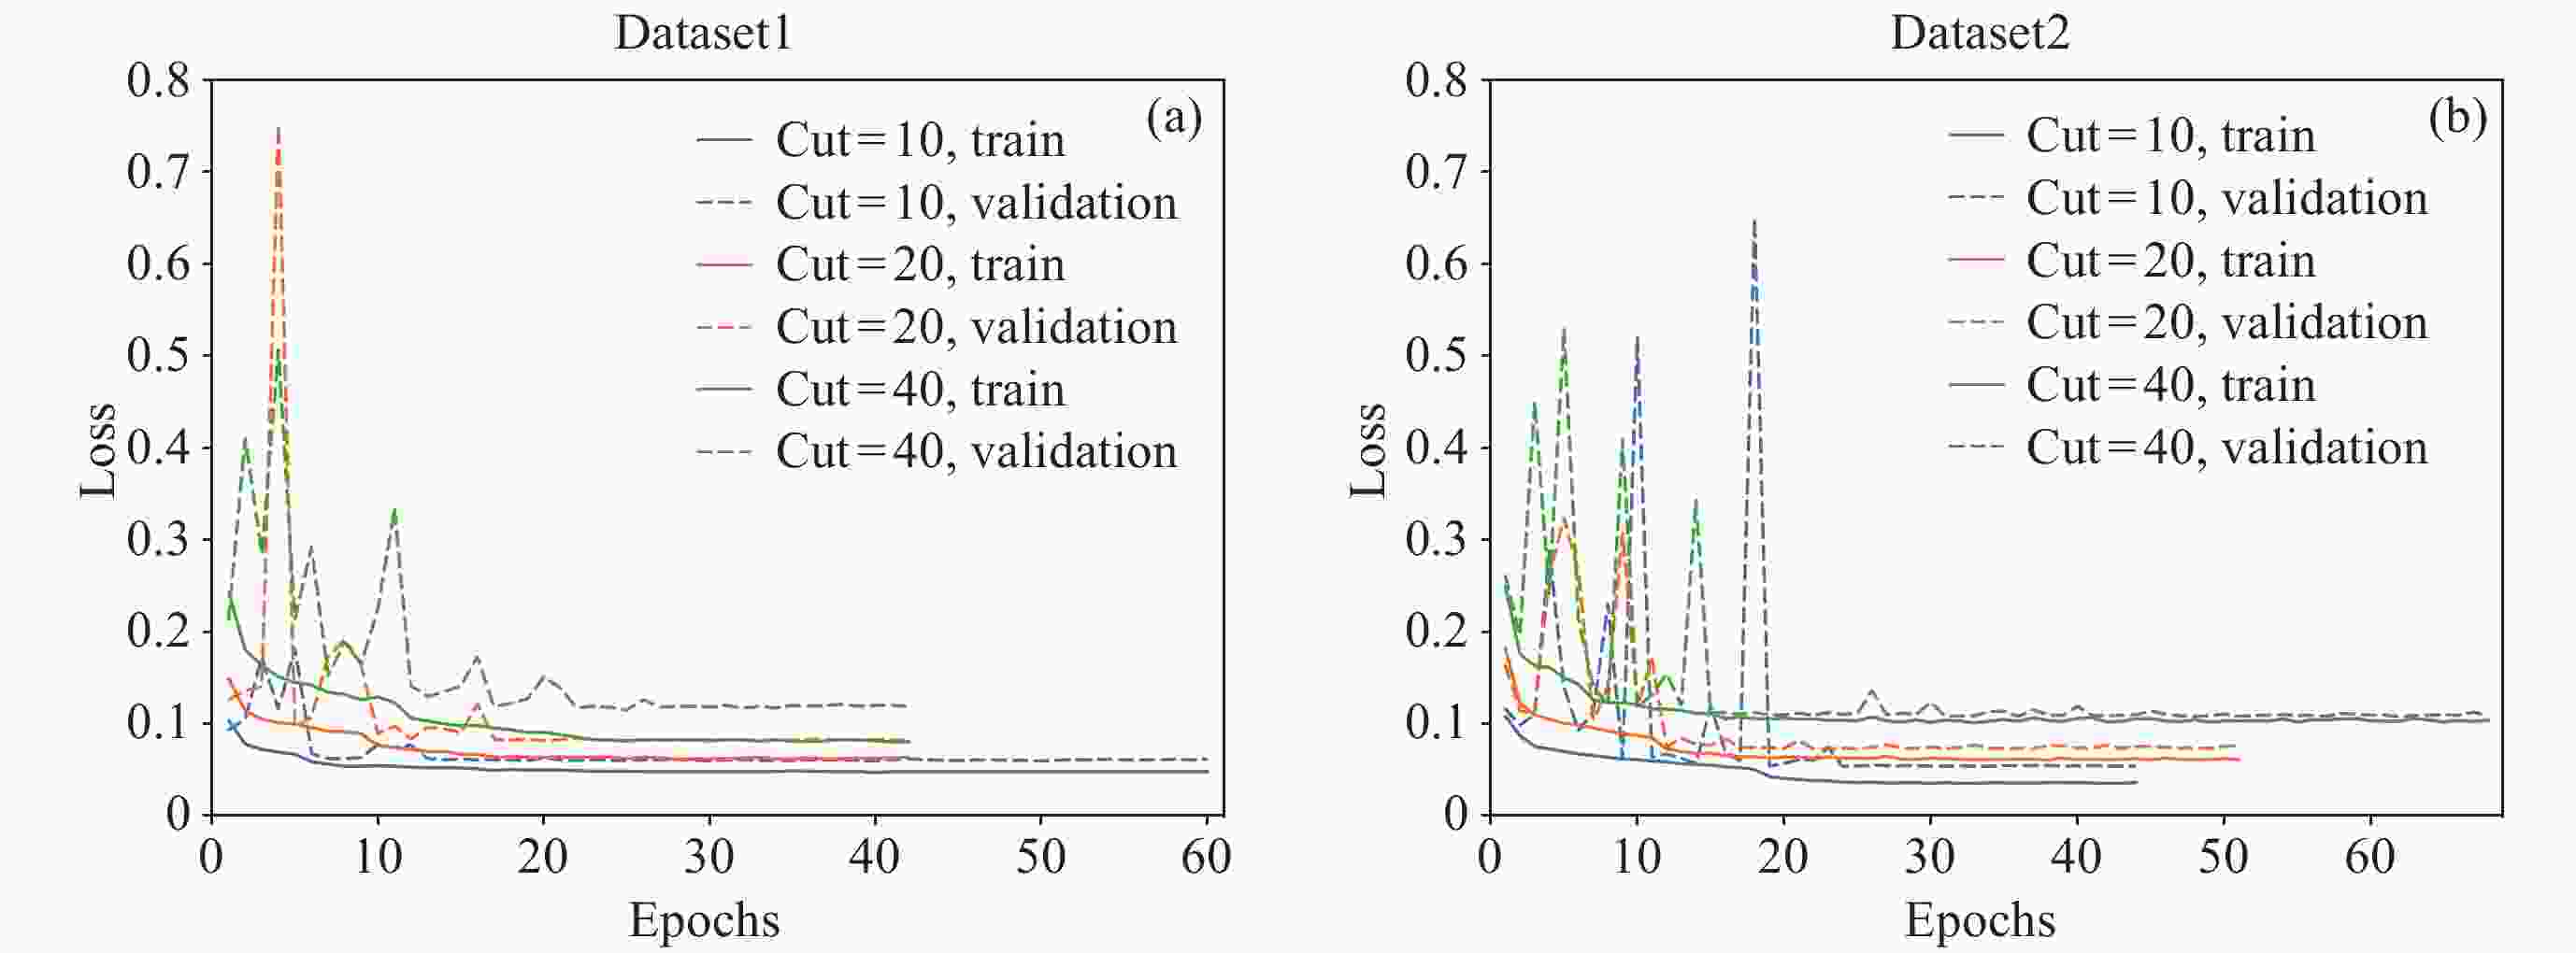
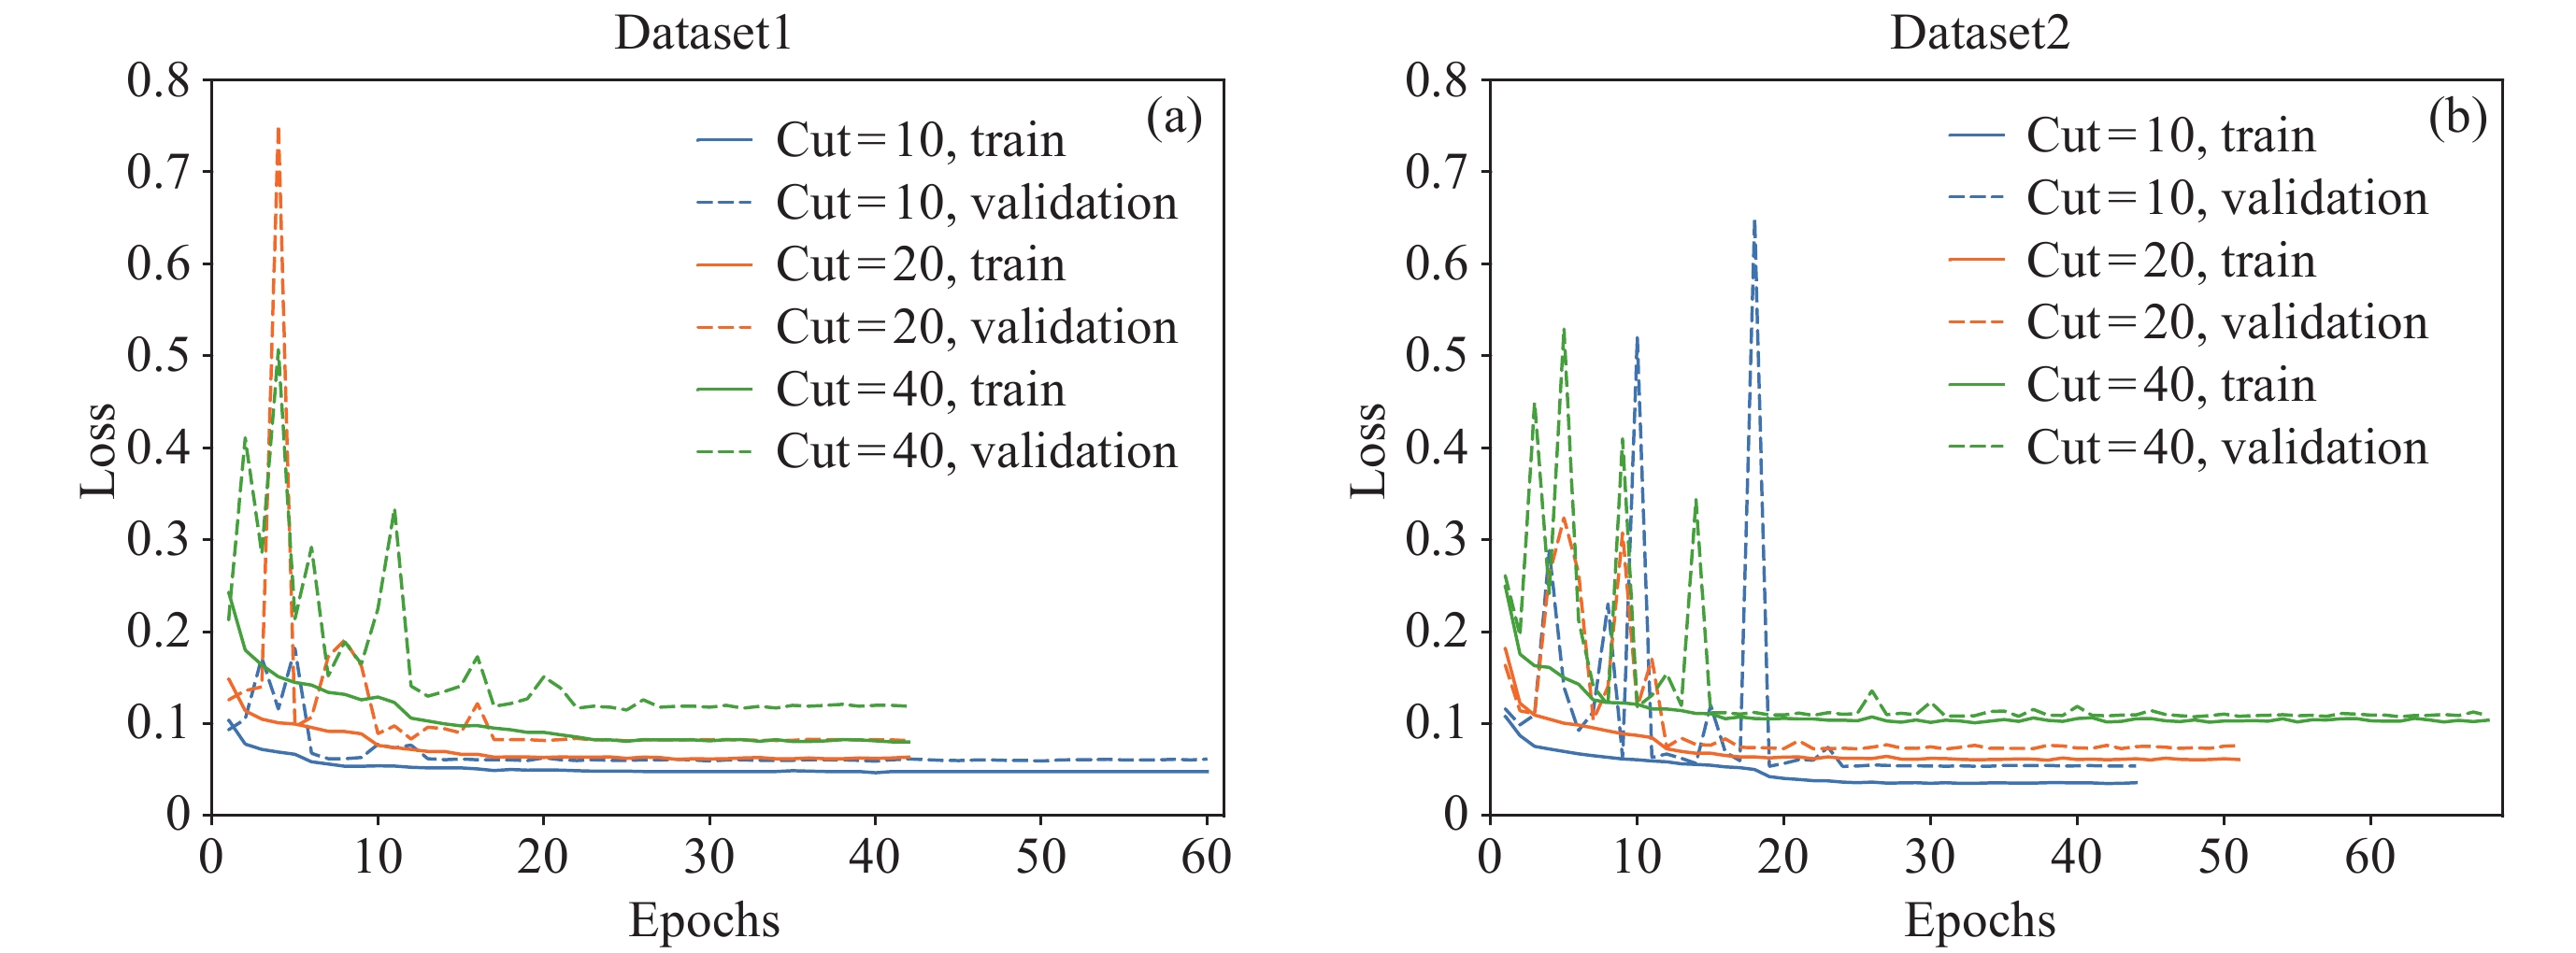
图 8 1D-ResCNN模型训练过程中的损失函数值变化
Figure 8. Variation of loss function value during the training process of 1D-ResCNN model
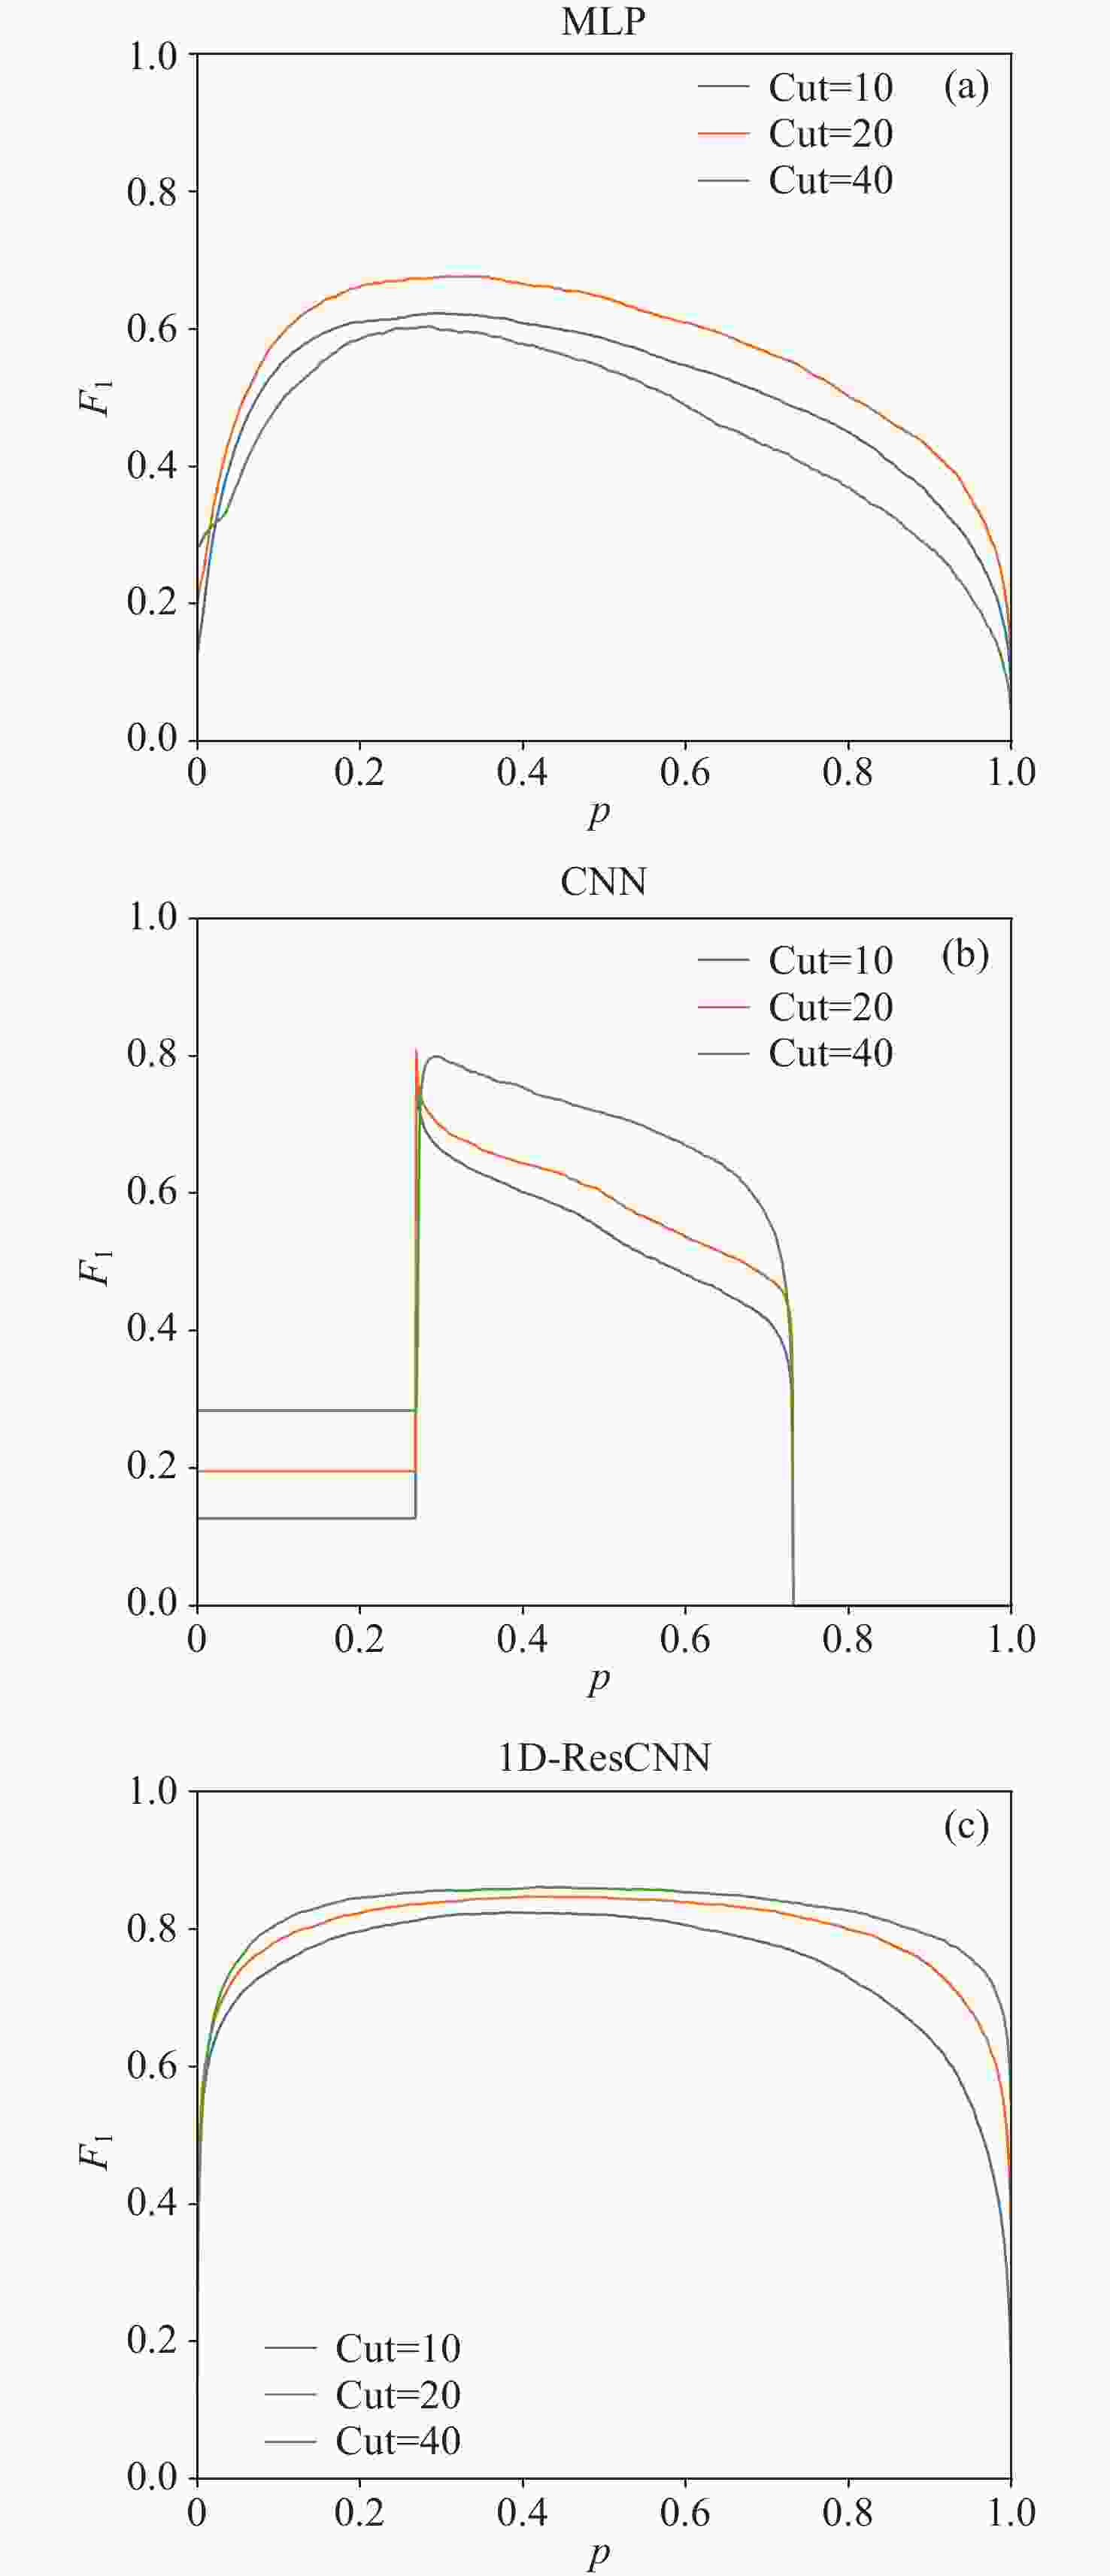
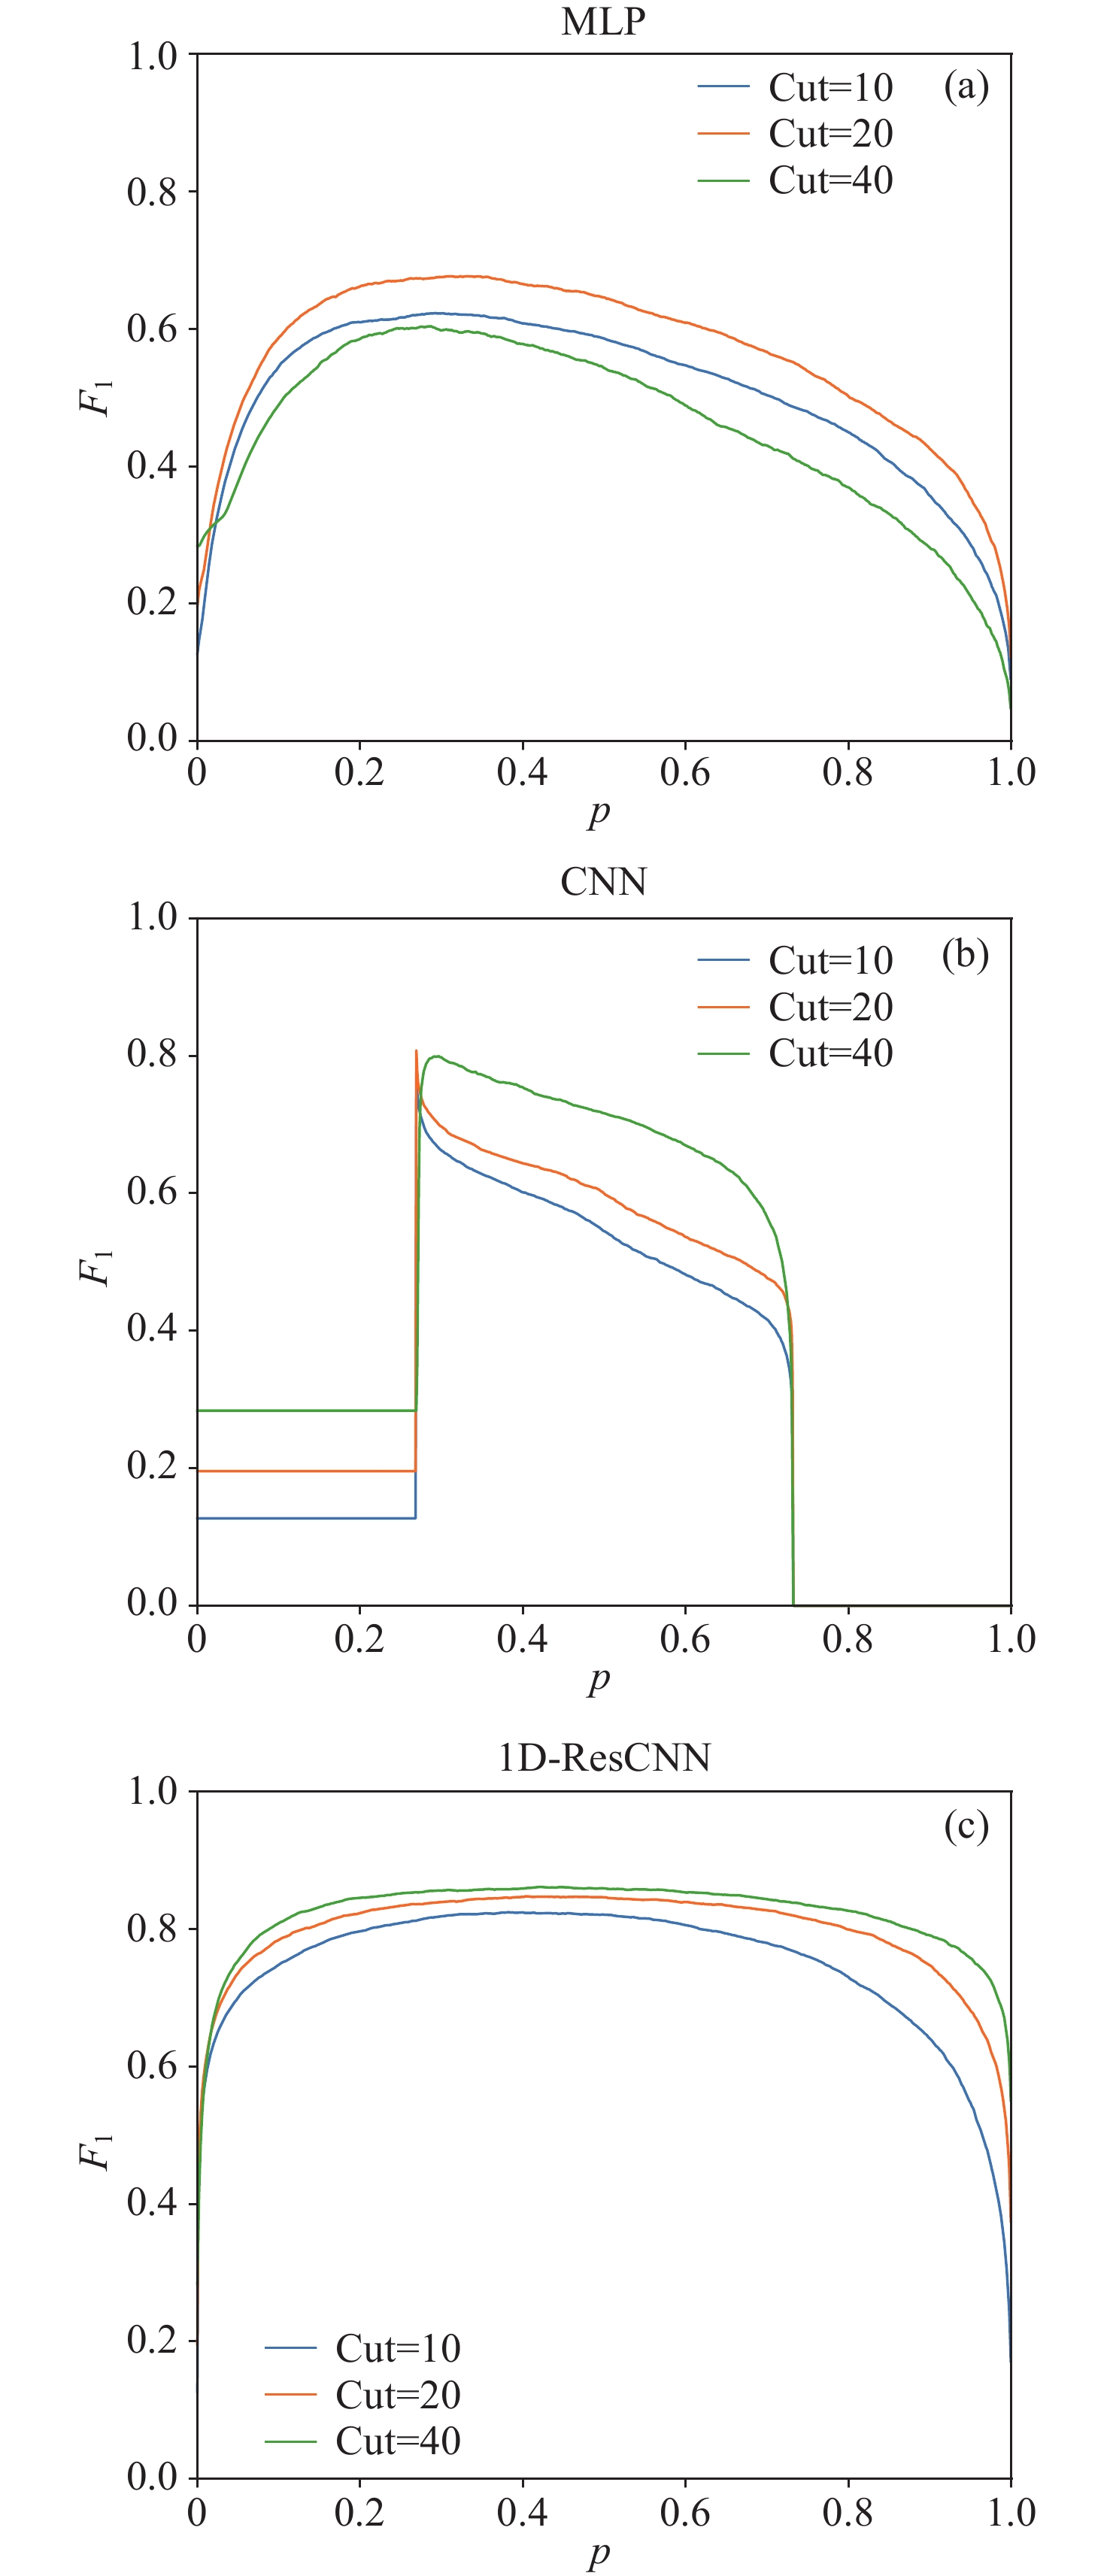
图 9 不同窗口长度和概率阈值$ p $的情况下三种模型在验证集上的$ {F}_{1} $值
Figure 9. $ {F}_{1} $-score of different models on validation datasets with different window cut and threshold $ p $
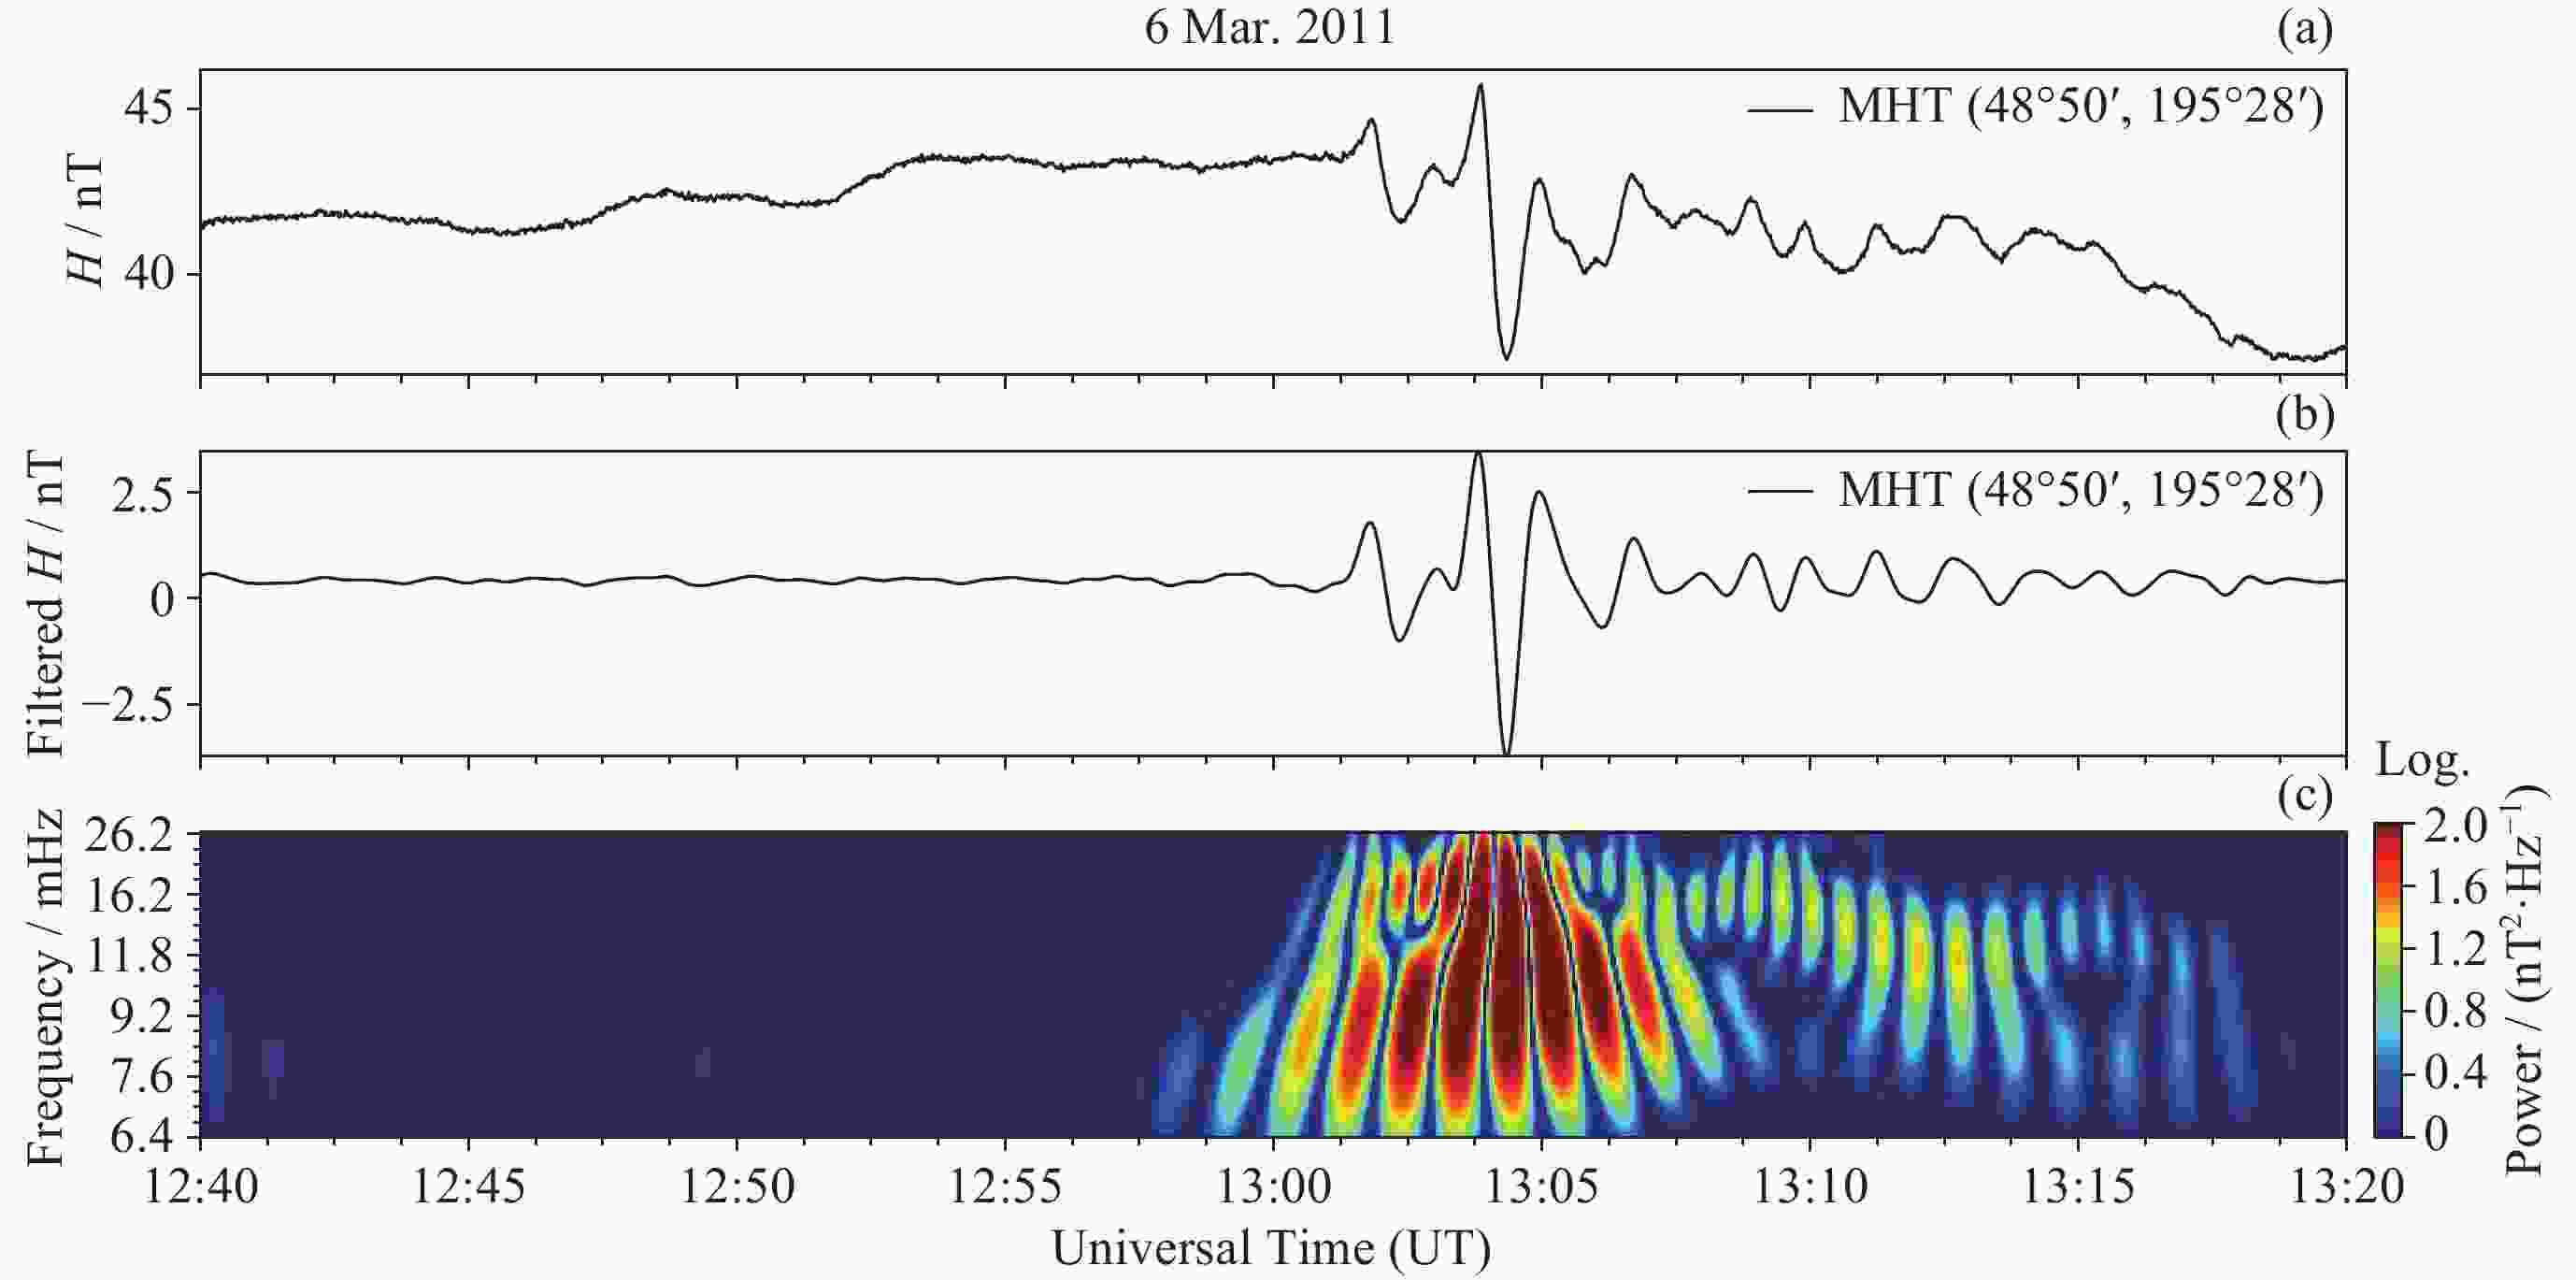
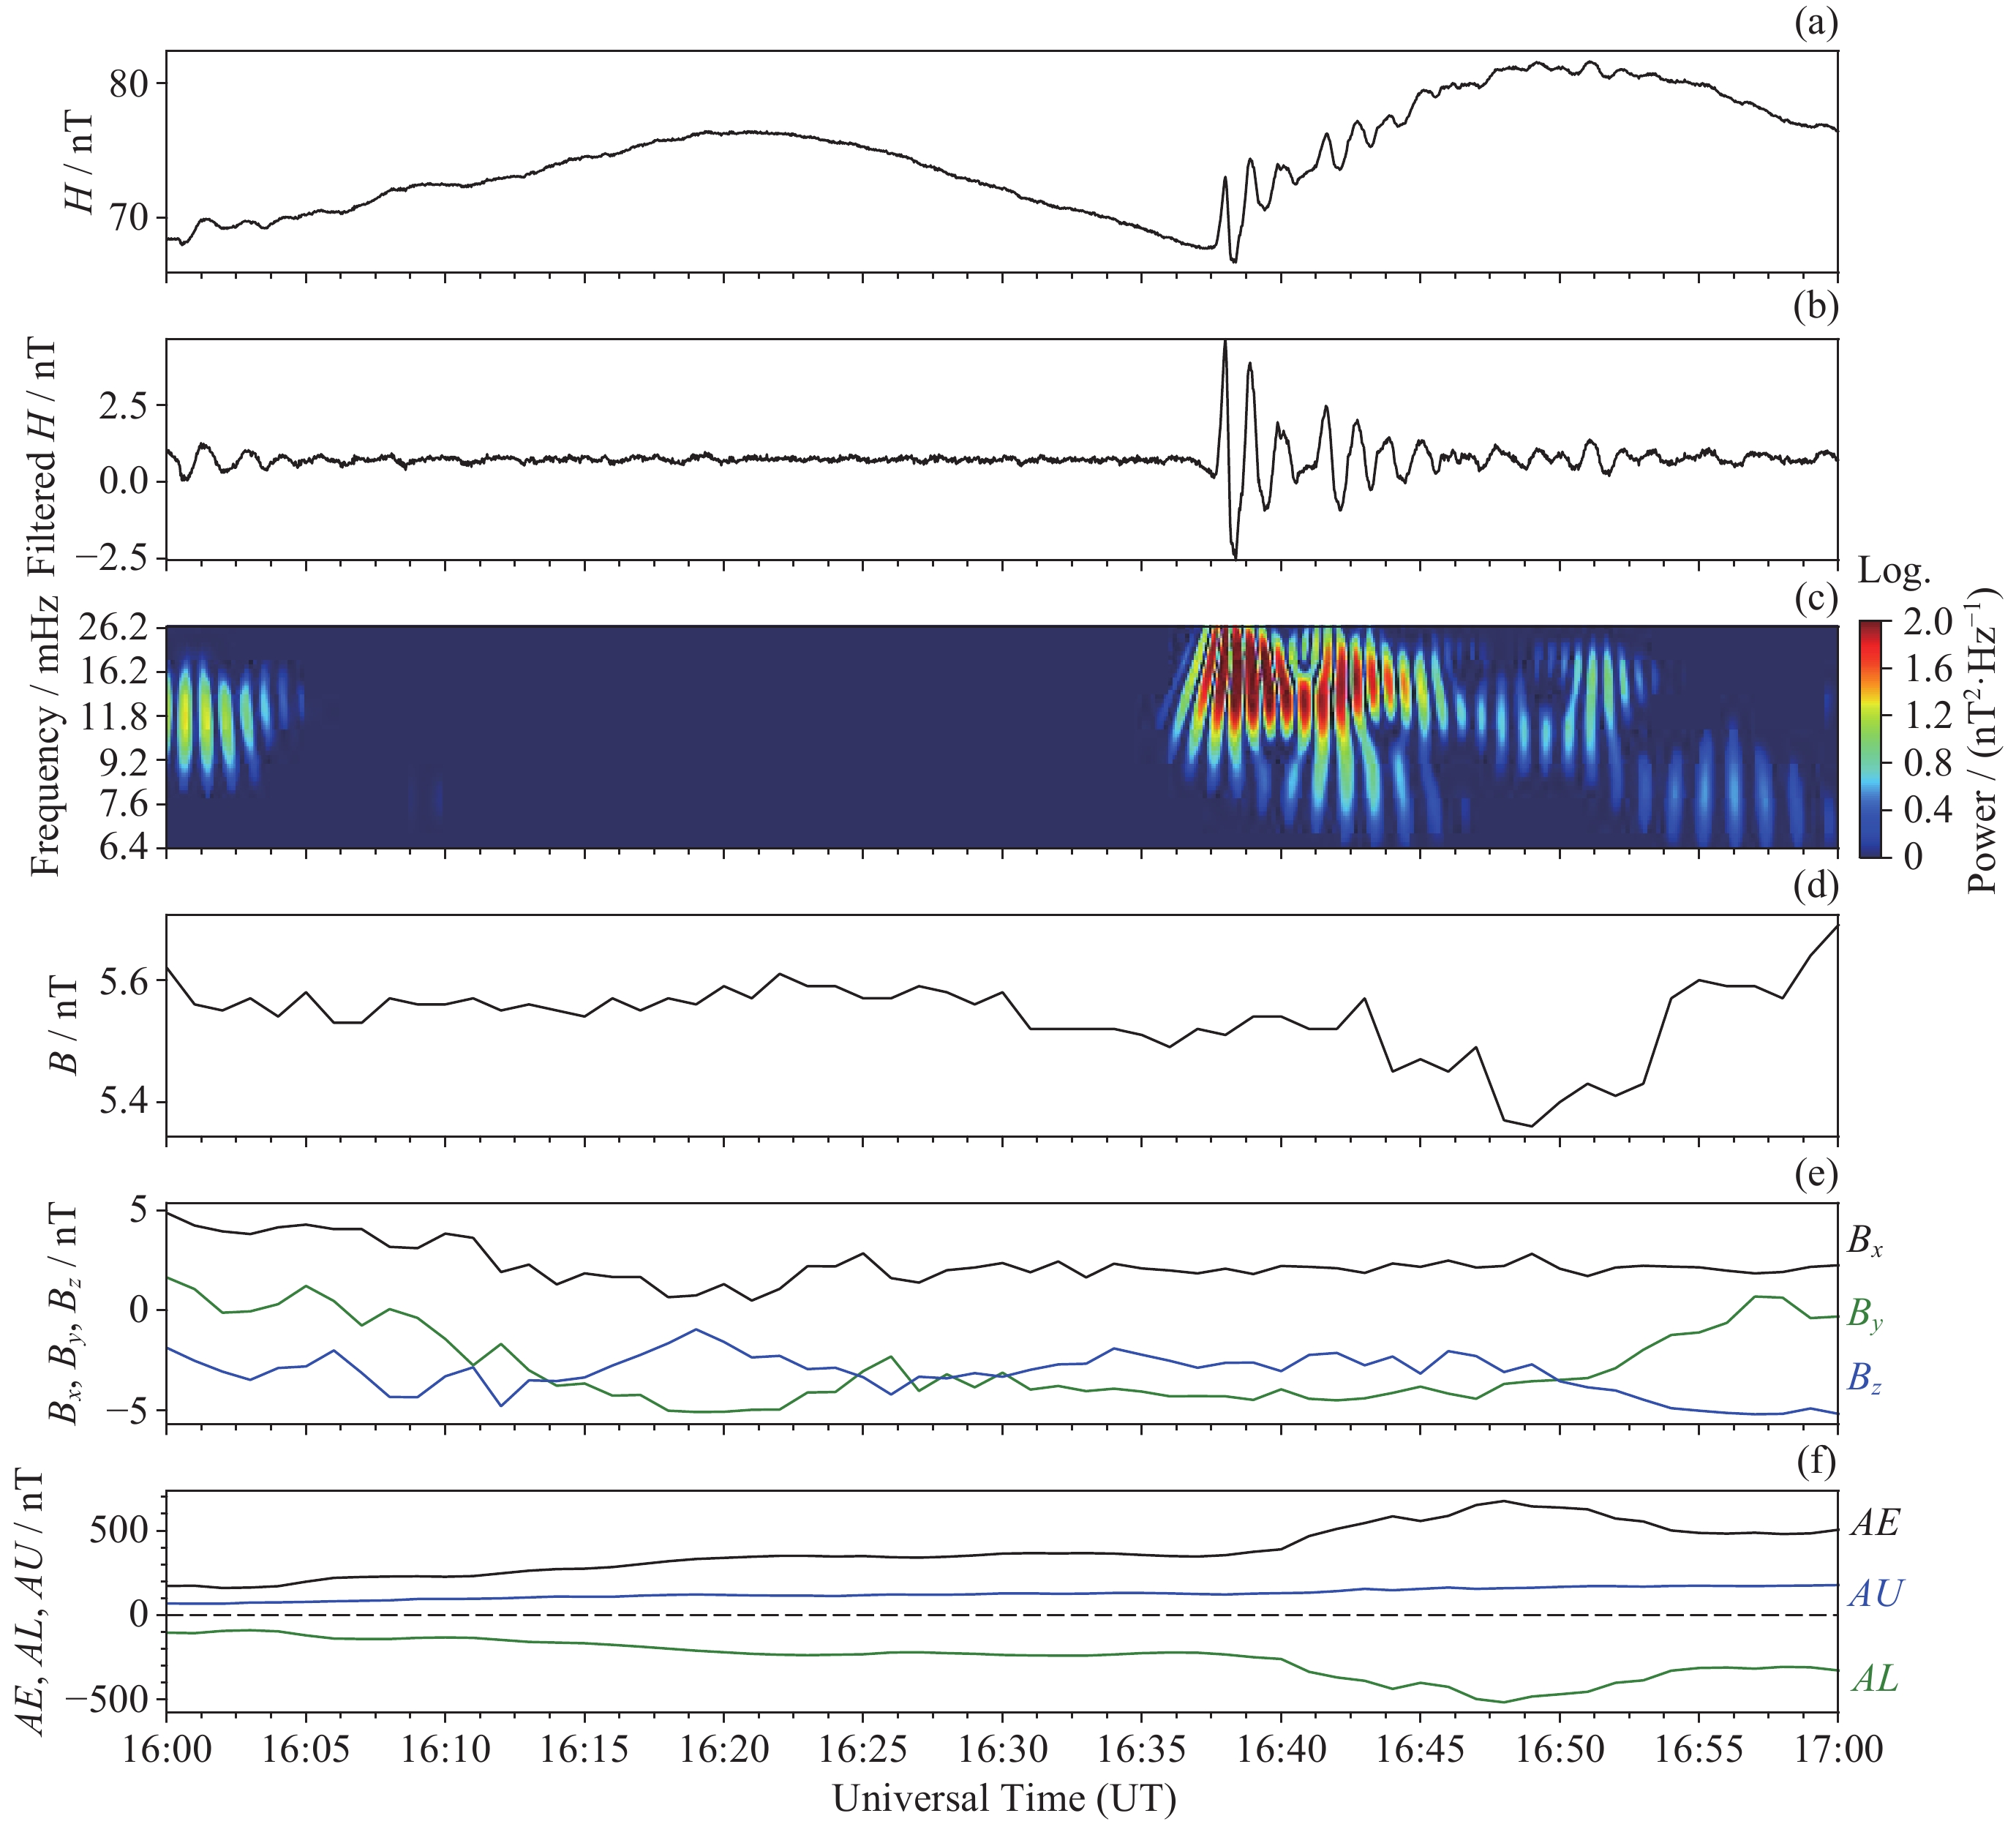
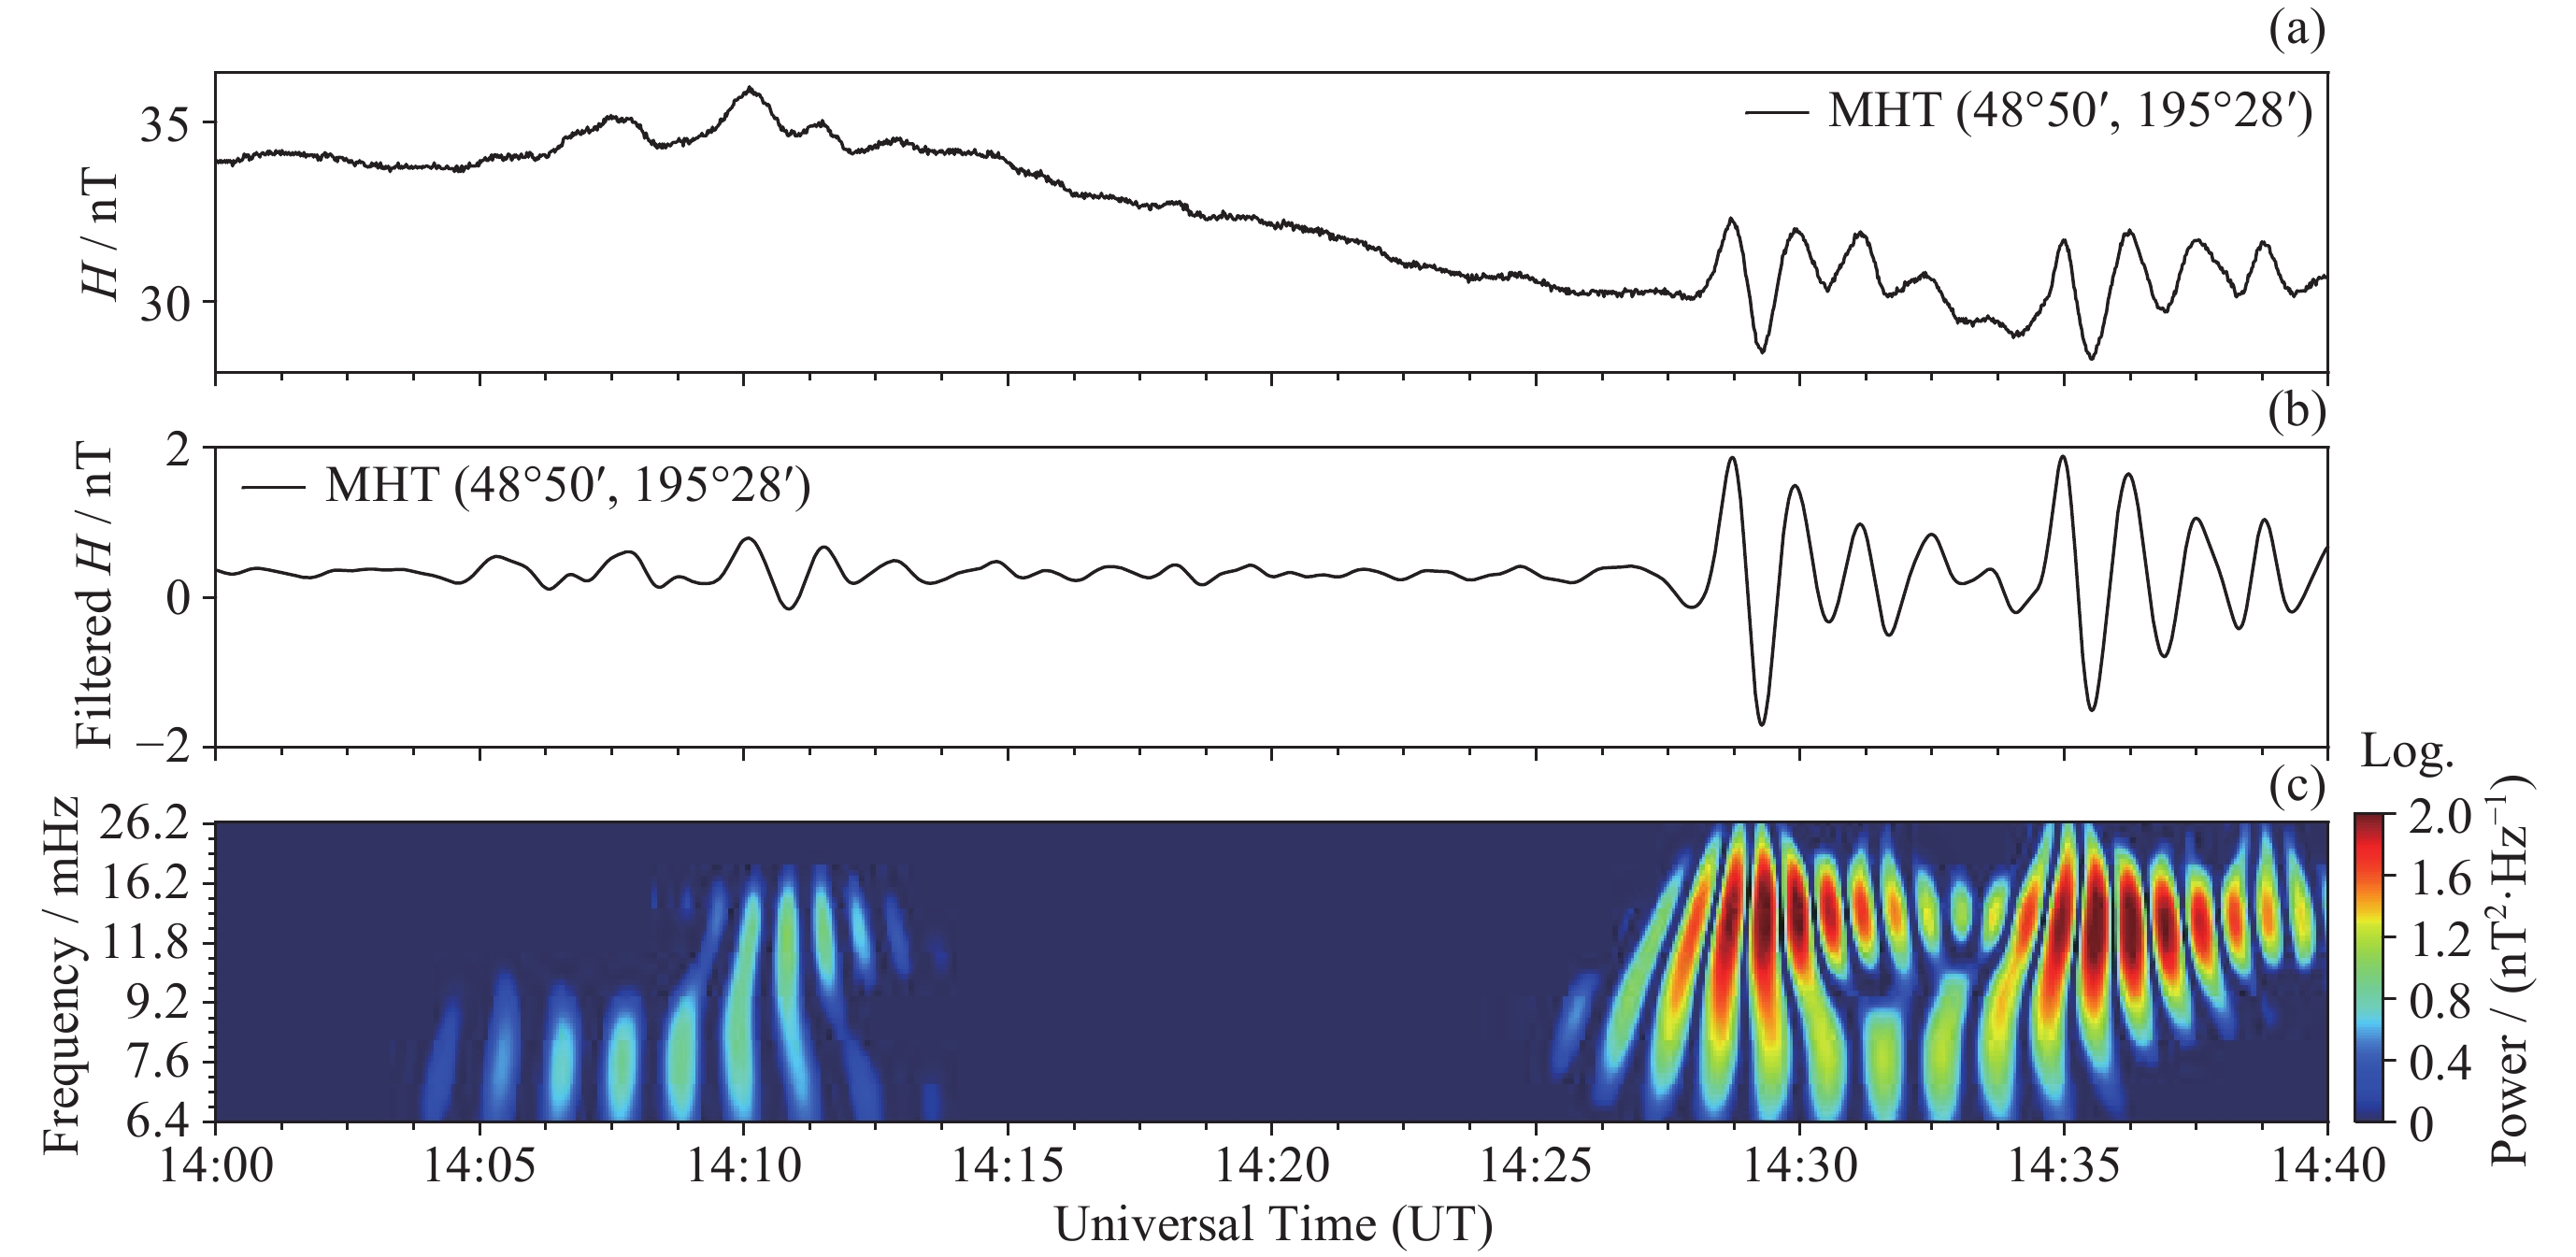
图 10 1D-ResCNN模型正确识别出的孤立Pi2脉动
Figure 10. Isolated Pi2 pulsation correctly identified by 1D-ResCNN
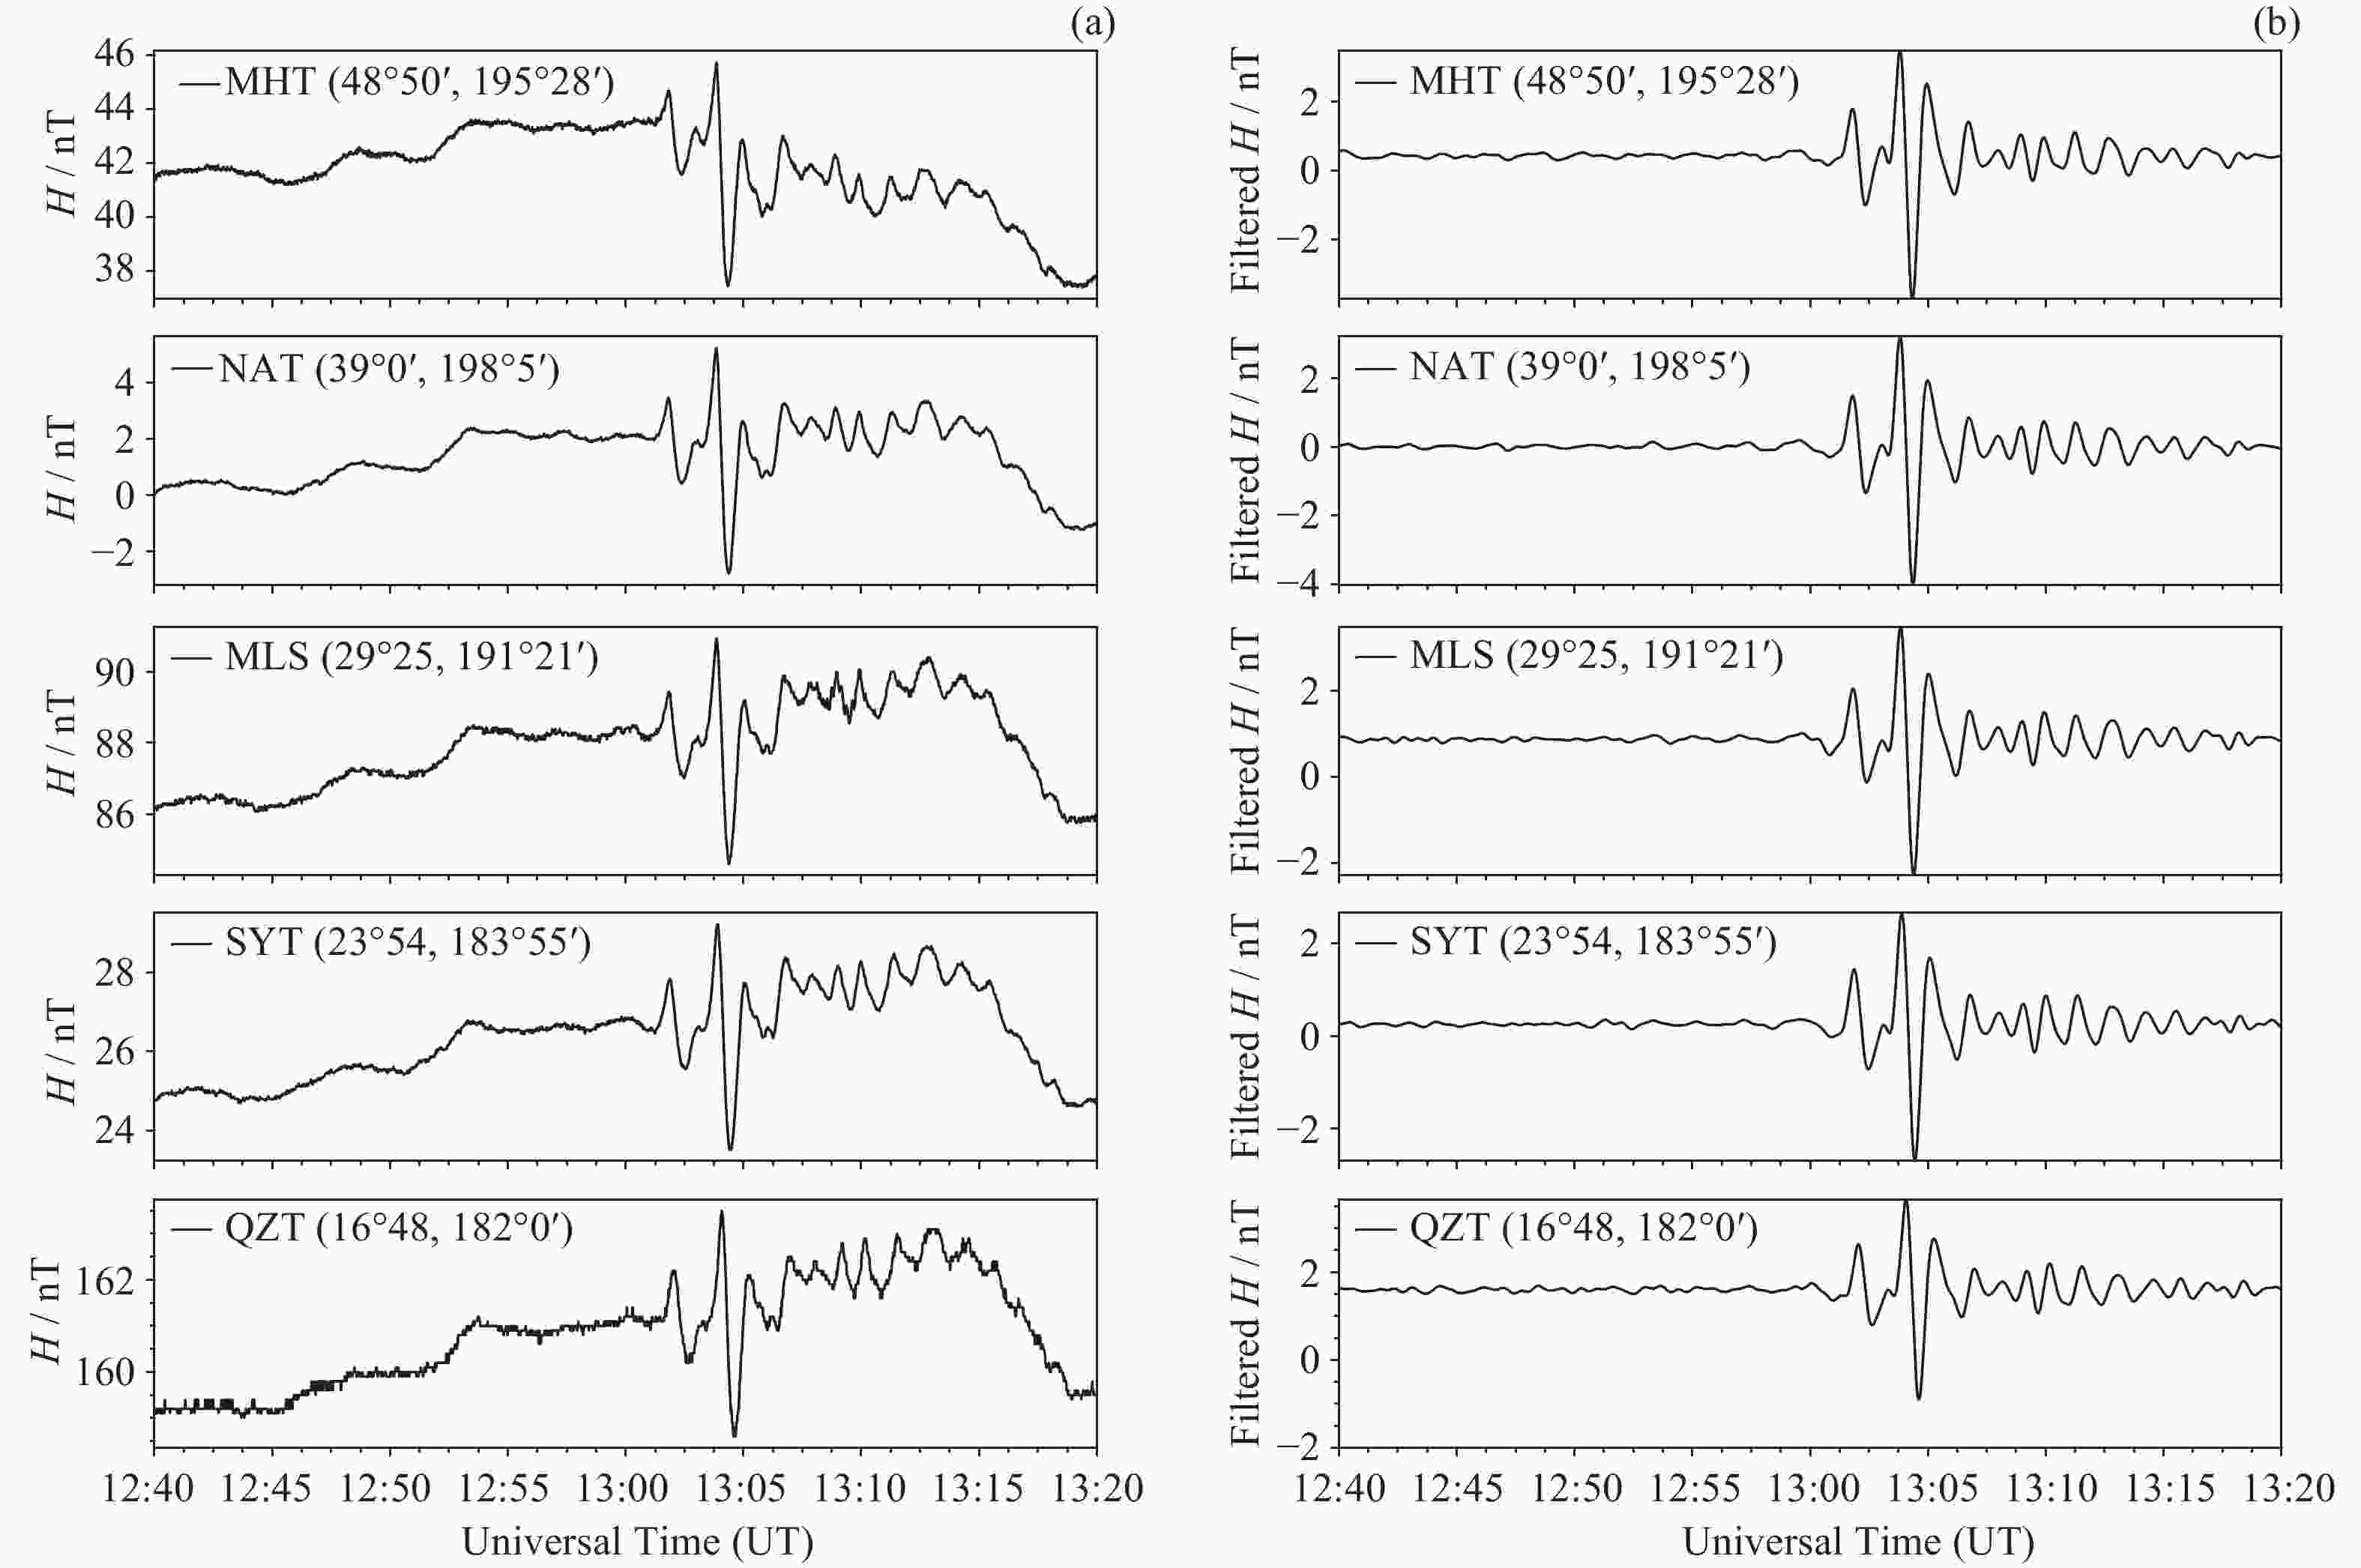
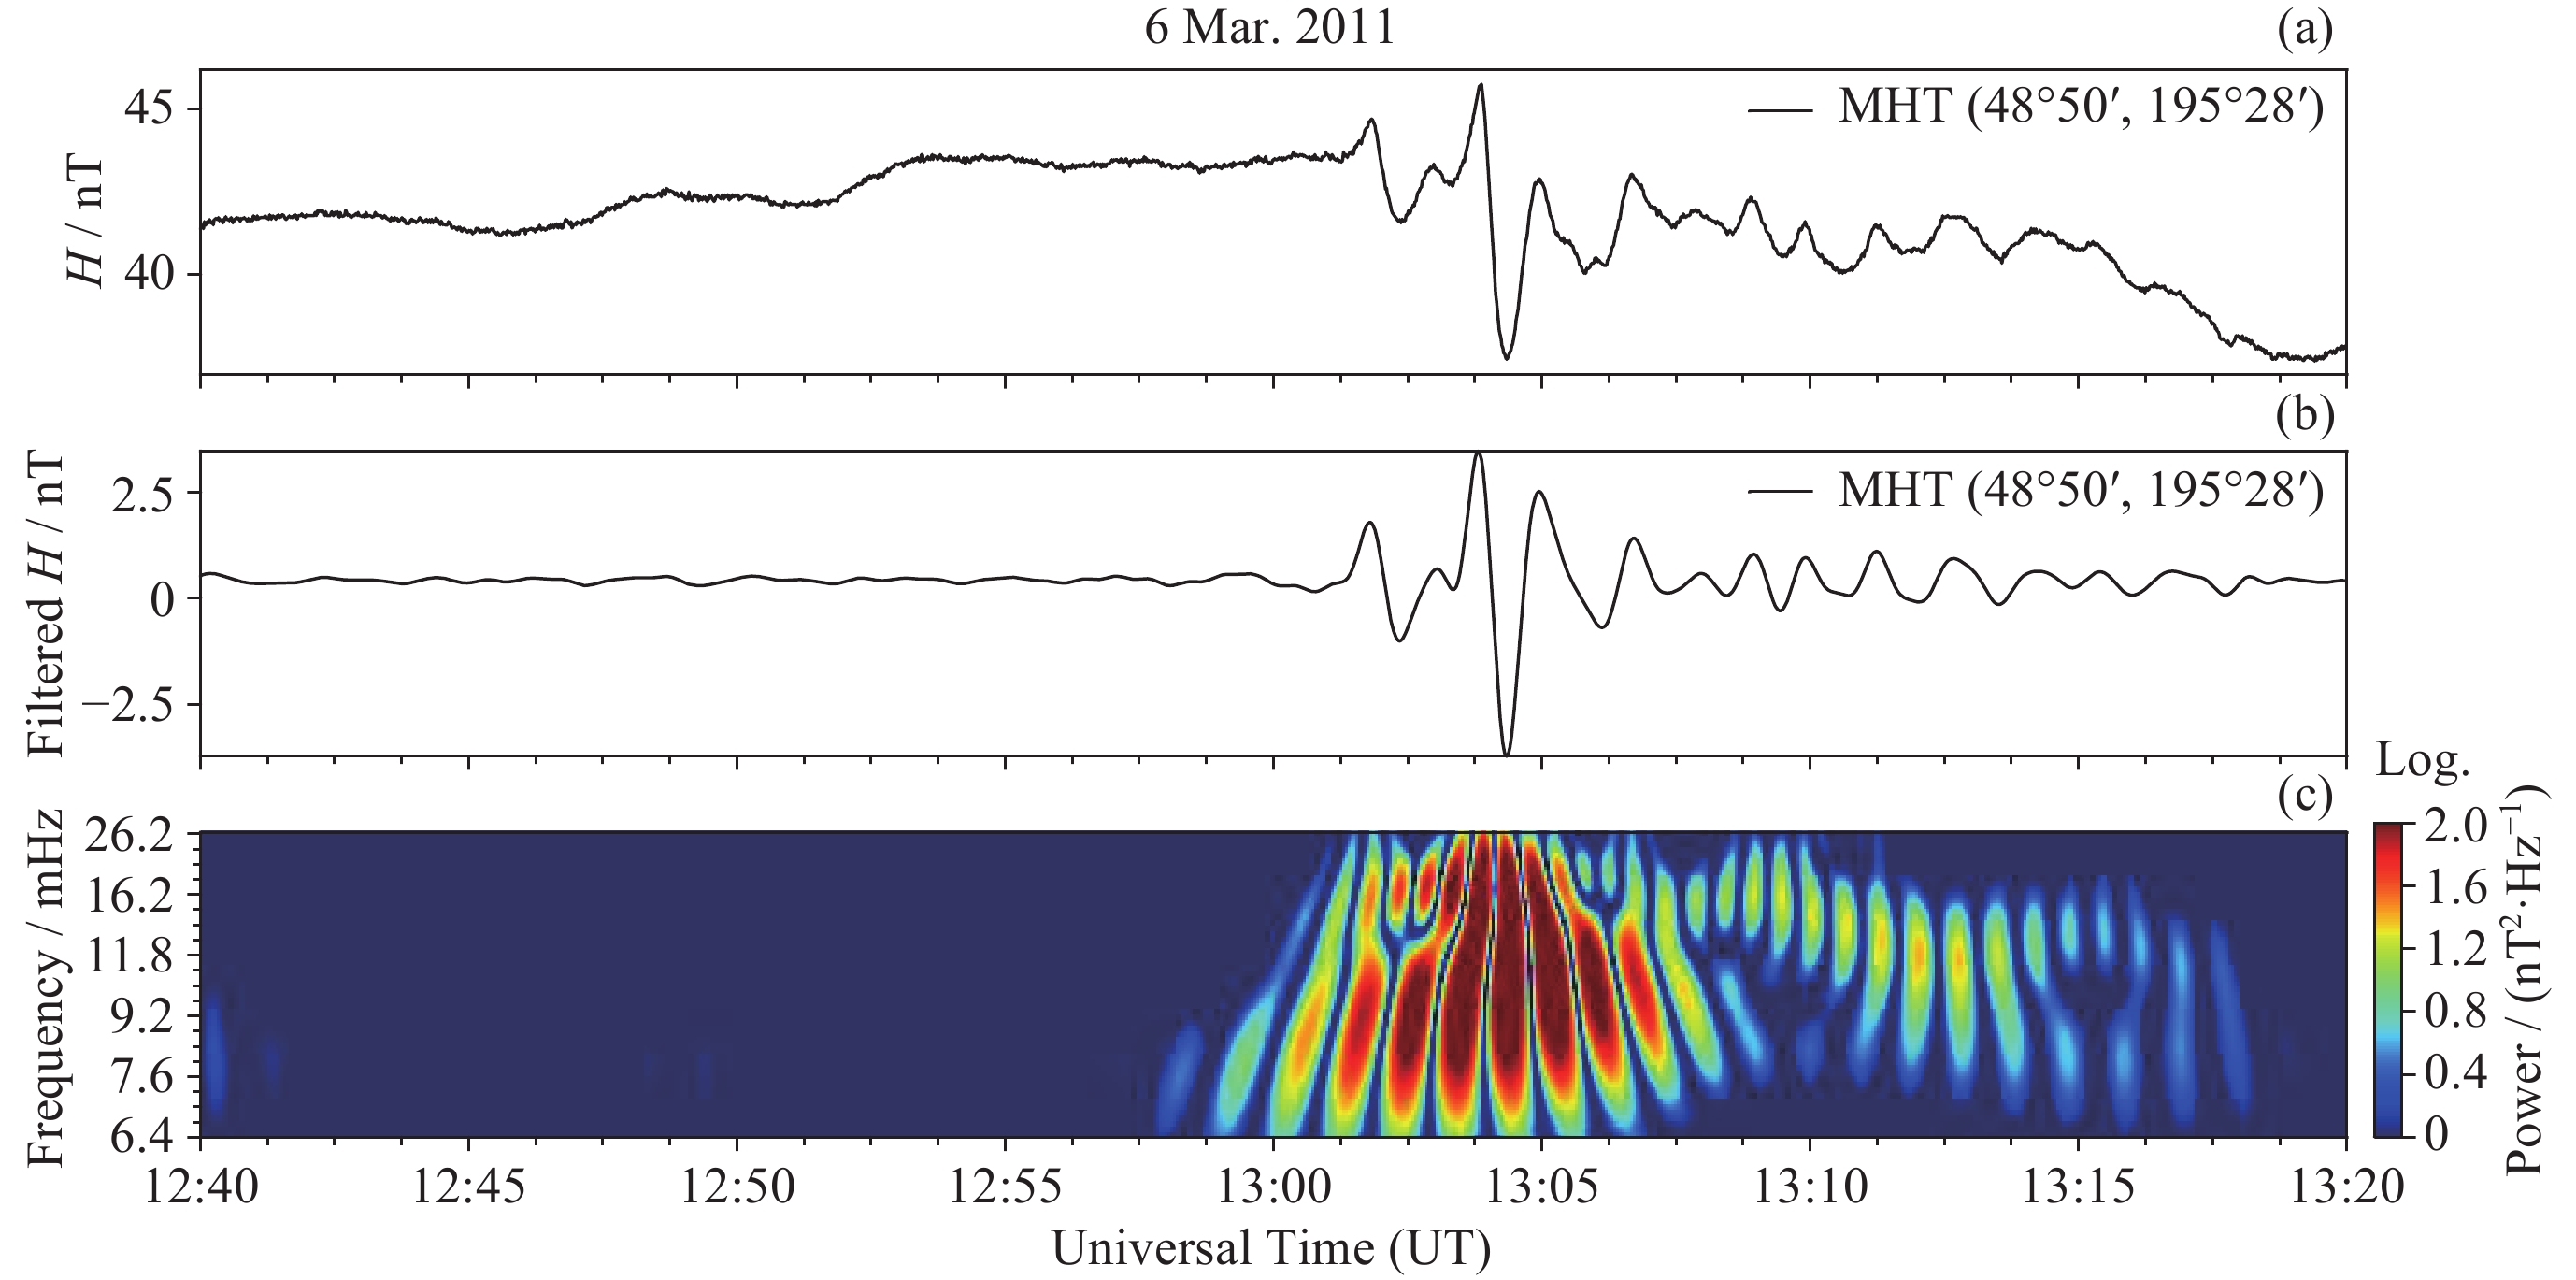
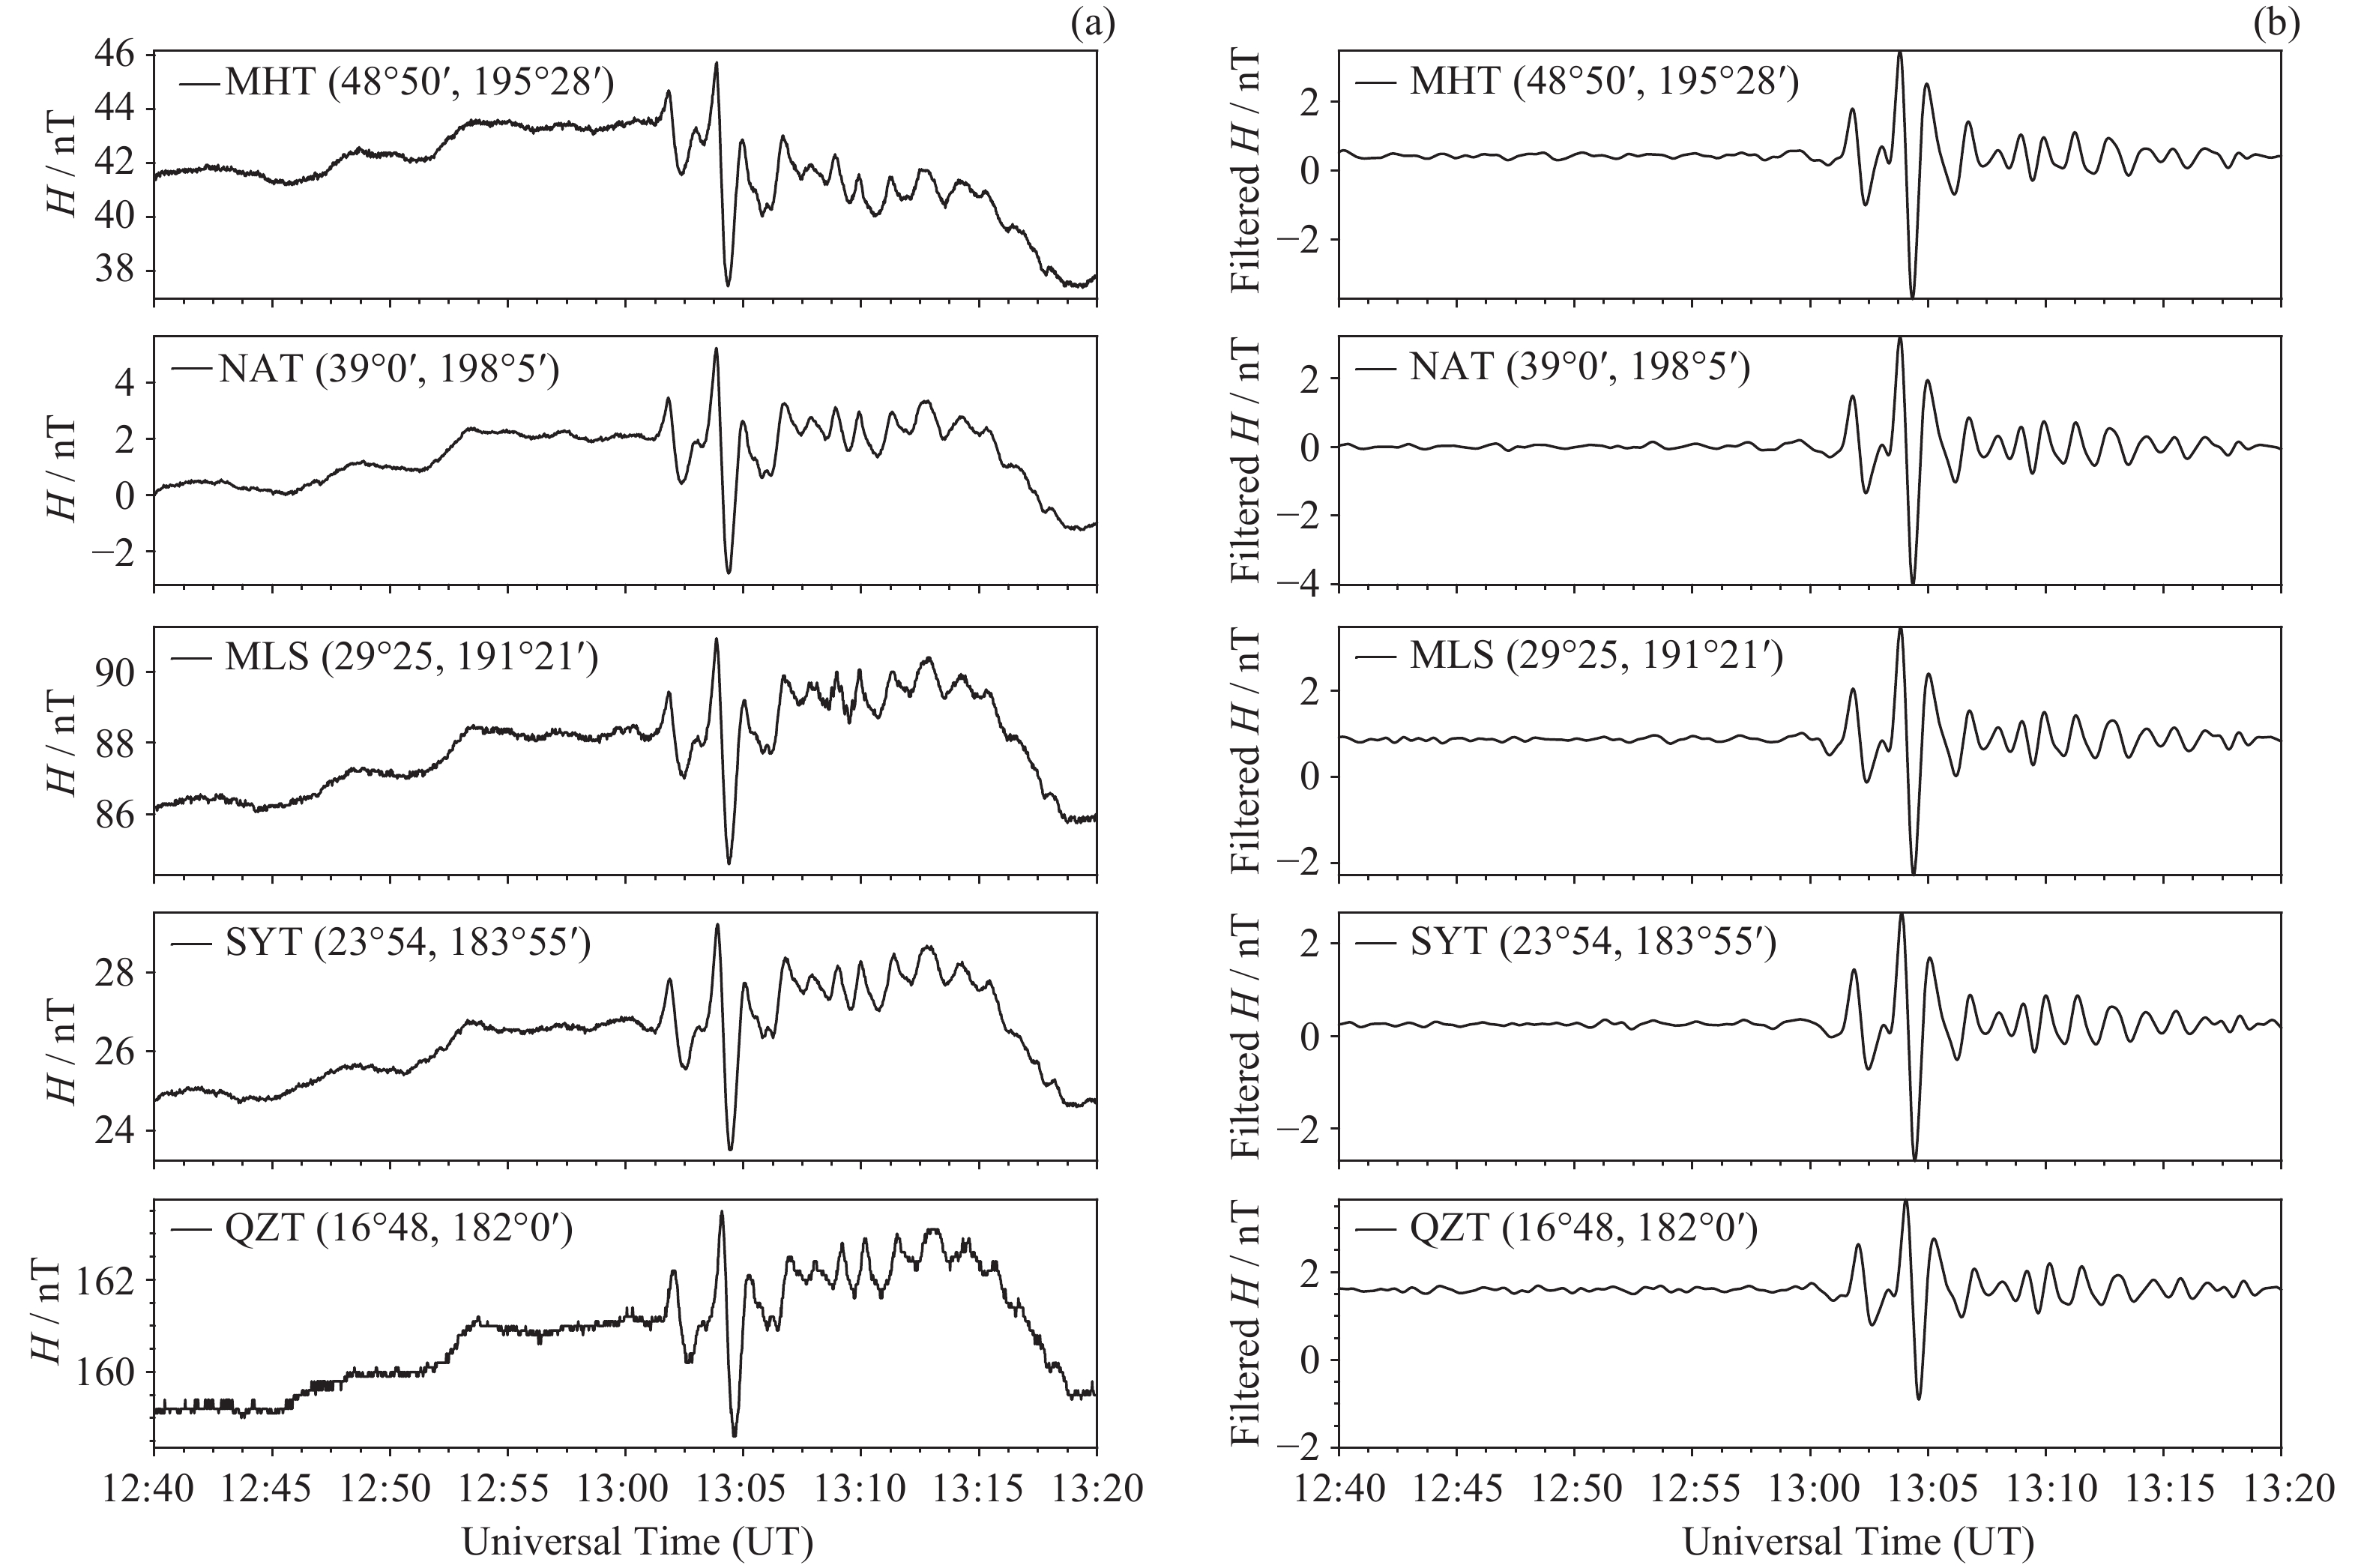
图 11 2011年3月6日12:40 UT-13:20 UT期间5个台站的磁力仪观测数据
Figure 11. Magnetometer data of five stations during 12:40 UT-13:20 UT on 6 March 2011

图 12 1D-ResCNN模型正确识别出的连续Pi2脉动
Figure 12. Cyclic Pi2 pulsation correctly identified by 1D-ResCNN
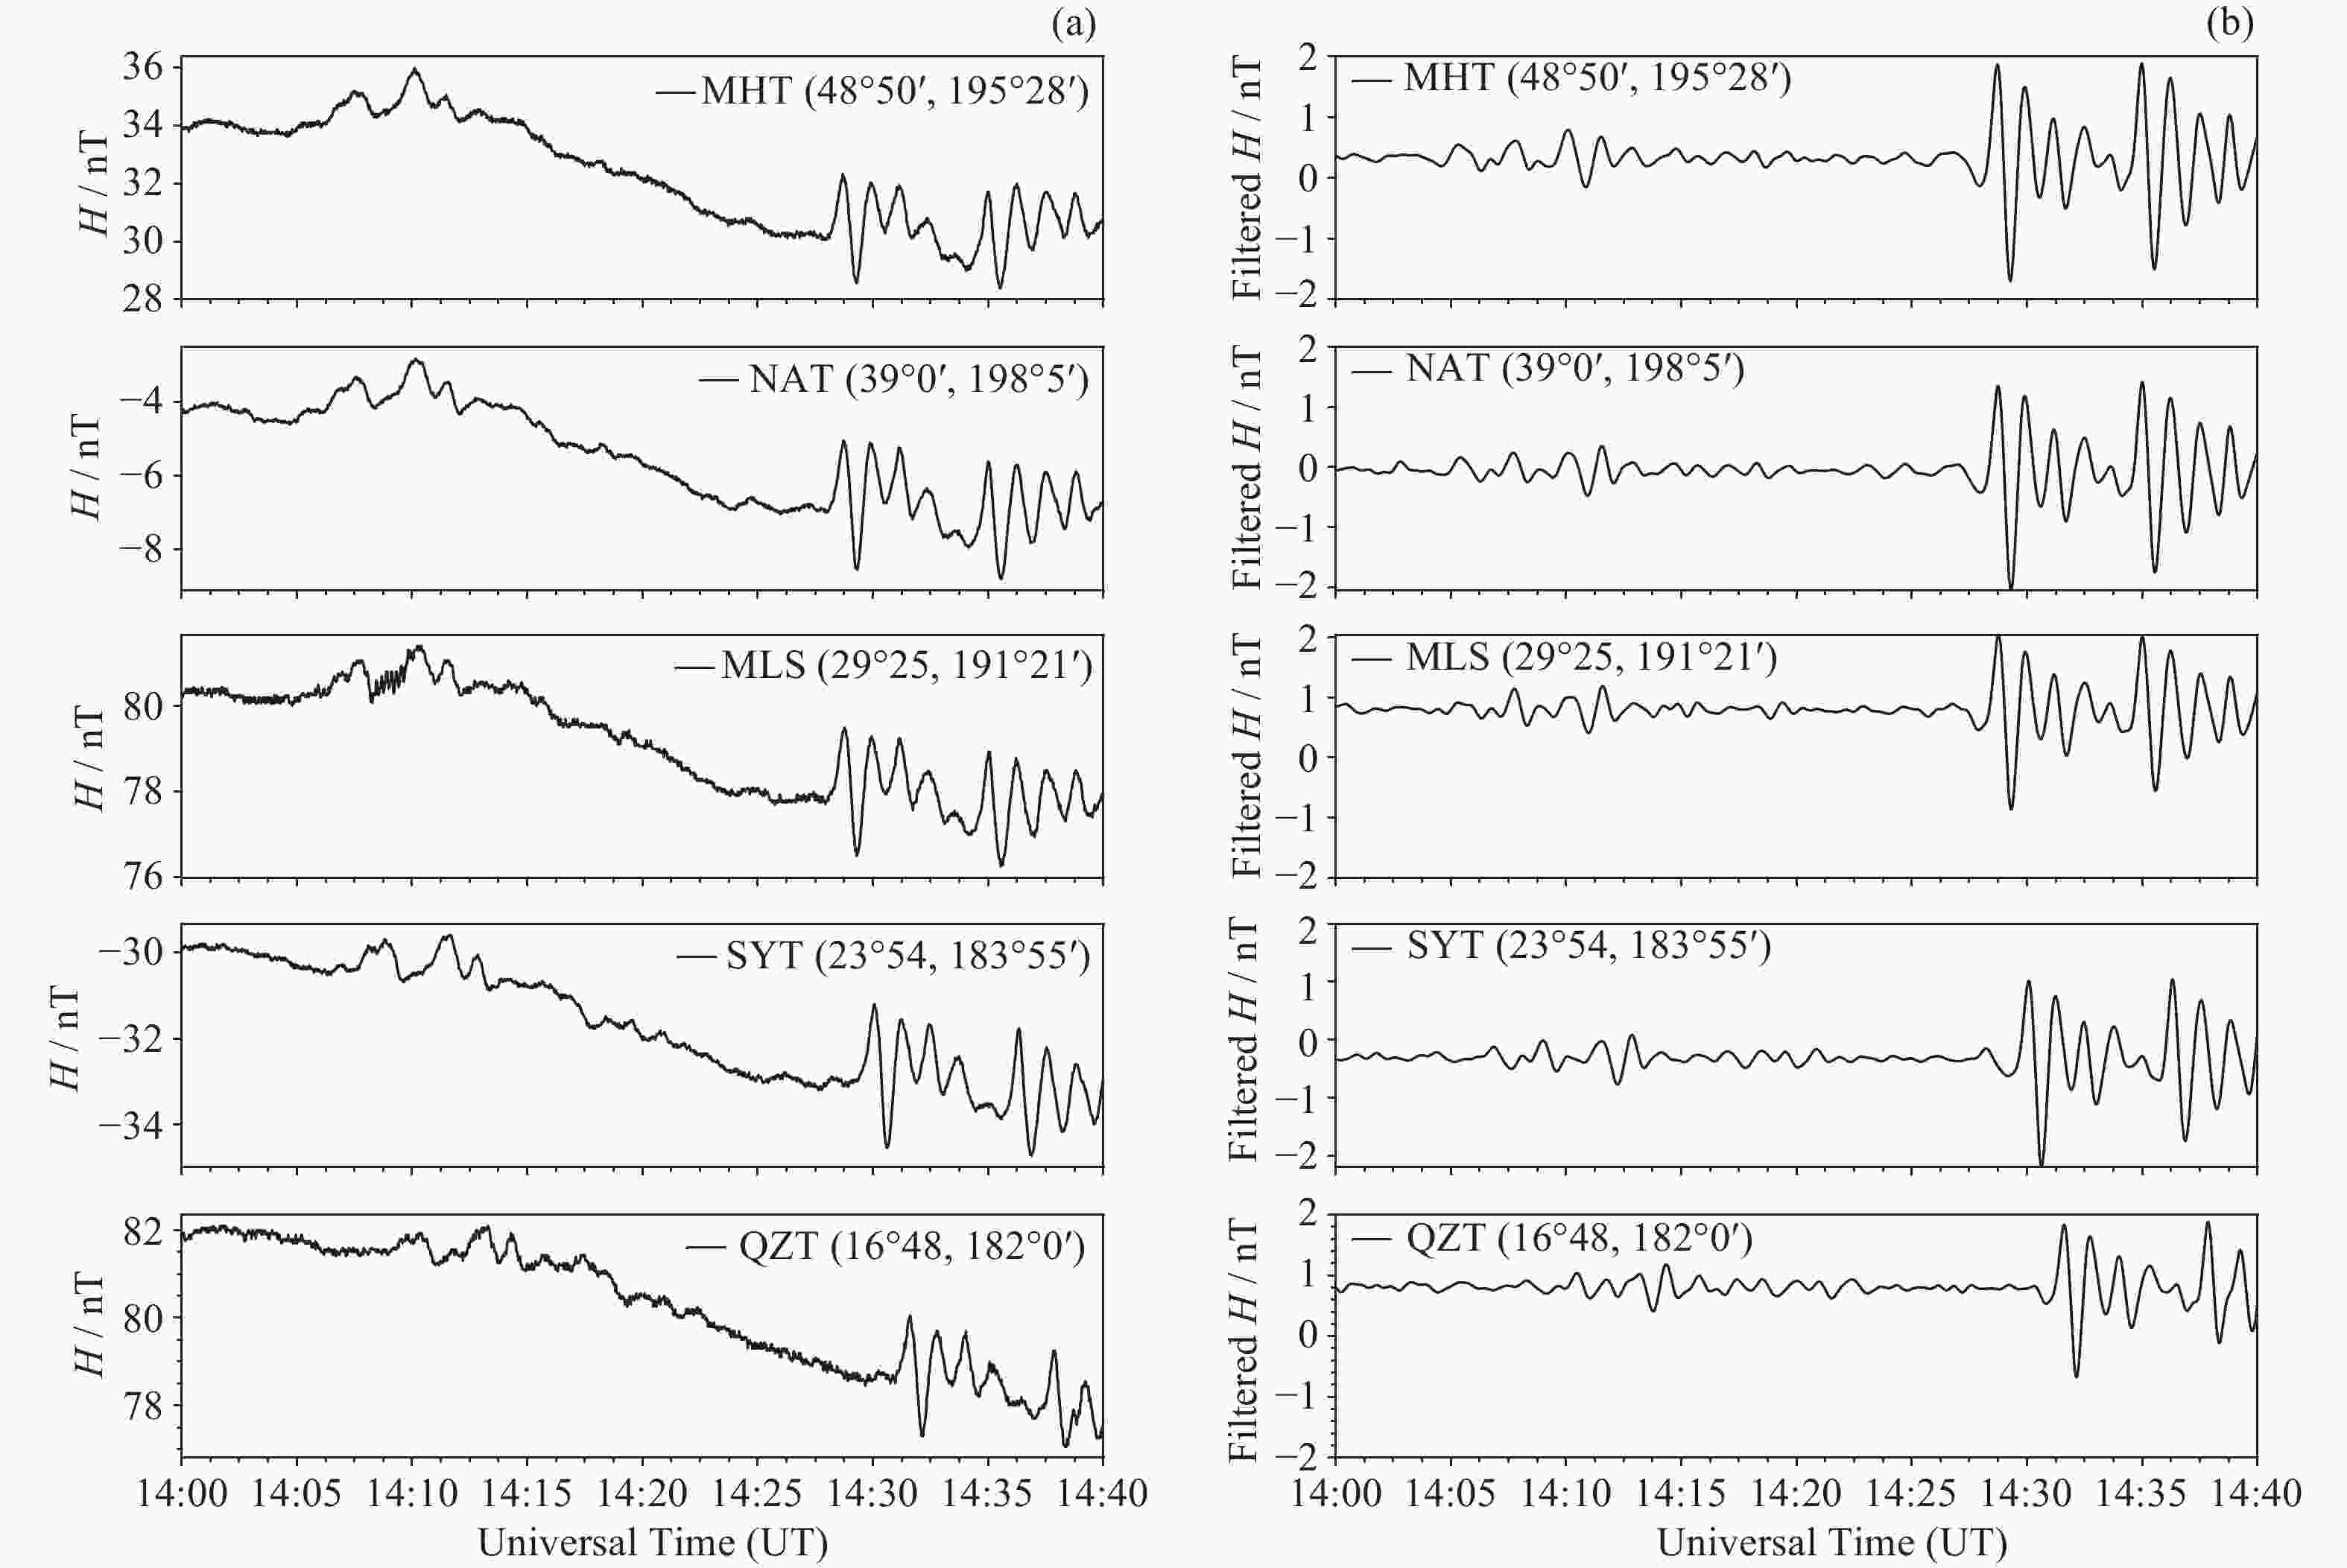
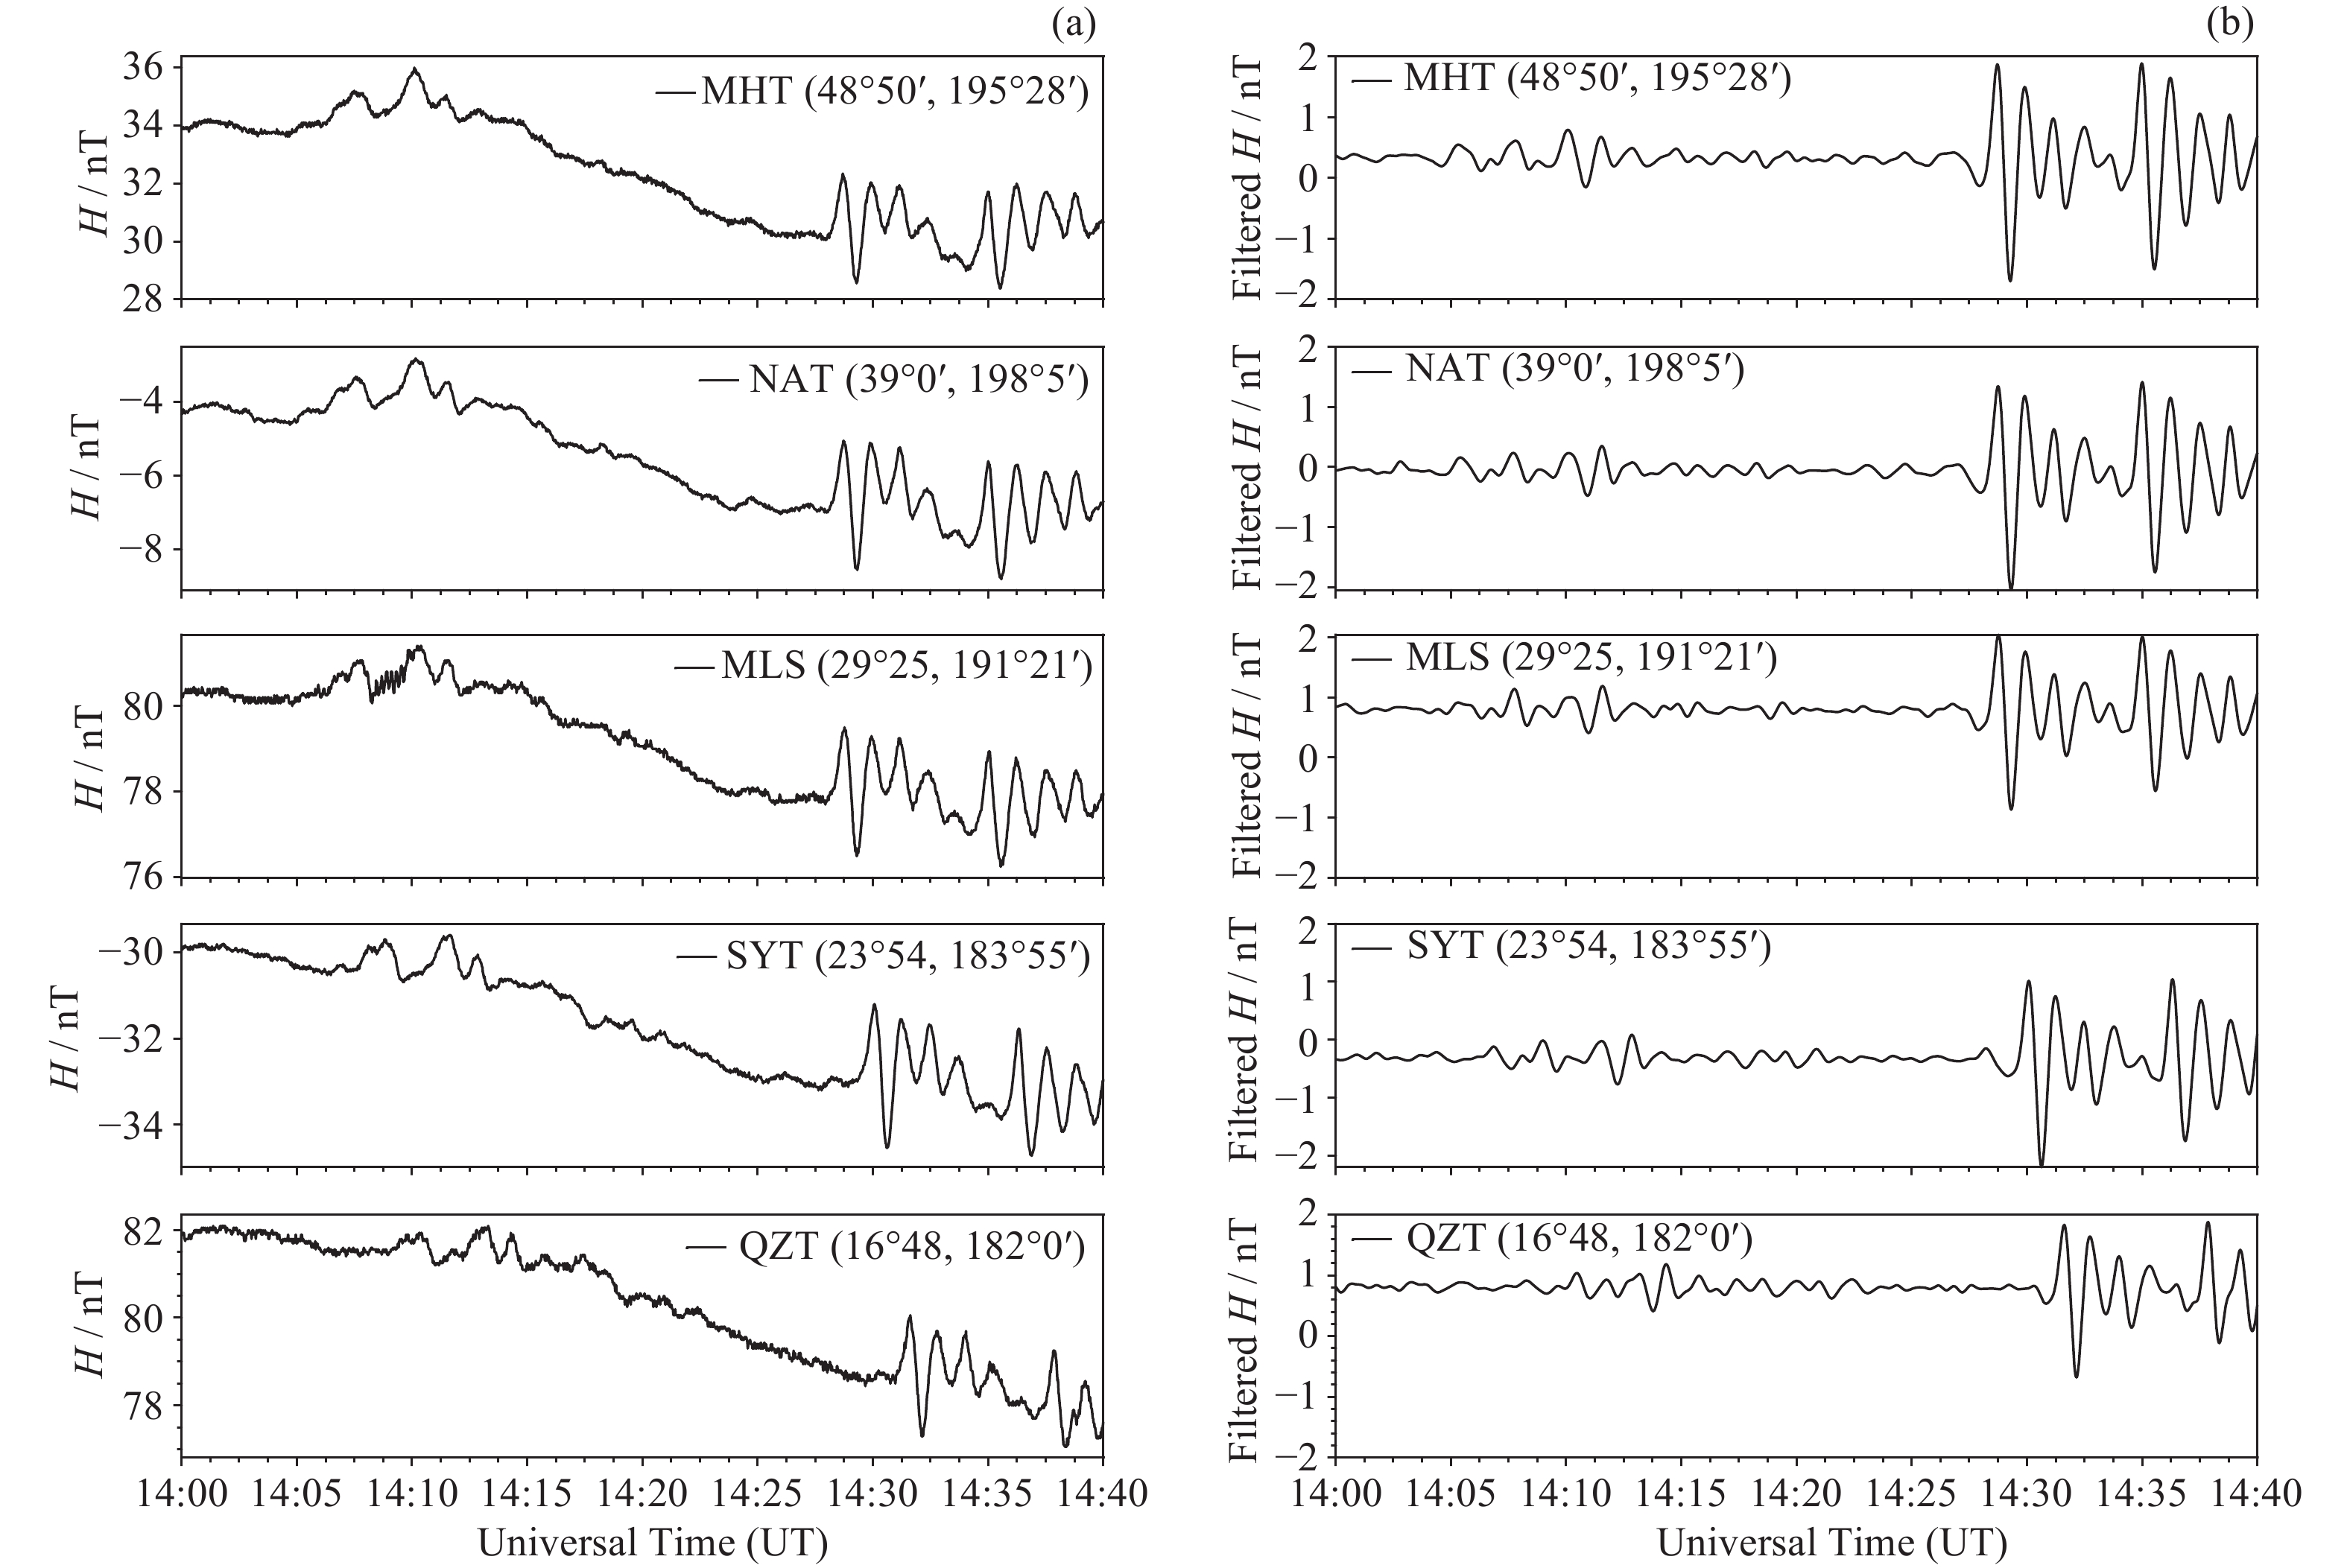
图 13 2011年1月21日14:00 UT-14:40 UT期间五个台站的磁力仪观测数据
Figure 13. Magnetometer data of five stations during 14:00 UT-14:40 UT on 21 January 2011
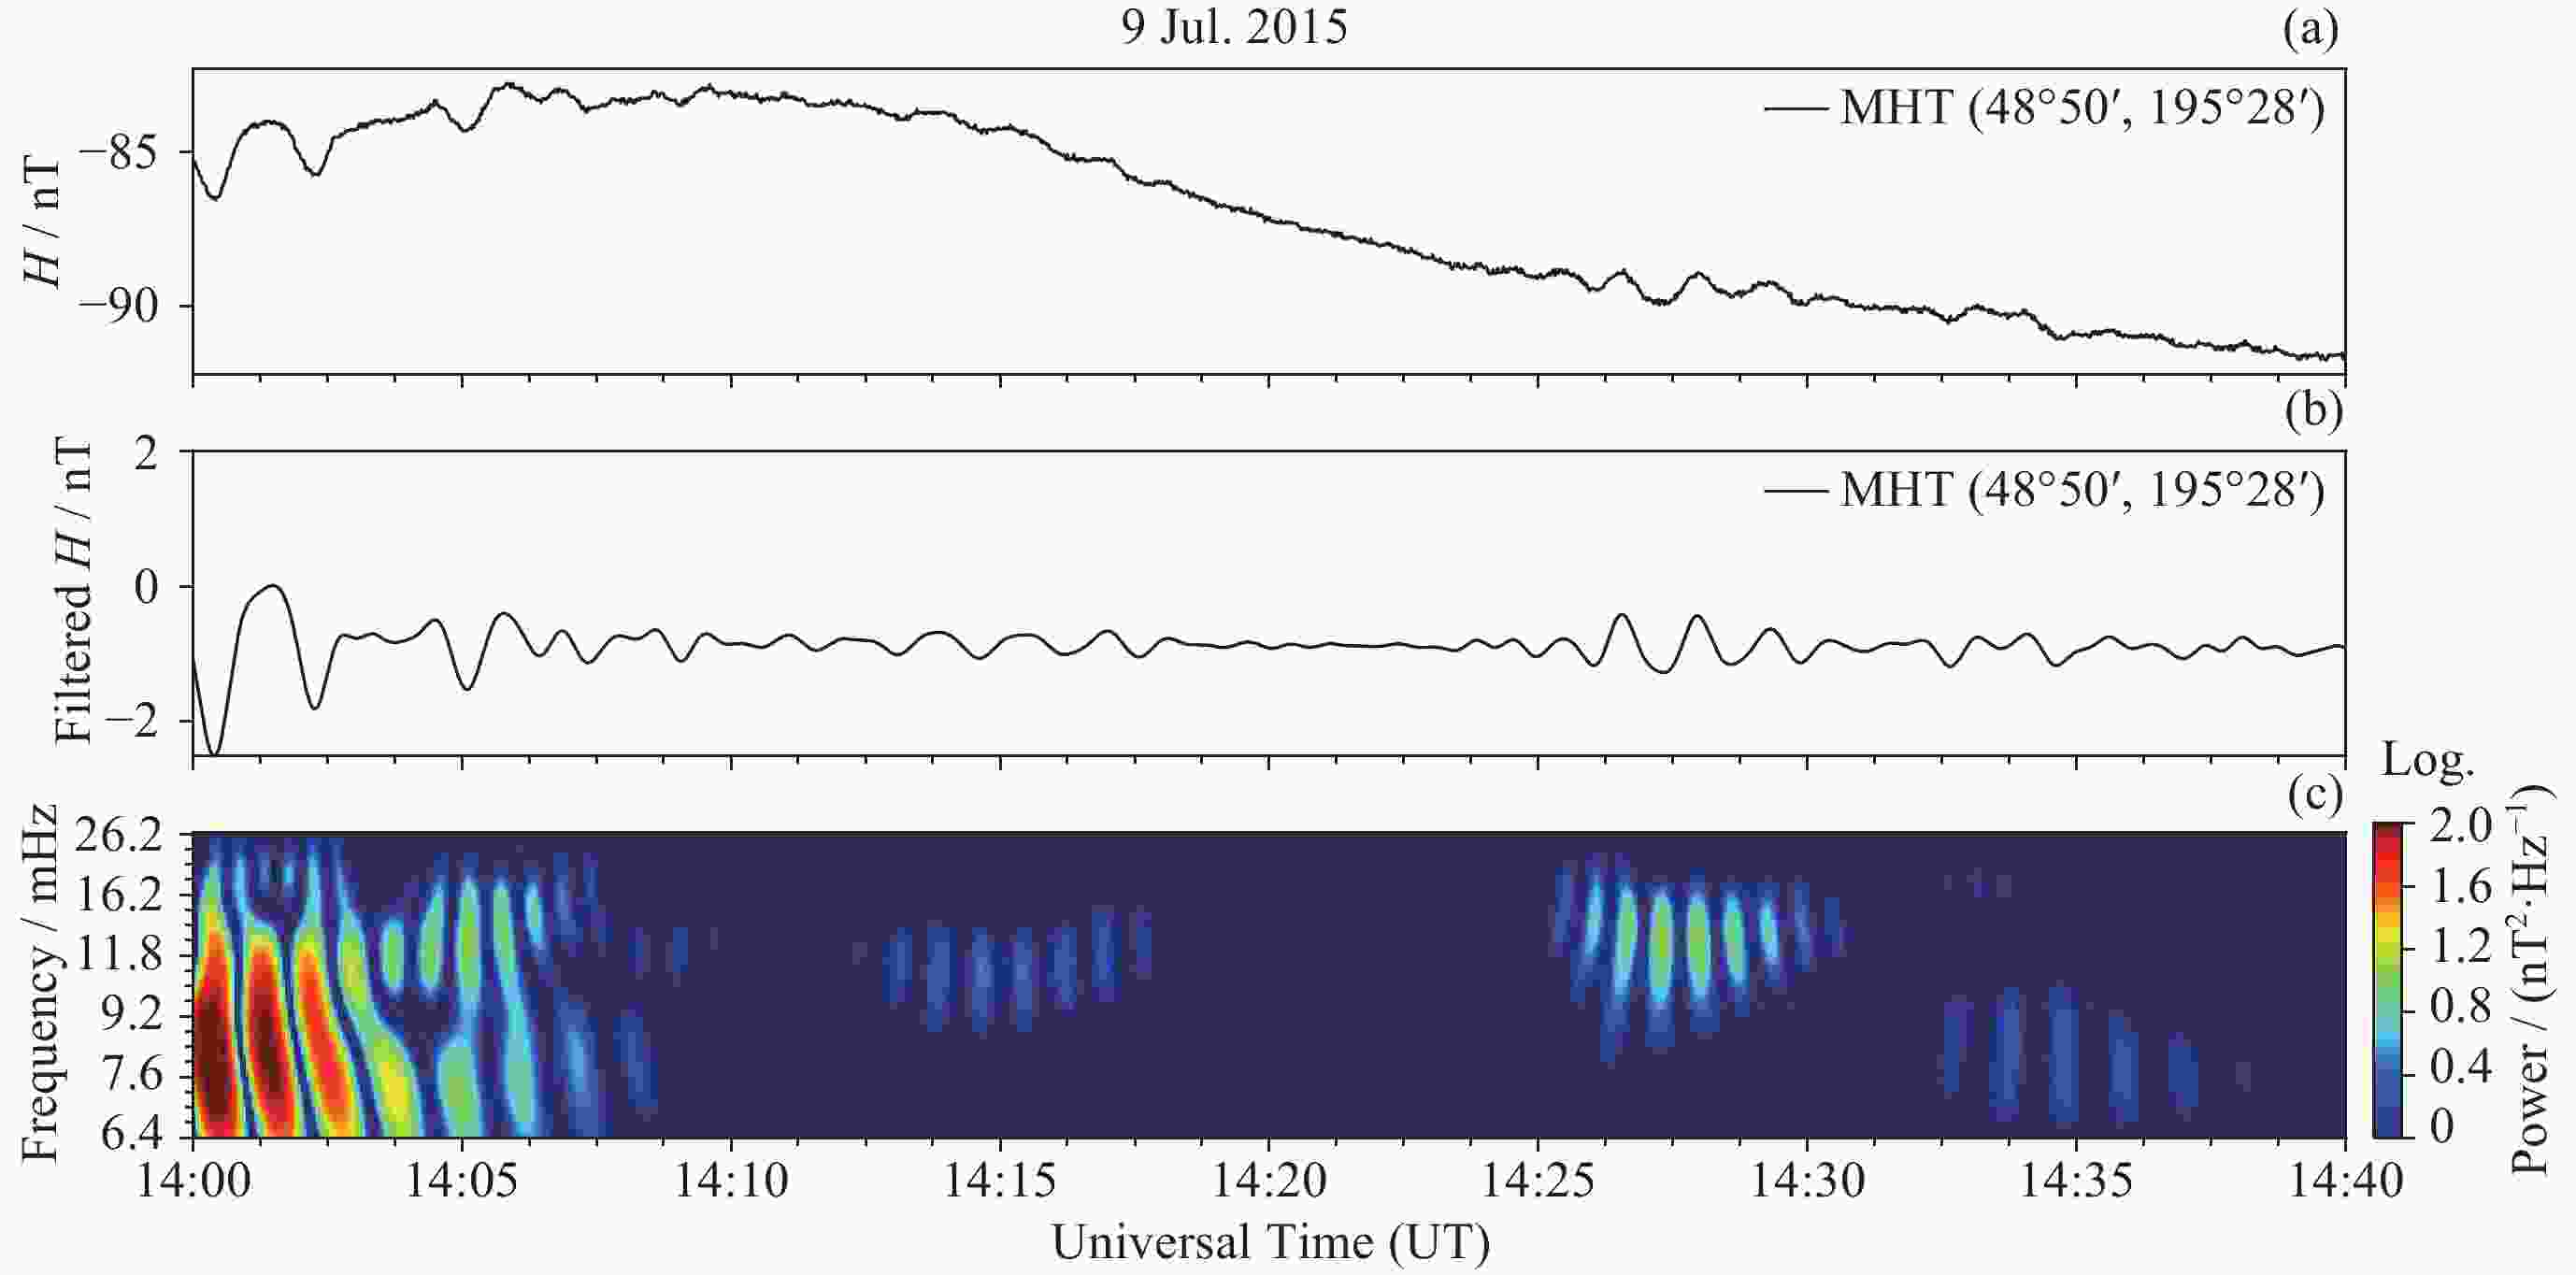
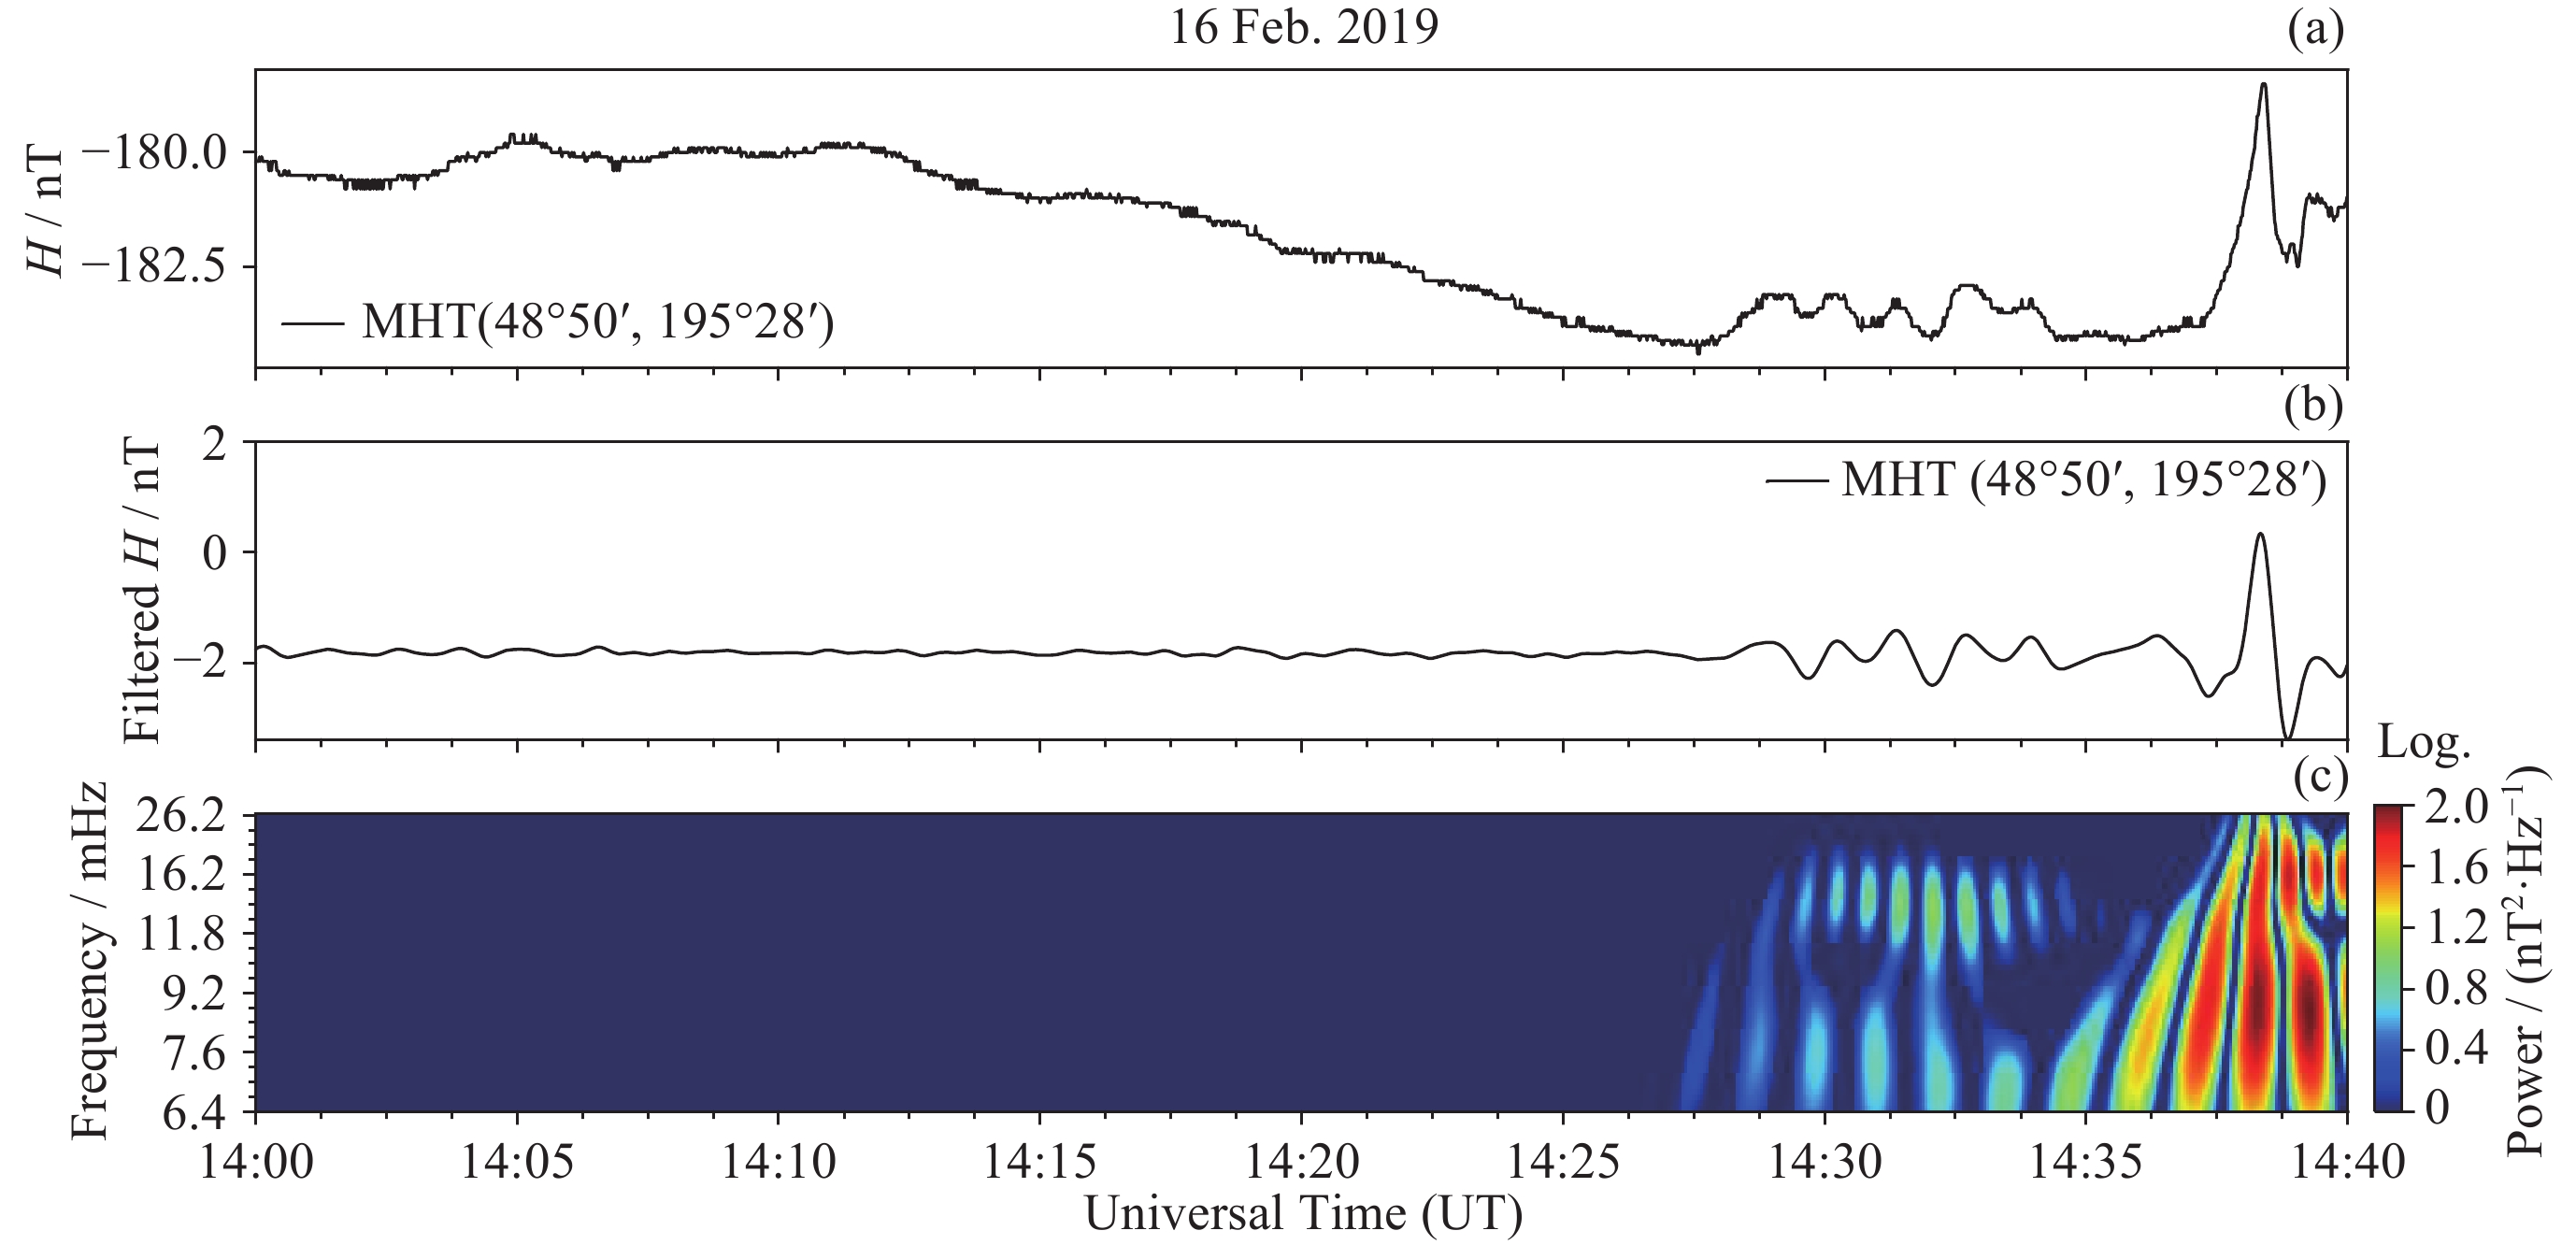
图 15 1D-ResCNN模型漏报的处在衰减阶段的Pi2脉动
Figure 15. Pi2 pulsation in the decay phase missed by 1D-ResCNN
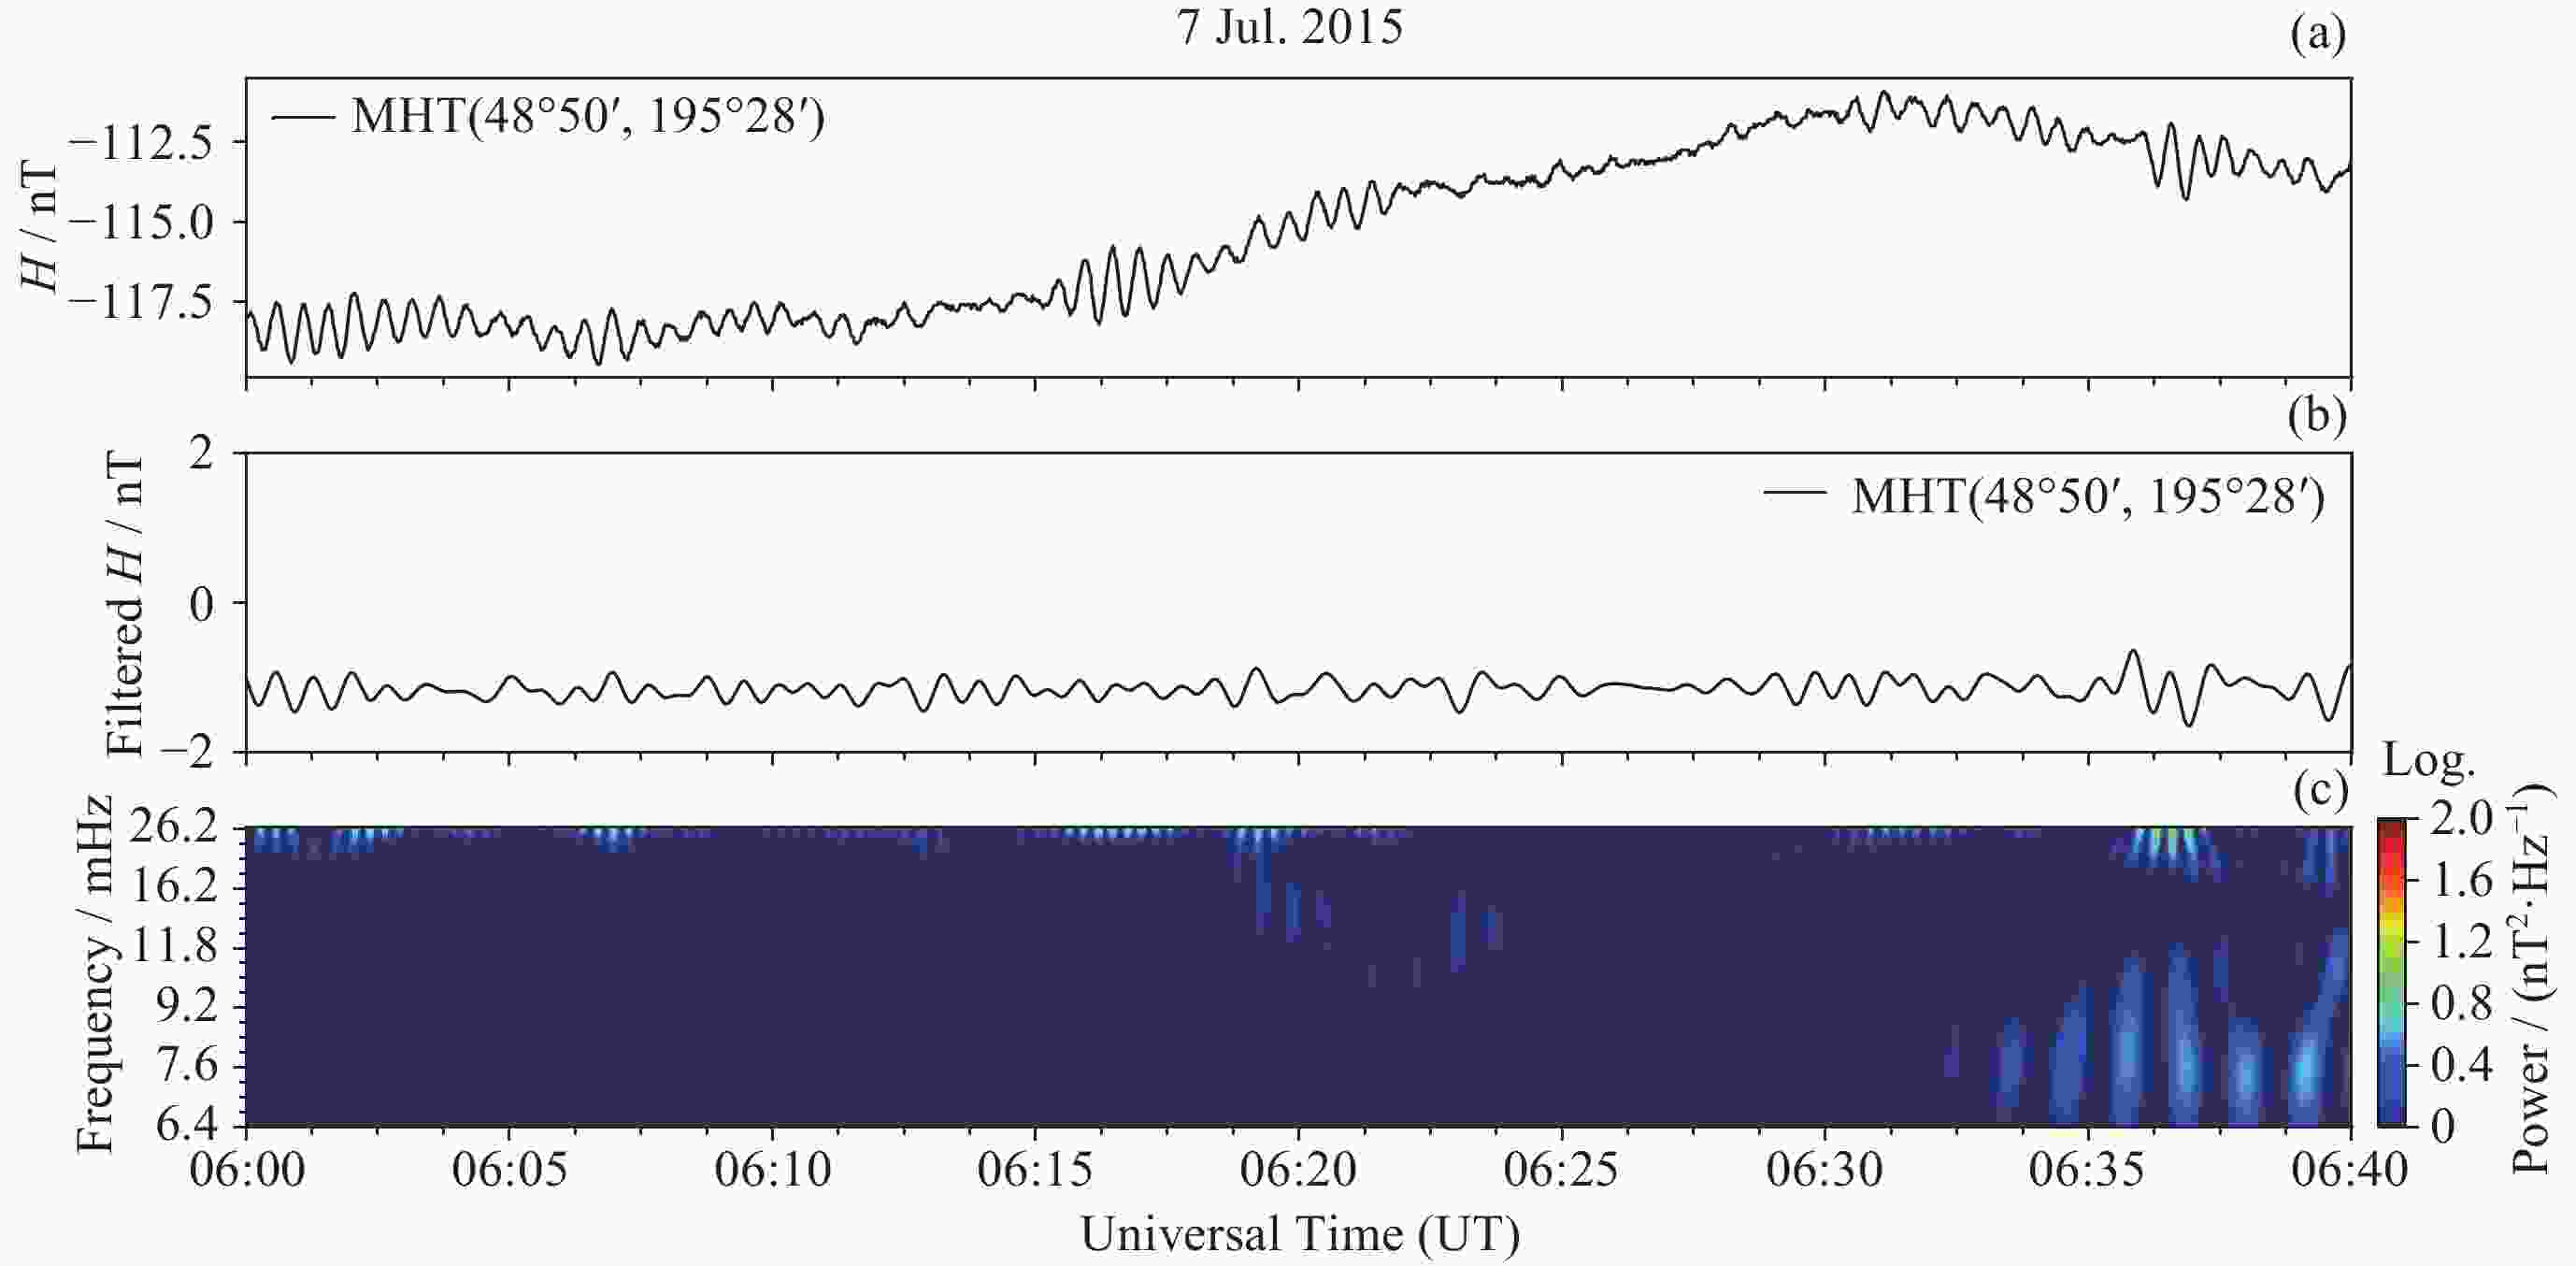
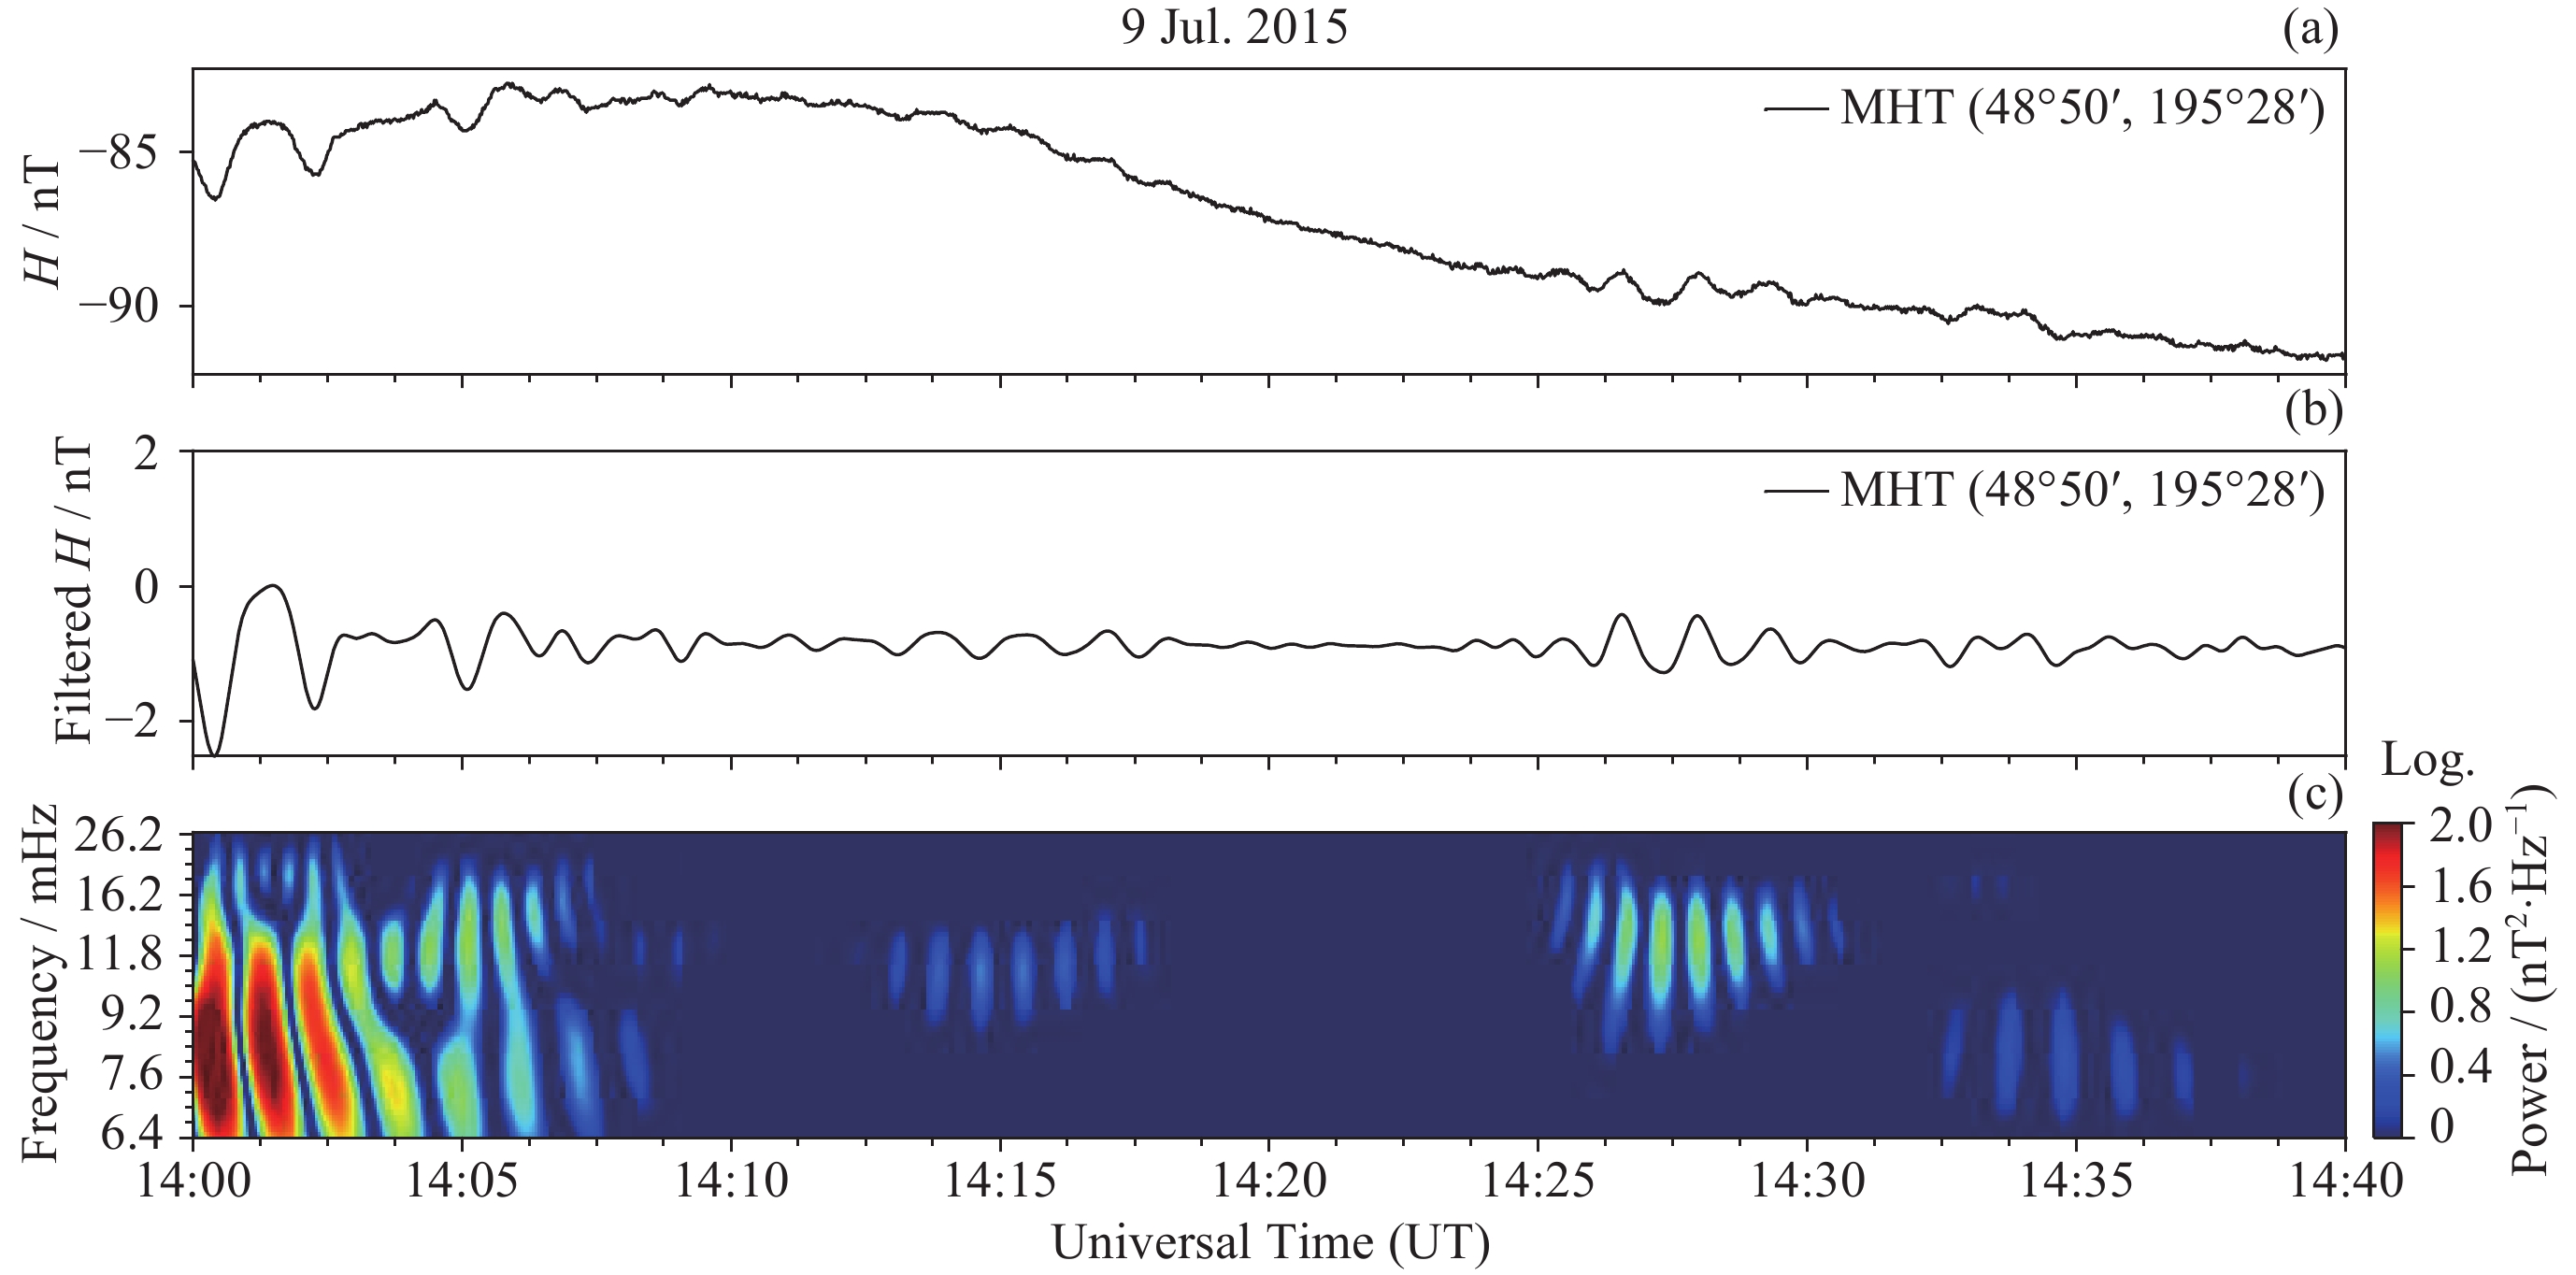
图 16 1D-ResCNN模型虚报的Pi2脉动
Figure 16. False positive Pi2 pulsations identified by 1D-ResCNN
表 1 漠河站Dataset1的正负样本分布情况
Table 1. Positive and negative sample distribution of Dataset1 at MHT
窗口长度/min 训练集 验证集 测试集 正样本 负样本 正样本 负样本 正样本 负样本 10 13320 216936 6524 89668 10061 146323 20 10855 104273 5223 42873 8071 70121 40 8477 49087 3977 20071 6195 32901  下载: 导出CSV
表 2 漠河站Dataset2的正负样本分布情况
Table 2. Positive and negative sample distribution of Dataset2 at MHT
窗口长度/min 训练集 验证集 测试集 正样本 负样本 正样本 负样本 正样本 负样本 10 14662 221925 6232 95163 9011 135839 20 11737 106556 5170 45528 7242 65183 40 9188 49958 3844 21505 5617 30596
下载: 导出CSV
表 4 使用策略1的不同模型在Dataset1和Dataset2测试集上的实验结果
Table 4. Experimental results on testing Dataset1 and Dataset2 of different models with Decision 1
模型 窗口长度/min 准确率/(%) 虚报率/(%) 漏报率/(%) $ {F}_{1} $值 FT+MLP[11] 10 95.63, 95.76 1.05, 0.98 52.68, 53.39 0.58, 0.58 20 93.75, 94.04 1.73, 1.69 45.58, 44.35 0.64, 0.65 40 88.41, 88.45 2.77, 2.27 58.39, 62.08 0.5, 0.50 DWT+CNN[12] 10 95.90, 95.89 0.06, 0.05 62.83, 65.28 0.54, 0.51 20 93.89, 94.33 0.11, 0.18 58.26, 55.12 0.58, 0.61 40 92.43, 91.59 0.69, 0.21 44.10, 53.07 0.70, 0.63 1D-ResCNN(本文方法) 10 97.84, 97.86 0.83, 0.96 21.64, 19.80 0.82, 0.82 20 96.89, 97.13 1.41, 1.23 17.85, 17.70 0.85, 0.85 40 95.71, 95.82 1.85, 1.82 17.21, 16.98 0.86, 0.86
下载: 导出CSV
表 5 使用策略2的不同模型在Dataset1和Dataset2测试集上的实验结果
Table 5. Experimental results on testing Dataset1 and Dataset2 of different models with Decision2
模型 窗口长度/min 决策阈值 准确率/(%) 虚报率/(%) 漏报率/(%) $ {F}_{1} $值 FT+MLP[11] 10 0.29, 0.25 95.24, 95.25 2.43, 2.67 38.72, 36.10 0.62, 0.63 20 0.33, 0.31 93.52, 93.55 3.25, 3.65 34.48, 31.63 0.68, 0.68 40 0.29, 0.27 86.80, 87.19 8.38, 7.91 38.81, 39.51 0.60, 0.59 DWT+CNN[12] 10 0.27, 0.27 96.98, 97.13 1.89, 1.53 19.39, 23.02 0.77, 0.77 20 0.27, 0.28 96.09, 94.33 2.00, 2.20 20.53, 21.55 0.81, 0.79 40 0.29, 0.27 93.55, 94.10 3.78, 3.22 20.61, 20.53 0.80, 0.81 1D-ResCNN 10 0.38, 0.43 97.77, 97.84 1.25, 1.17 16.41, 17.17 0.83, 0.83 (本文方法) 20 0.40, 0.38 96.81, 97.06 1.87, 1.76 14.65, 13.62 0.85, 0.85 40 0.42, 0.35 95.73, 95.76 2.26, 2.74 14.98, 12.43 0.86, 0.86
下载: 导出CSV
表 6 不同台站的基本信息及样本分布情况
Table 6. Basic information and samples distribution of different stations
台站名称 (编码) 地磁坐标 训练集 验证集 测试集 正样本 负样本 正样本 负样本 正样本 负样本 琼中站 (QZT) (16°48′ , 182°0′ ) 1845 9772 748 4231 5944 31784 邵阳站 (SYT) (23°54′ , 183°55′ ) 1611 12929 675 5557 5190 41070 马陵山站 (MLS) (29°25′ , 191°21′ ) 1522 12388 680 5282 3710 30634 农安站 (NAT) (39°0′ , 198°5′ ) 1923 14381 859 6129 5252 38020
下载: 导出CSV
表 7 不同台站的测试集的实验结果
Table 7. Experimental results on testing datasets of stations at different latitudes
台站名称 (编码) 准确率/(%) 虚报率/(%) 漏报率/(%) $ {F}_{1} $值 琼中站 (QZT) 90.73 8.64 12.63 0.75 邵阳站 (SYT) 95.81 1.77 23.35 0.80 马陵山站 (MLS) 95.86 1.96 22.16 0.80 农安站 (NAT) 95.76 1.88 21.27 0.82
下载: 导出CSV
-
[1] JACOBS J A, KATO Y, MATSUSHITA S, et al. Classification of geomagnetic micropulsations[J]. Journal of Geophysical Research, 1964, 69(1): 180-181 doi: 10.1029/JZ069i001p00180 [2] TAKAHASHI K, LEE D H, NOSÉ M, et al. CRRES electric field study of the radial mode structure of Pi2 pulsations[J]. Journal of Geophysical Research: Space Physics, 2003, 108(A5): 1210 [3] SAITO T, YUMOTO K, KOYAMA Y. Magnetic pulsation Pi2 as a sensitive indicator of magnetospheric substorm[J]. Planetary and Space Science, 1976, 24(11): 1025-1029 doi: 10.1016/0032-0633(76)90120-3 [4] CHEN L, SHIOKAWA K, MIYOSHI Y, et al. Correspondence of Pi2 pulsations, aurora luminosity, and plasma flux fluctuation near a substorm brightening aurora: Arase observations[J]. Journal of Geophysical Research: Space Physics, 2023, 128(10): e2023JA031648 doi: 10.1029/2023JA031648 [5] SIMHA C P, KATLAMUDI M R, BULUSU J. Low latitude Pi2 pulsations at Desalpar, Gujarat, India: A statistical analysis of the influences of magnetic storms/substorms, seasons, and solar cycles[J]. Journal of Atmospheric and Solar-Terrestrial Physics, 2023, 252: 106145 doi: 10.1016/j.jastp.2023.106145 [6] KEILING A, TAKAHASHI K. Review of Pi2 models[J]. Space Science Reviews, 2011, 161(1): 63-148 [7] KWON H J, KIM K H, JUN C W, et al. Low‐latitude Pi2 pulsations during intervals of quiet geomagnetic conditions (K p≤1)[J]. Journal of Geophysical Research: Space Physics, 2013, 118(10): 6145-6153 doi: 10.1002/jgra.50582 [8] NOSÉ M, IYEMORI T, TAKEDA M, et al. Automated detection of Pi 2 pulsations using wavelet analysis: 1. Method and an application for substorm monitoring[J]. Earth, Planets and Space, 1998, 50(9): 773-783 [9] MURPHY K R, JONATHAN RAE I, MANN I R, et al. Wavelet‐based ULF wave diagnosis of substorm expansion phase onset[J]. Journal of Geophysical Research: Space Physics, 2009, 114(A1): A00C16 [10] KATSAVRIAS C, PAPADIMITRIOU C, HILLARIS A, et al. Application of wavelet methods in the investigation of geospace disturbances: a review and an evaluation of the approach for quantifying wavelet power[J]. Atmosphere, 2022, 13(3): 499 doi: 10.3390/atmos13030499 [11] SUTCLIFFE P R. Substorm onset identification using neural networks and Pi2 pulsations[J]. Annales Geophysicae, 1997, 15(10): 1257-1264 doi: 10.1007/s00585-997-1257-x [12] RABIE E, HAFEZ A G, SAAD O M, et al. Geomagnetic micro-pulsation automatic detection via deep leaning approach guided with discrete wavelet transform[J]. Journal of King Saud University-Science, 2021, 33(1): 101263 doi: 10.1016/j.jksus.2020.101263 [13] BALASIS G, AMINALRAGIA-GIAMINI S, PAPADIMITRIOU C, et al. A machine learning approach for automated ULF wave recognition[J]. Journal of Space Weather and Space Climate, 2019, 9: A13 doi: 10.1051/swsc/2019010 [14] ANTONOPOULOU A, BALASIS G, PAPADIMITRIOU C, et al. Convolutional neural networks for automated ULF wave classification in swarm time series[J]. Atmosphere, 2022, 13(9): 1488 doi: 10.3390/atmos13091488 [15] OMONDI S, YOSHIKAWA A, ZAHRA W K, et al. Automatic detection of auroral Pc5 geomagnetic pulsation using machine learning approach guided with discrete wavelet transform[J]. Advances in Space Research, 2023, 72(3): 866-883 doi: 10.1016/j.asr.2022.06.063 [16] PAPPOE J A, YOSHIKAWA A, KANDIL A, et al. A machine learning approach combined with wavelet analysis for automatic detection of Pc5 geomagnetic pulsations observed at geostationary orbits[J/OL]. Advances in Space Research, 2023. (2023-11-03). [2024-01-30]. https://www.sciencedirect.com/science/article/abs/pii/S0273117723008736 [17] TERAMOTO M, MIYOSHI Y, MATSUOKA A, et al. Off-Equatorial Pi2 pulsations inside and outside the plasmapause observed by the Arase satellite[J]. Journal of Geophysical Research: Space Physics, 2022, 127(1): e2021JA029677 doi: 10.1029/2021JA029677 [18] TAKAHASHI K, LYSAK R, VELLANTE M. Statistical analysis of Pi2 pulsations observed by Van Allen Probes[J]. Journal of Geophysical Research: Space Physics, 2022, 127(9): e2022JA030674 doi: 10.1029/2022JA030674 [19] 曾正君, 张莹, 杜爱民, 等. 顶部电离层Pc3压缩波的波动特征[J]. 地球物理学进展, 2020, 35(3): 918-924 doi: 10.6038/pg2020DD0174ZENG Zhengjun, ZHANG Ying, DU Aimin, et al. Characteristics of Pc3 compressional waves in the topside ionosphere[J]. Progress in Geophysics, 2020, 35(3): 918-924 doi: 10.6038/pg2020DD0174 [20] ZHANG Yiyue, ZOU Ziming, FANG Shaofeng. Pi2 pulsation event annotation time-series dataset[DB/OL]. V3. Science Data Bank, 2024. [2024-04-26]. https://cstr.cn/14804.11.sciencedb.space.01648 [21] 中国气象局. QX/T 135-2011 太阳活动水平分级[S]. 北京: 中国气象出版社, 2011China Meteorological Administration. QX/T 135-2011 Classification for solar activity level[S]. Beijing: China Meteorological Press, 2011 [22] HE K M, ZHANG X Y, REN S Q, et al. Deep residual learning for image recognition[C]//2016 IEEE Conference on Computer Vision and Pattern Recognition. Las Vegas, NV, USA: IEEE, 2016: 770-778 -
-

 下载:
下载:

计量
- 文章访问数: 842
- HTML全文浏览量: 388
- PDF下载量: 88
-
被引次数:
0(来源:Crossref)
0(来源:其他)

