


波模并合激发谐频脉泽辐射的泵波模拟
doi: 10.11728/cjss2025.01.2024-yg29 cstr: 32142.14.cjss.2024-yg29
-
 刘功林 男, 2001年5月出生于新疆维吾尔自治区克拉玛依市, 现为山东大学空间科学与技术学院硕士研究生, 主要研究方向为射电辐射产生机制、空间等离子体物理数值模拟等. E-mail: 202317793@mail.sdu.edu.cn
 -
 宁昊 男, 1995年9月出生于山东省泰安市, 现为山东大学前沿交叉科学青岛研究院博士后, 主要研究方向为太阳耀斑非热辐射、射电相干辐射机制等. E-mail: haoning@sdu.edu.cn
作者简介:
通讯作者:
Simulation on the Mechanism of Harmonic Maser Emission Through the Wave Coalescence Process
-
摘要: 损失锥电子驱动的电子回旋脉泽辐射是解释太阳射电尖峰暴的主要机制, 然而在强磁化条件下, 其主要激发的基频辐射在日冕中存在逃逸困难的问题, 谐频辐射的激发可有效解决该问题. 最近有研究提出一种新型谐频辐射机制, 即损失锥电子激发的基频X模(X1)和Z模通过波模并合产生谐频辐射. 然而其相应非线性波模并合过程仍需进一步研究和论证. 研究针对Z+Z和Z+X1并合产生谐频的新型辐射机制开展了并合条件分析, 发现该过程的并合条件很容易满足, 并可在很宽的传播角范围内激发谐频X2辐射. 基于此开展泵波粒子模拟可验证非线性波模并合过程的发生, 模拟得到谐频辐射的有效激发, 且并合过程能量转换率在2%~8%.Abstract: Electron Cyclotron Maser Emission (ECME) driven by electrons with loss-cone distribution is the main mechanism for explaining solar radio spikes. However, in strongly magnetized plasmas, the losscone-driven ECME mainly generates fundamental X mode emissions, which can be efficiently absorbed when escaping through the second-harmonic layer in the solar corona. To solve the “escaping difficulty”, recent studies suggested a new mechanism of harmonic maser emission (X2) involving nonlinear wave coupling process of Z-mode and fundamental X-mode (X1) waves (Z+Z→X2, Z+X1→X2). It is necessary to verify the nonlinear wave coalescence process with theoretical analyses and numerical simulations. Here, the possibility of a nonlinear wave coupling process is examined via solving the matching conditions for three-wave resonant interaction based on the dispersion relation of cold plasma in magneto-ionic theory.The matching conditions for the Z and/or X1 waves were found to be satisfied over a wide range of parameters, leading to the production of X2 emissions that propagate perpendicularly and obliquely relative to the direction of the background magnetic field. Based on the solutions obtained in the matching condition analysis, we selected four sets of solutions of Z+Z and Z+X1 to perform particle-in-cell simulations using wave pumping method, to verify the nonlinear process of wave coalescence generating second harmonic X-mode emissions. With X1 and/or Z modes correctly pumped in the simulation domain, efficient generation of X2 emissions was observed, with saturation achieved within 400 $ {\varOmega }_{\mathrm{c}\mathrm{e}}^{-1} $. The conversion rate of energies of X2 emissions to Z mode waves varies from 2% to 8%. The study presents strong evidence to support the new mechanism of harmonic maser emission, which can be widely applied to explain the solar and space radio emissions.
-
Key words:
- Coherent emission mechanism /
- PIC simulation /
- Solar radio emission /
- Nonlinear process
-
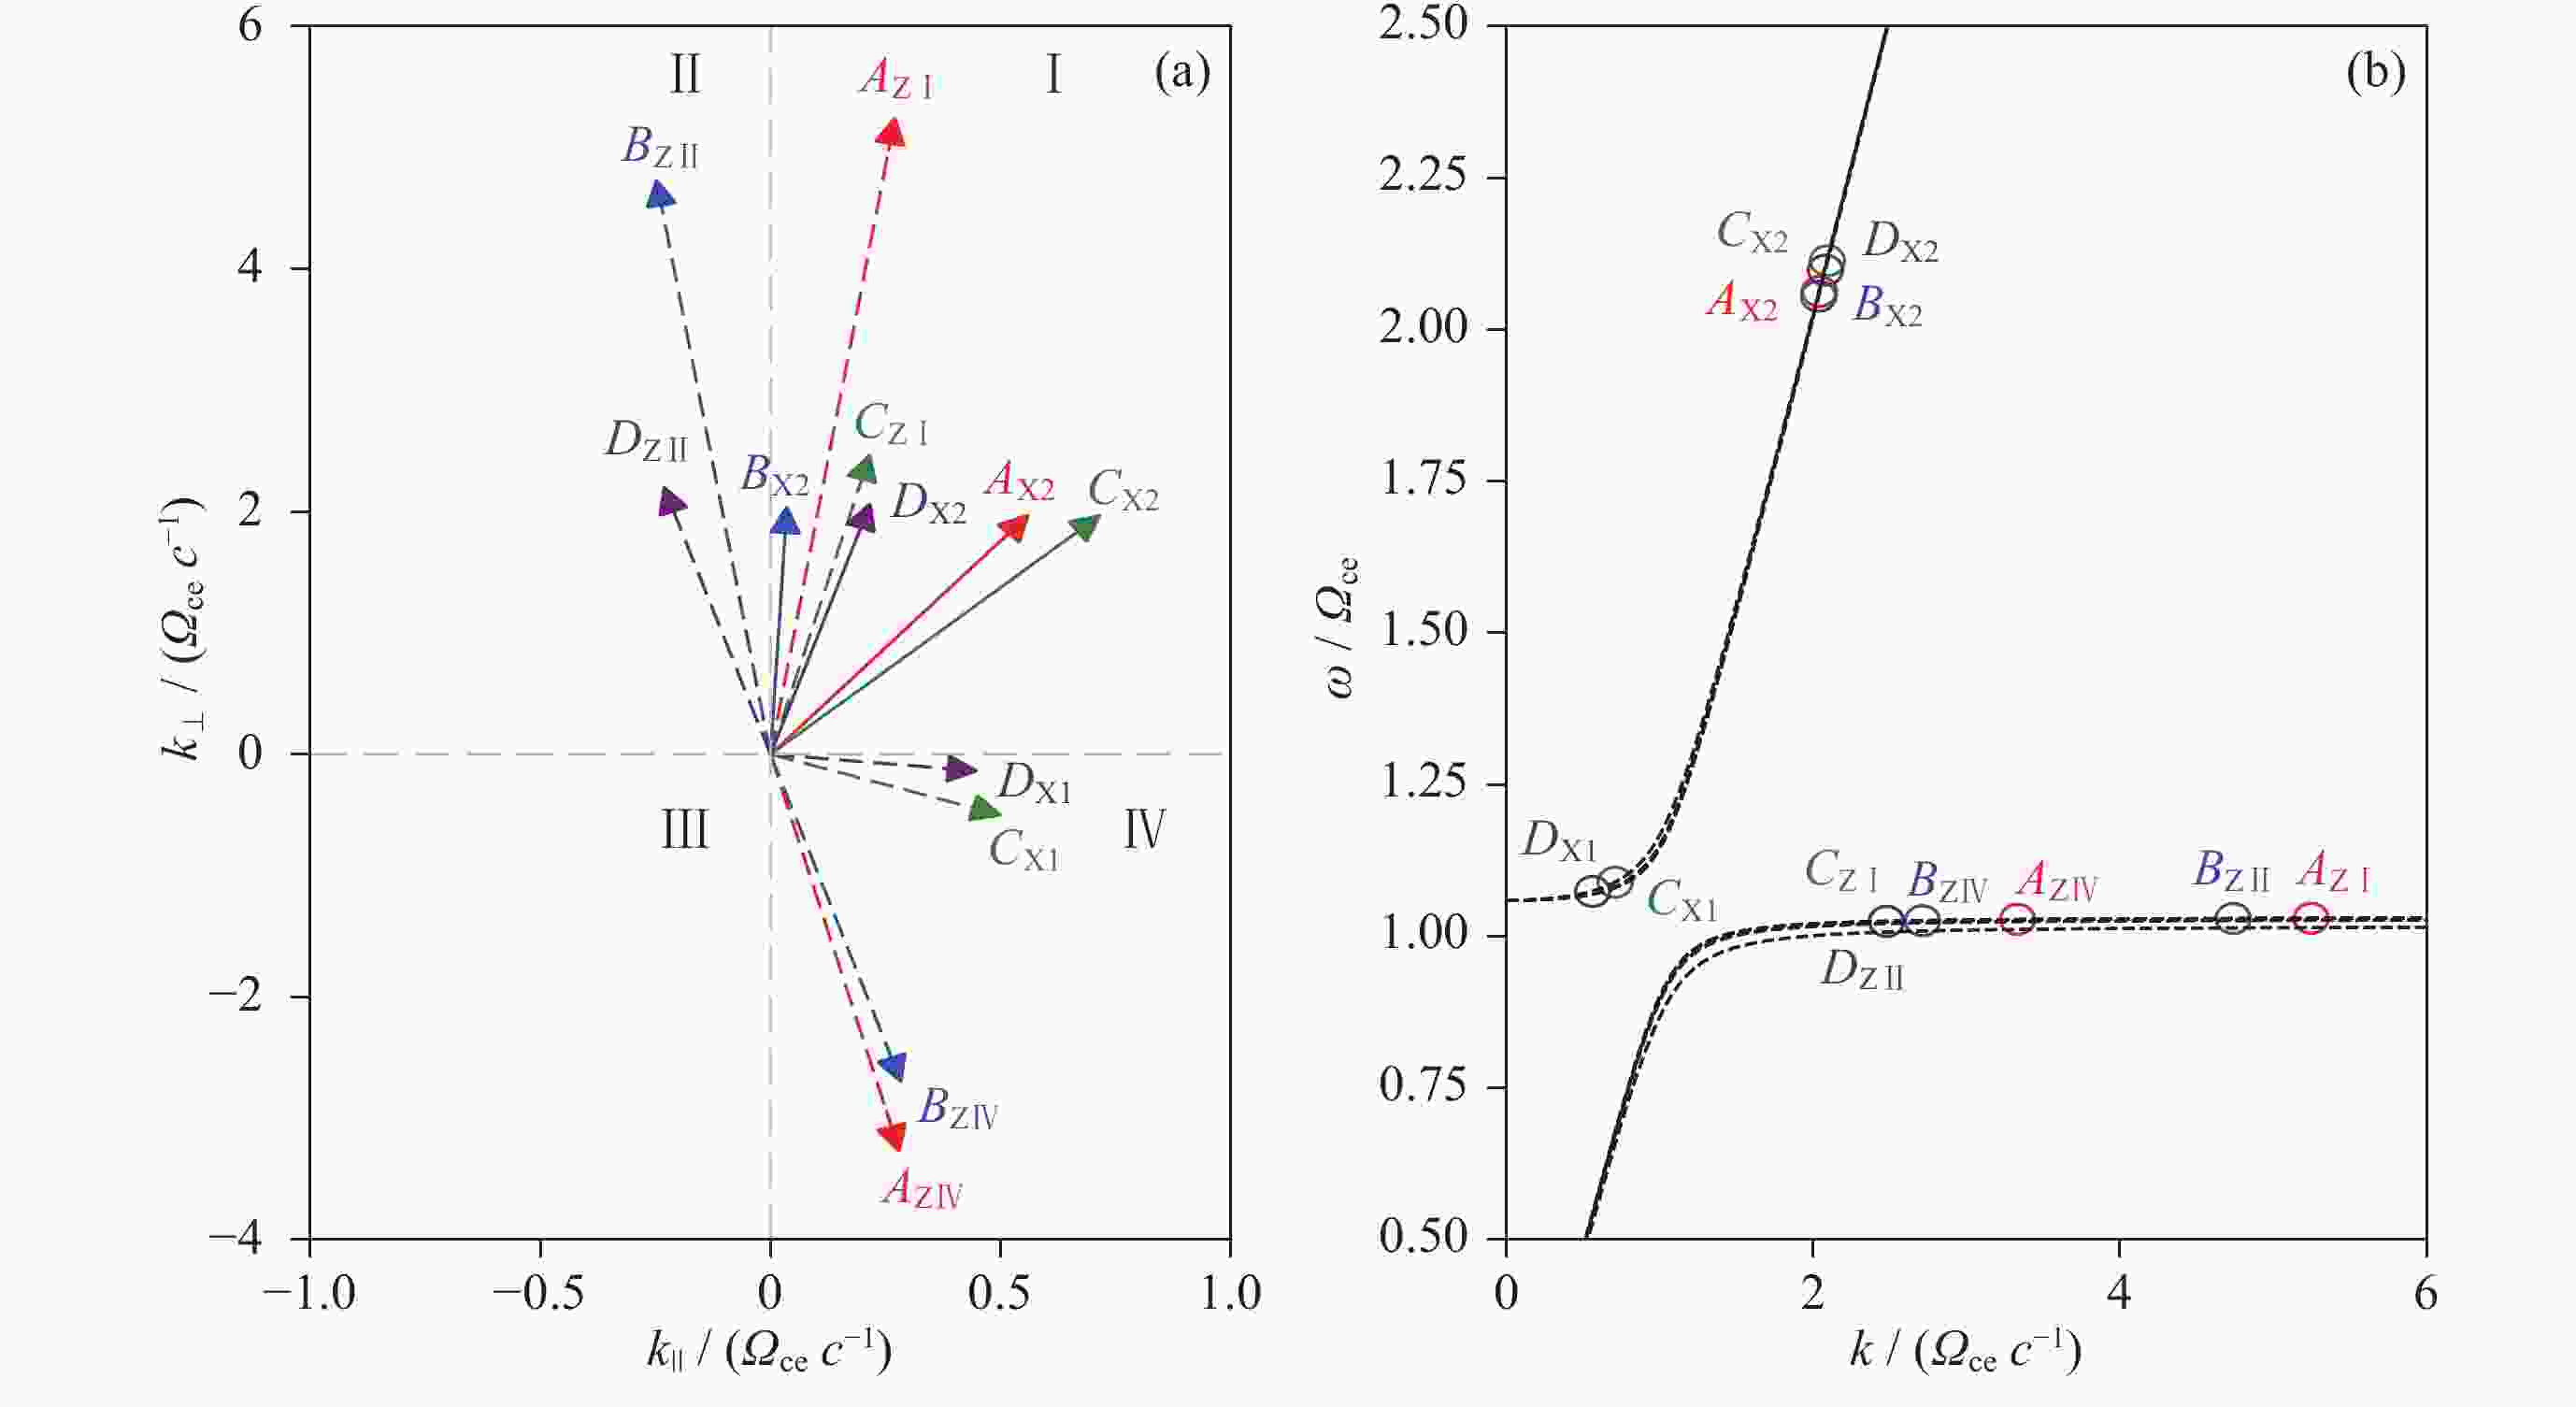
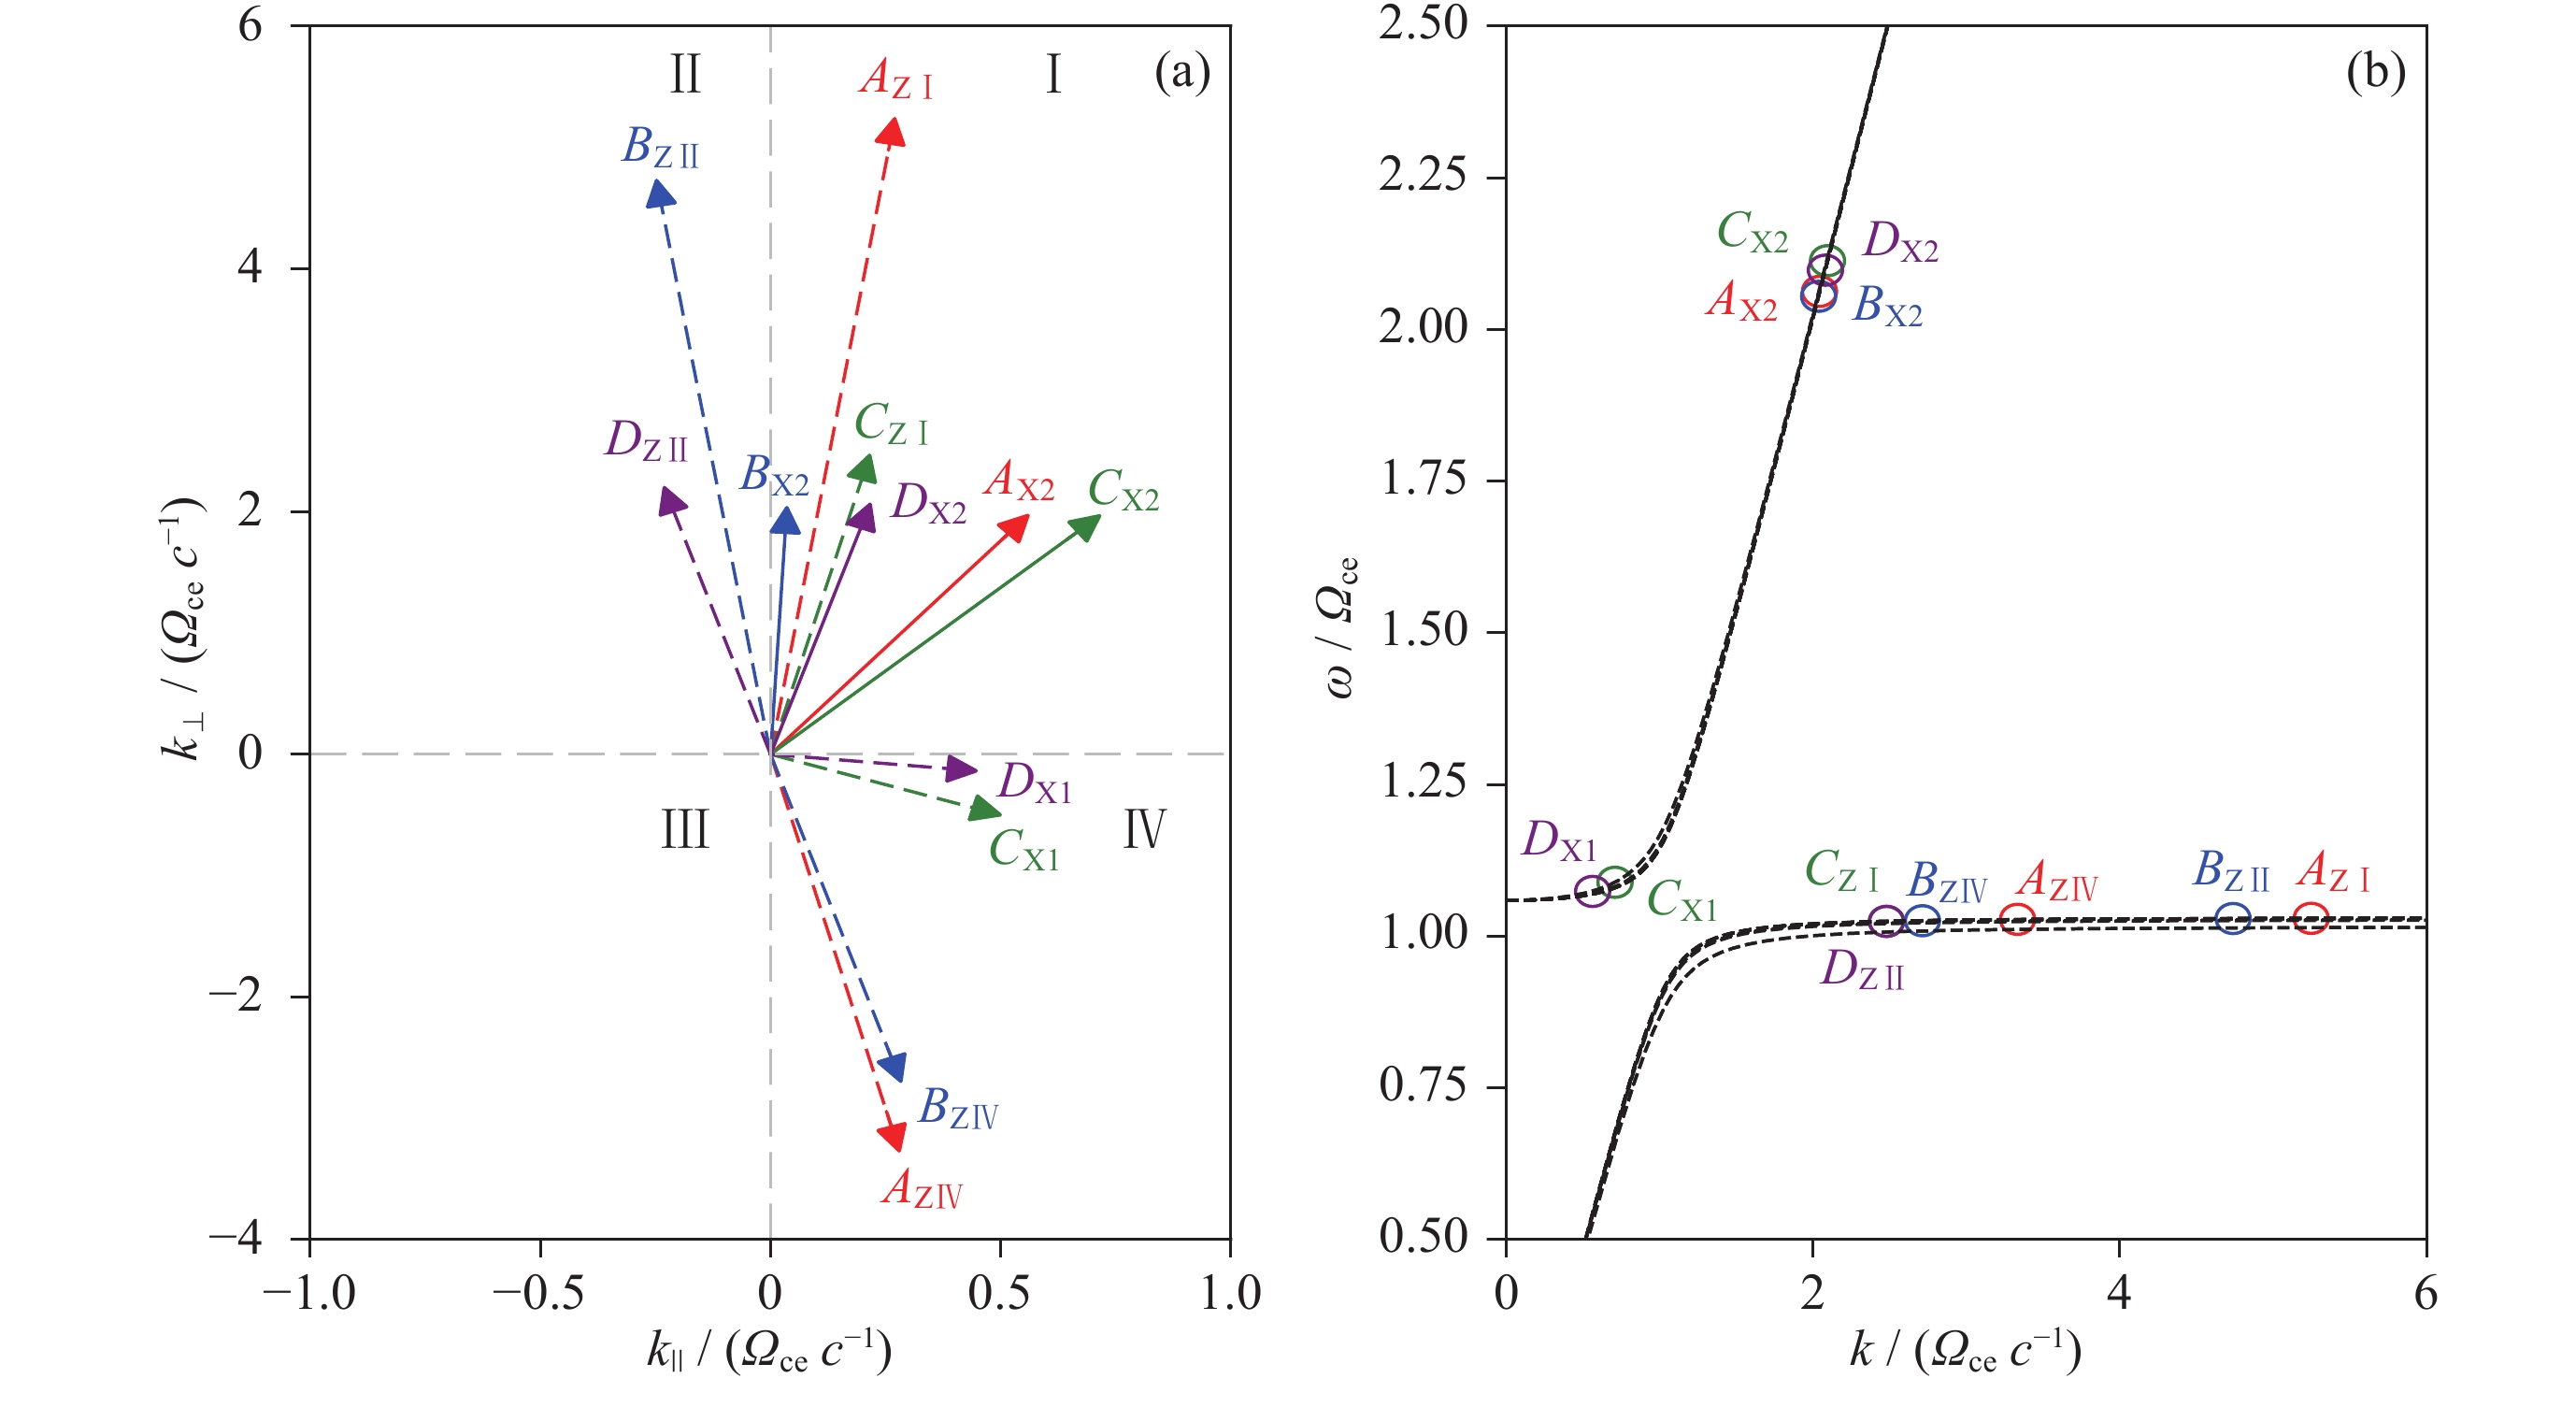
图 1 满足并合条件(Z+Z→X2, Z+X1→X2)的四组参考解. (a) Z, X1, X2的波矢分布, (b) 三种模式在相应传播角度上的频率、波数及其在色散关系上的位置. 其中红色、蓝色、绿色、紫色分别代表Case A, B, C, D 组解
Figure 1. Four examples of the solutions of coalescence conditions (Z+Z→X2, Z+X1→X2). (a) Wave vectors ($ \boldsymbol{k} $) of Z, X1 and X2. The dashed arrows point to the wave vector of mother waves, and the solid arrows point to the daughter waves (X2). (b) Frequencies and dispersion curves of Z, X1 and X2 modes. The red, blue, green, and purple arrows refer to the solutions of Case A, B, C and D, respectively
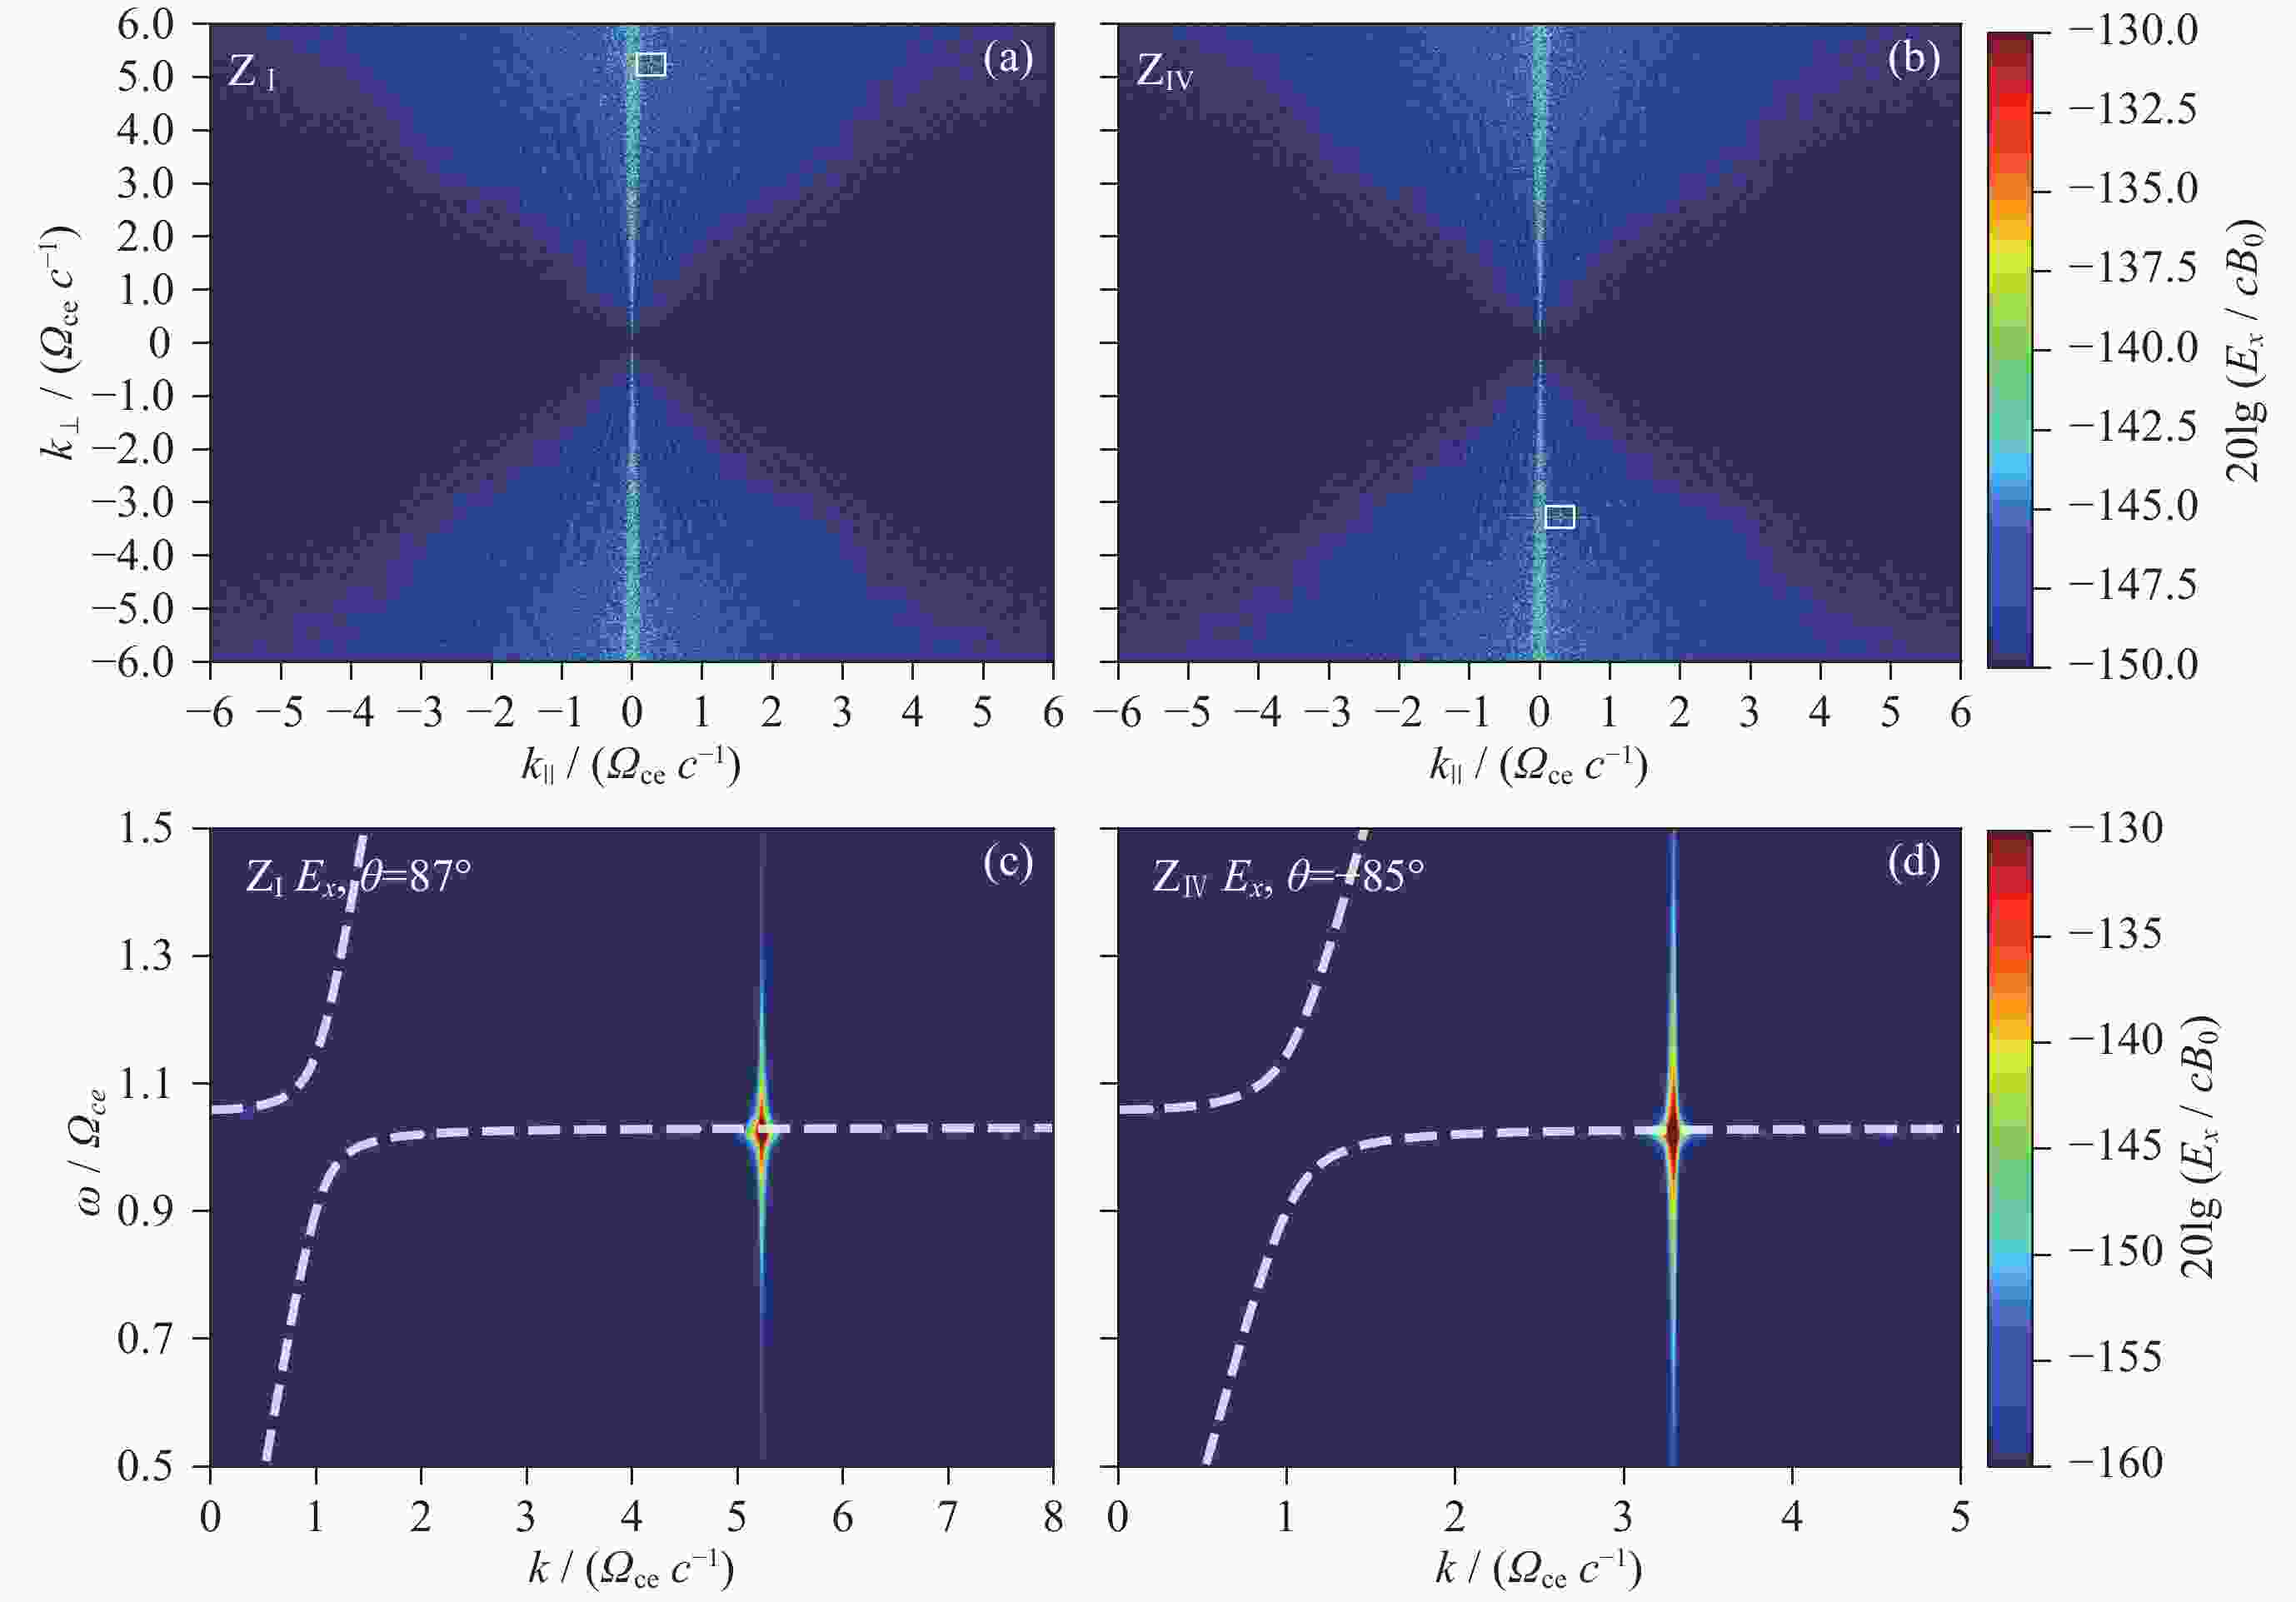
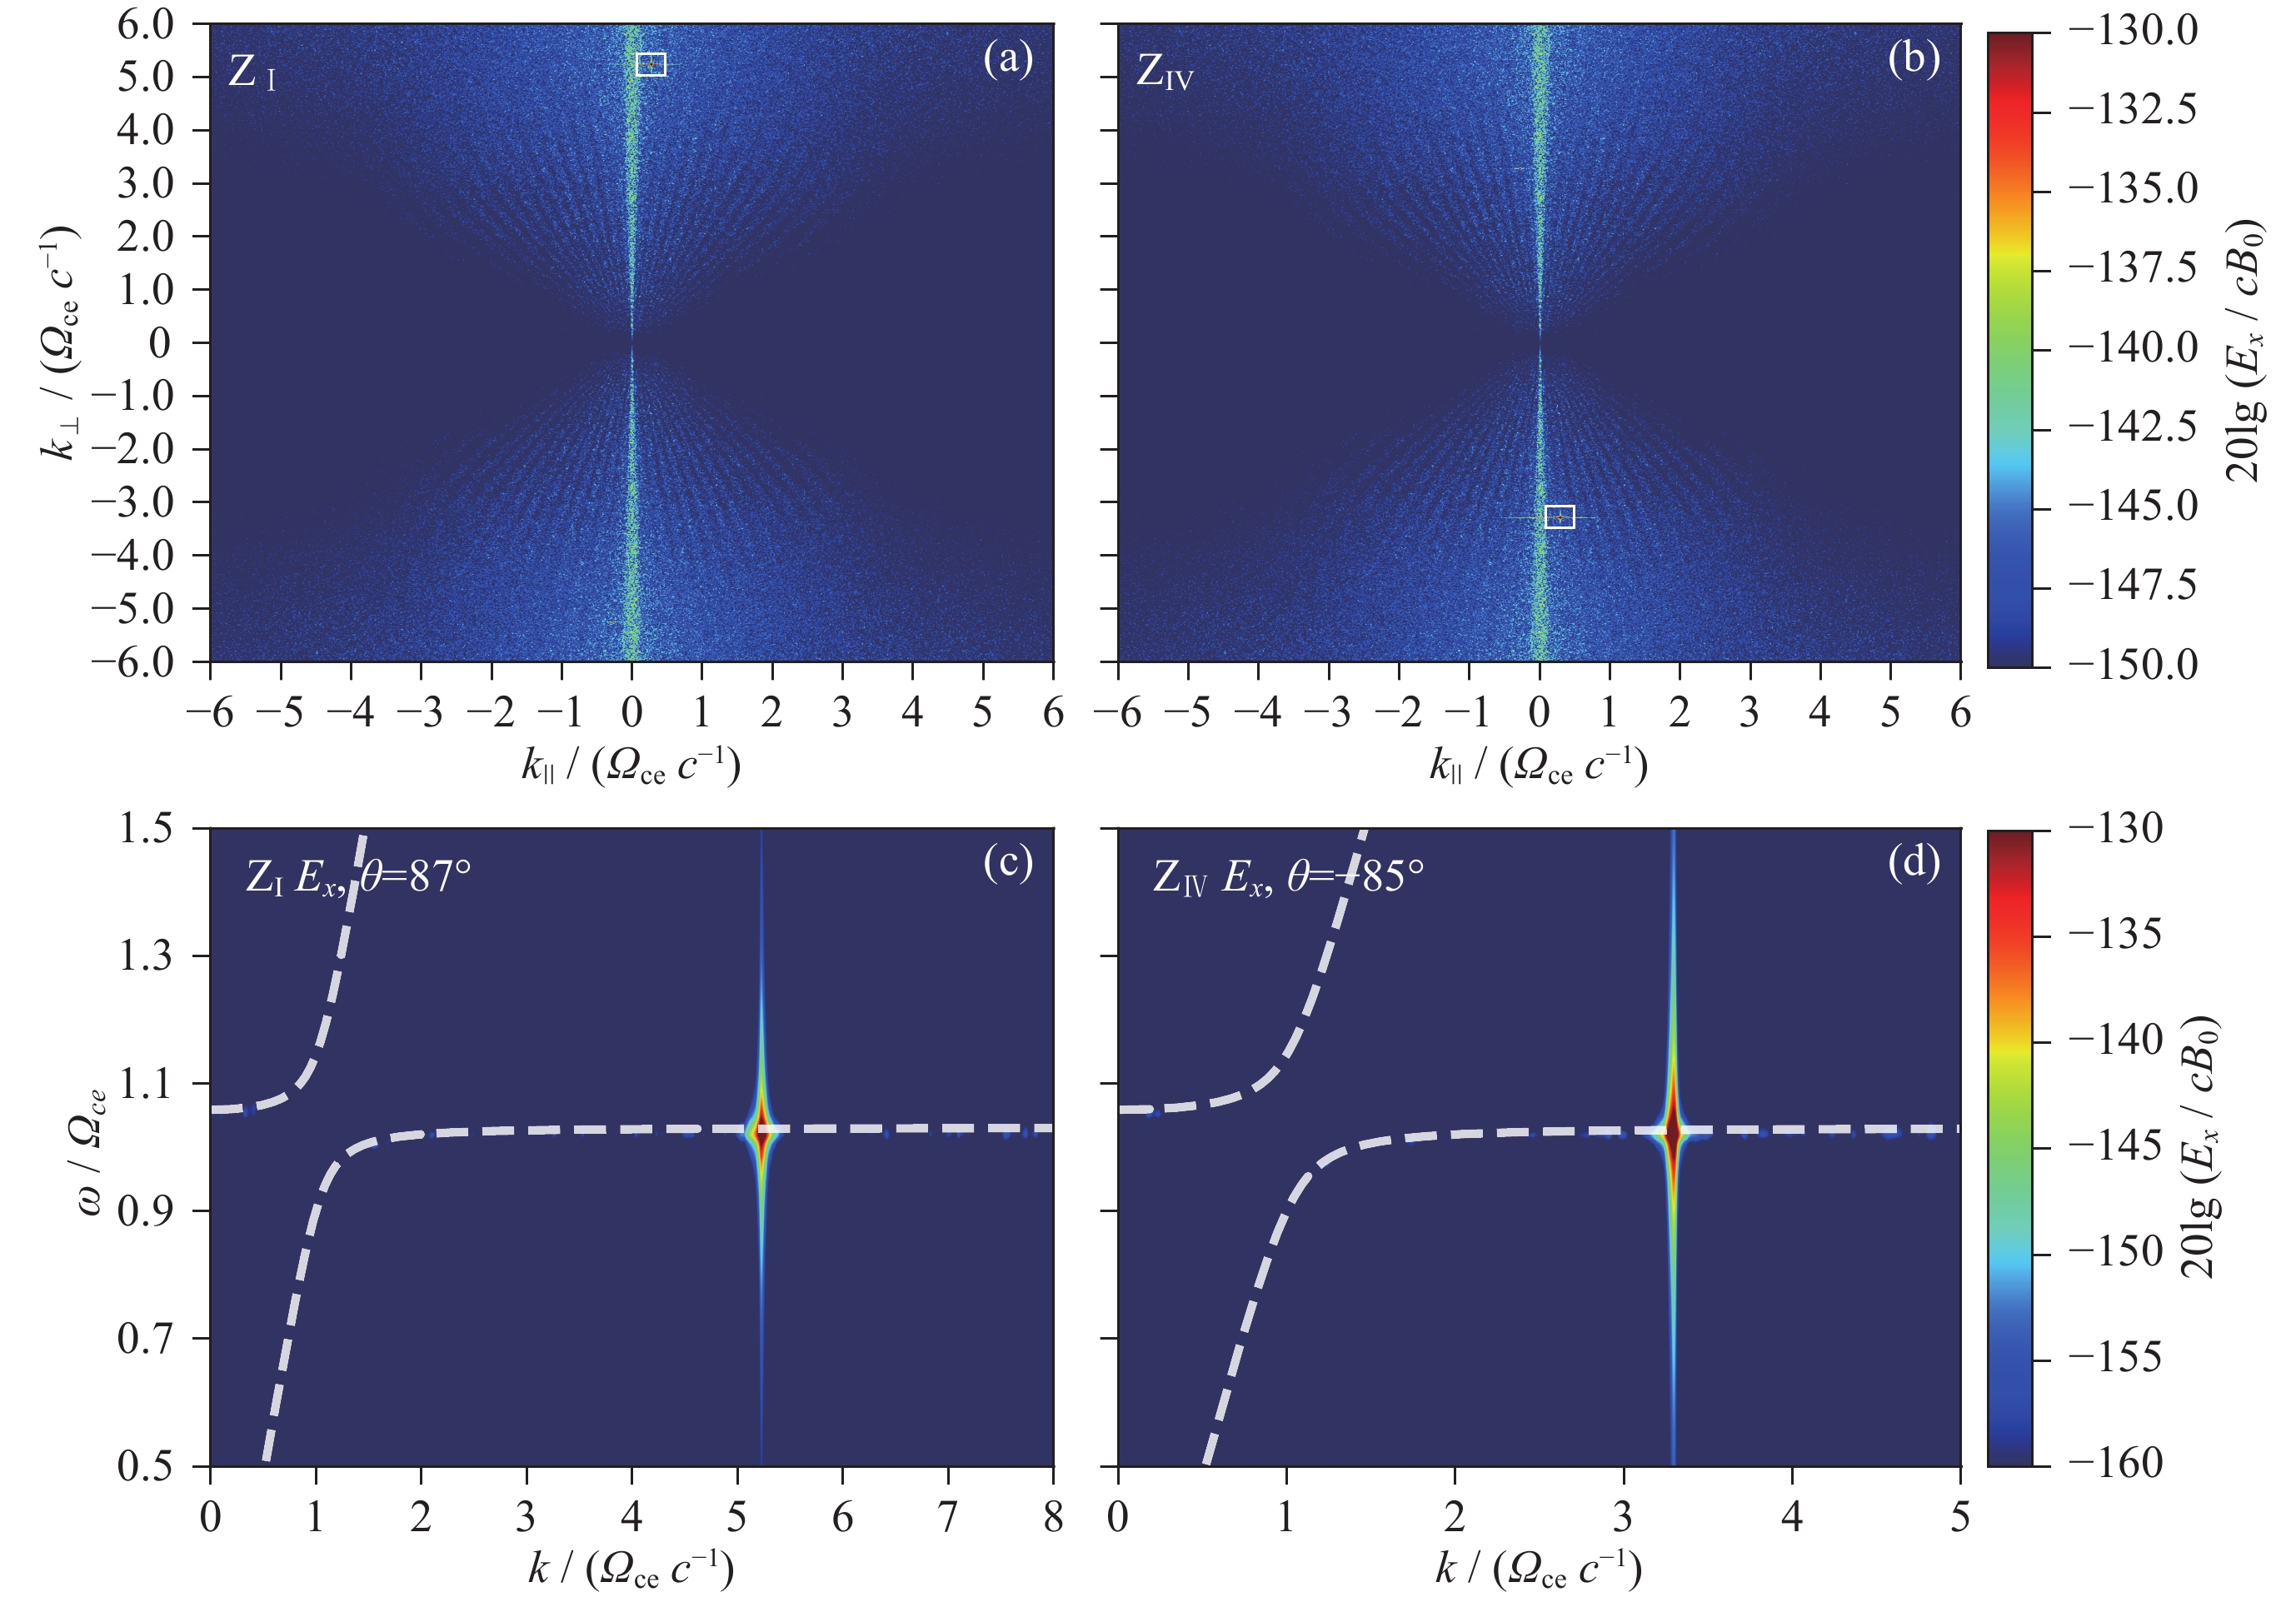
图 2 (a)(b)单独泵入$ {\mathrm{Z}}_{\mathrm{I}} $与$ {Z}_{\mathrm{I}\mathrm{V}} $波模时系统内$ {E}_{x} $分量扰动强度在波数空间($ {k}_{\parallel } $, $ {k}_{\perp } $)分布情况, 白色方框内为泵入的Z模波. (c)(d)电场分量$ {E}_{x} $在Z模相应传播方向(87°与–85°)的色散空间($ \omega $, $ k $)分布. 分析时间段为全模拟时长(0~400 $ {\varOmega }_{{\mathrm{ce}}}^{-1} $). 白色虚线为冷等离子体波模色散曲线
Figure 2. (a)(b) Maximum intensity distribution of the $ {E}_{x} $ component in the wave vector space ($ {k}_{\parallel } $, $ {k}_{\perp } $). $ {\mathrm{Z}}_{\mathrm{I}} $ and $ {\mathrm{Z}}_{\mathrm{I}\mathrm{V}} $ modes are pumped individually, marked in the white rectangle. (c)(d) Maximum intensity distribution of the electric field component $ {E}_{x} $ in dispersion space ($ \omega $, $ k $) at the corresponding propagation directions (87° and –85°) of the Z-mode. The analysis time period is the full simulation duration (0~400 $ {\varOmega }_{\mathrm{c}\mathrm{e}}^{-1} $). The white dashed lines present the cold plasma dispersion curve
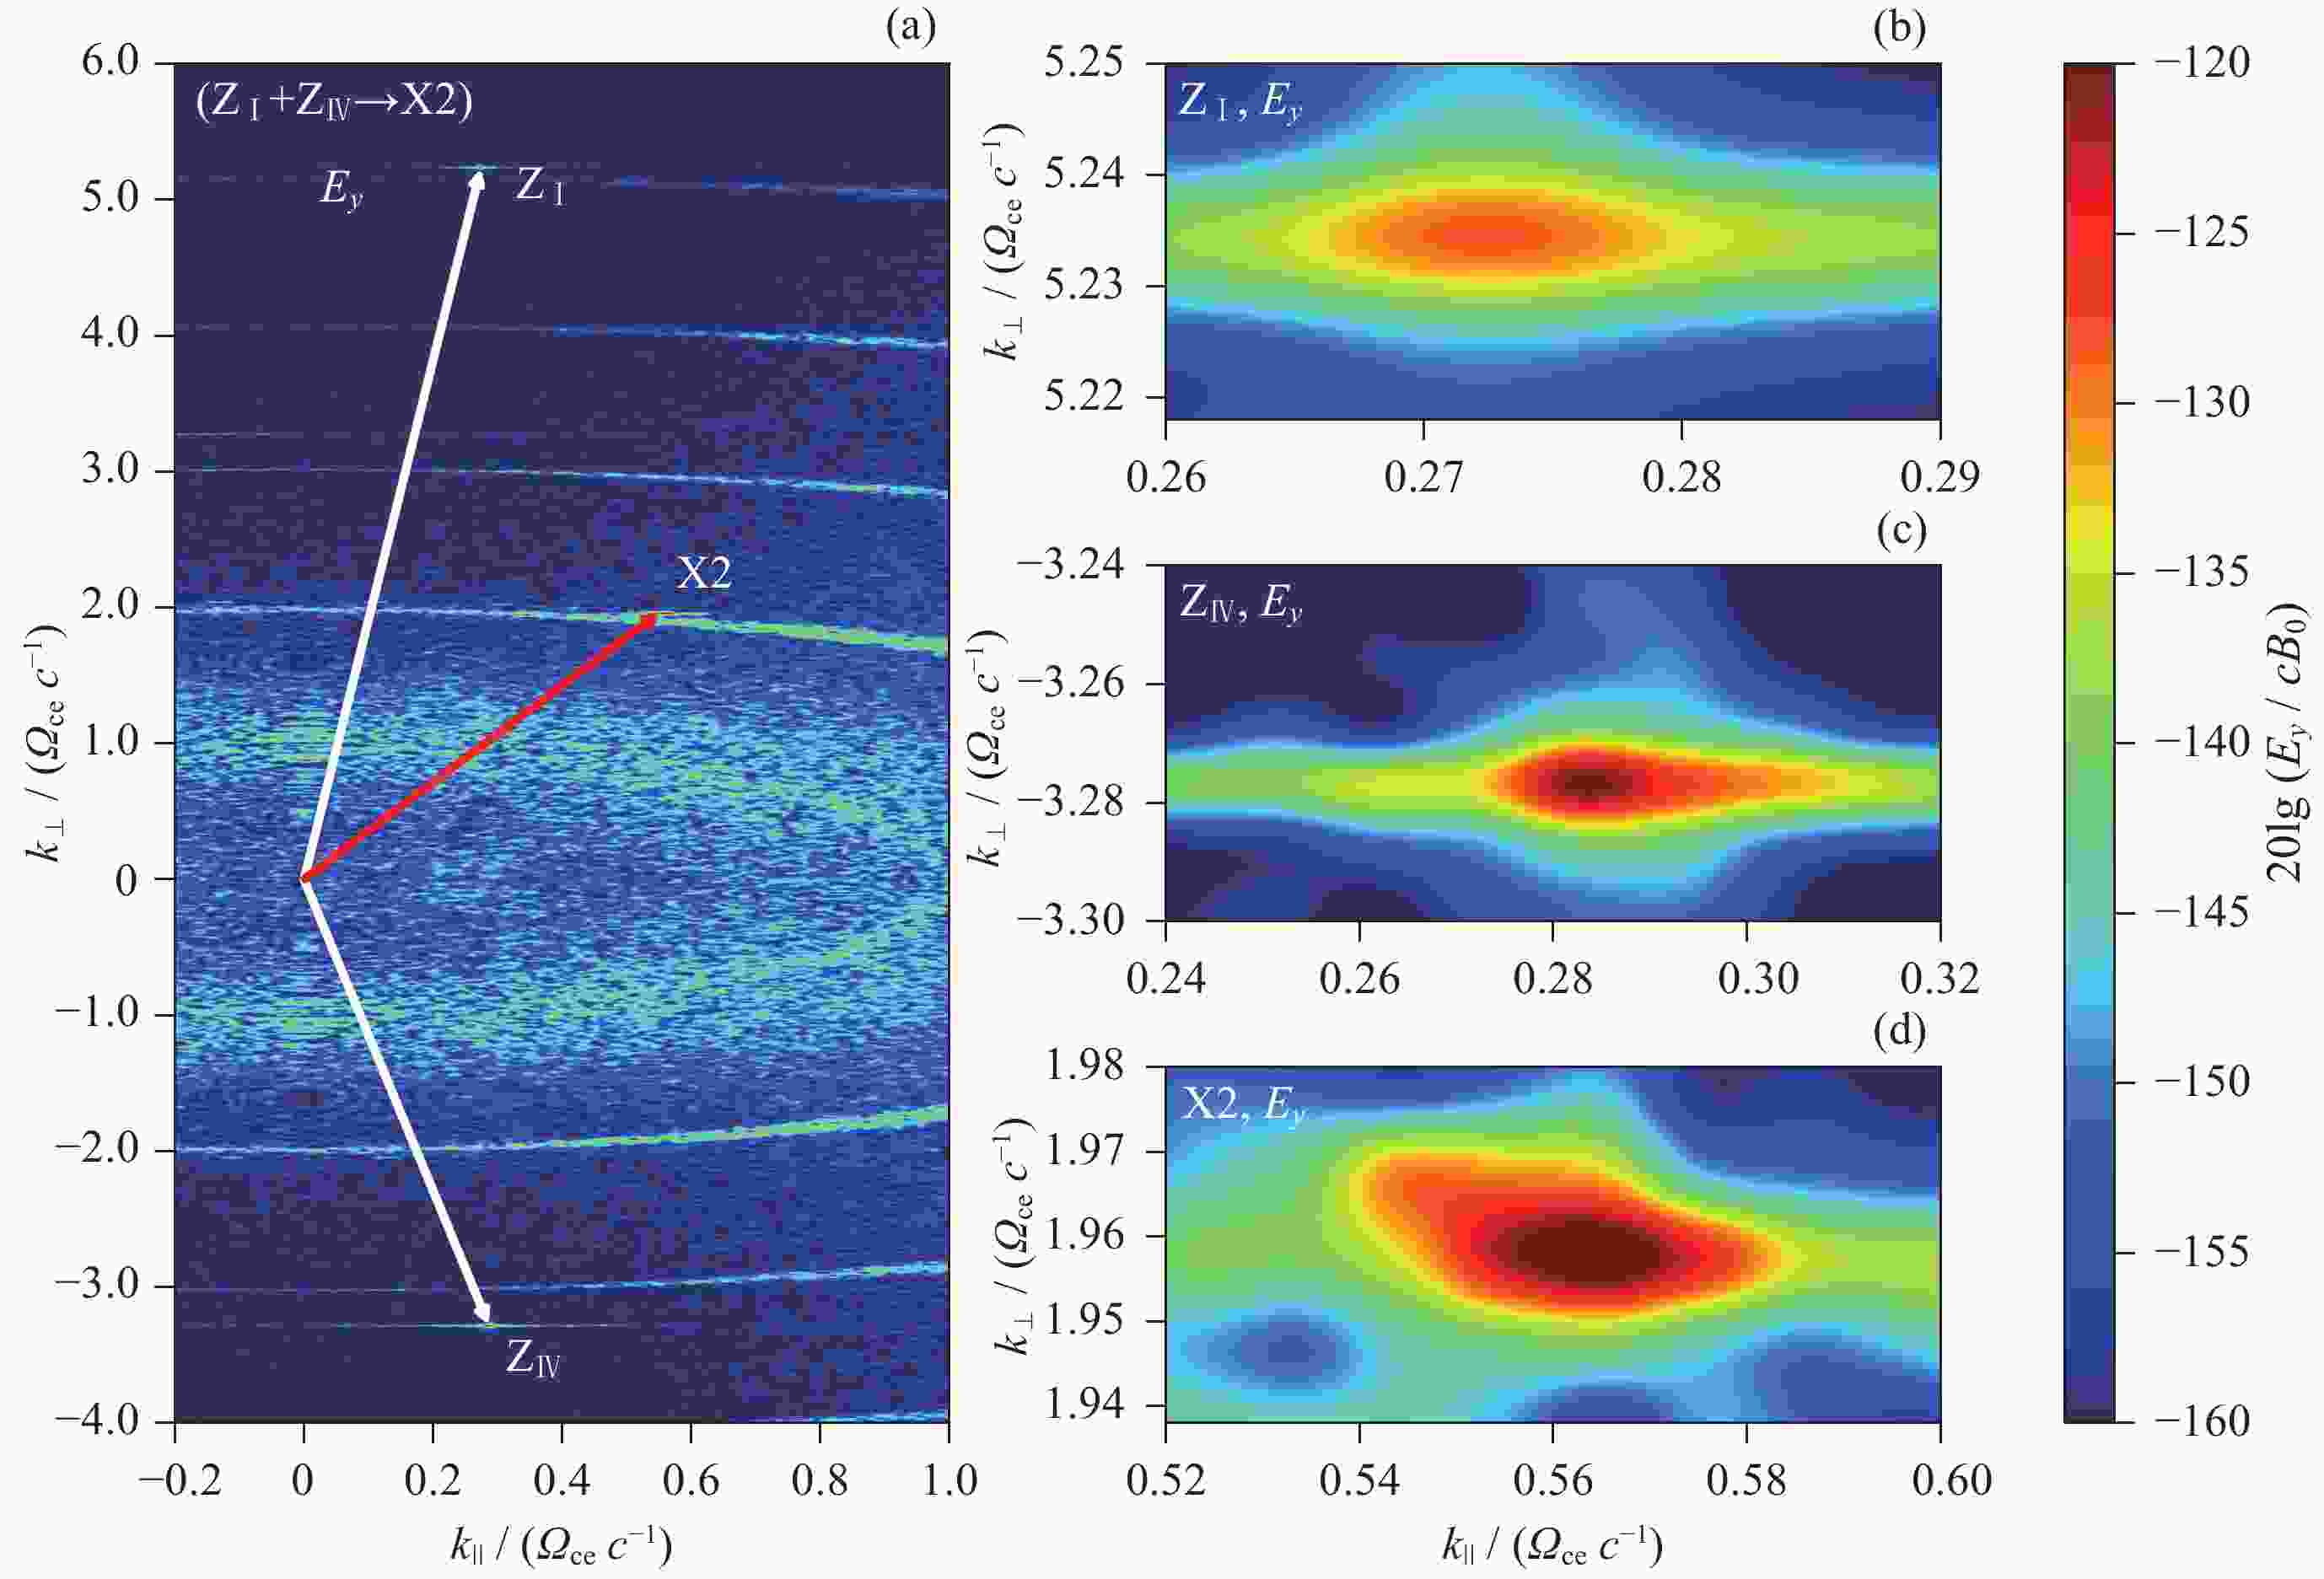
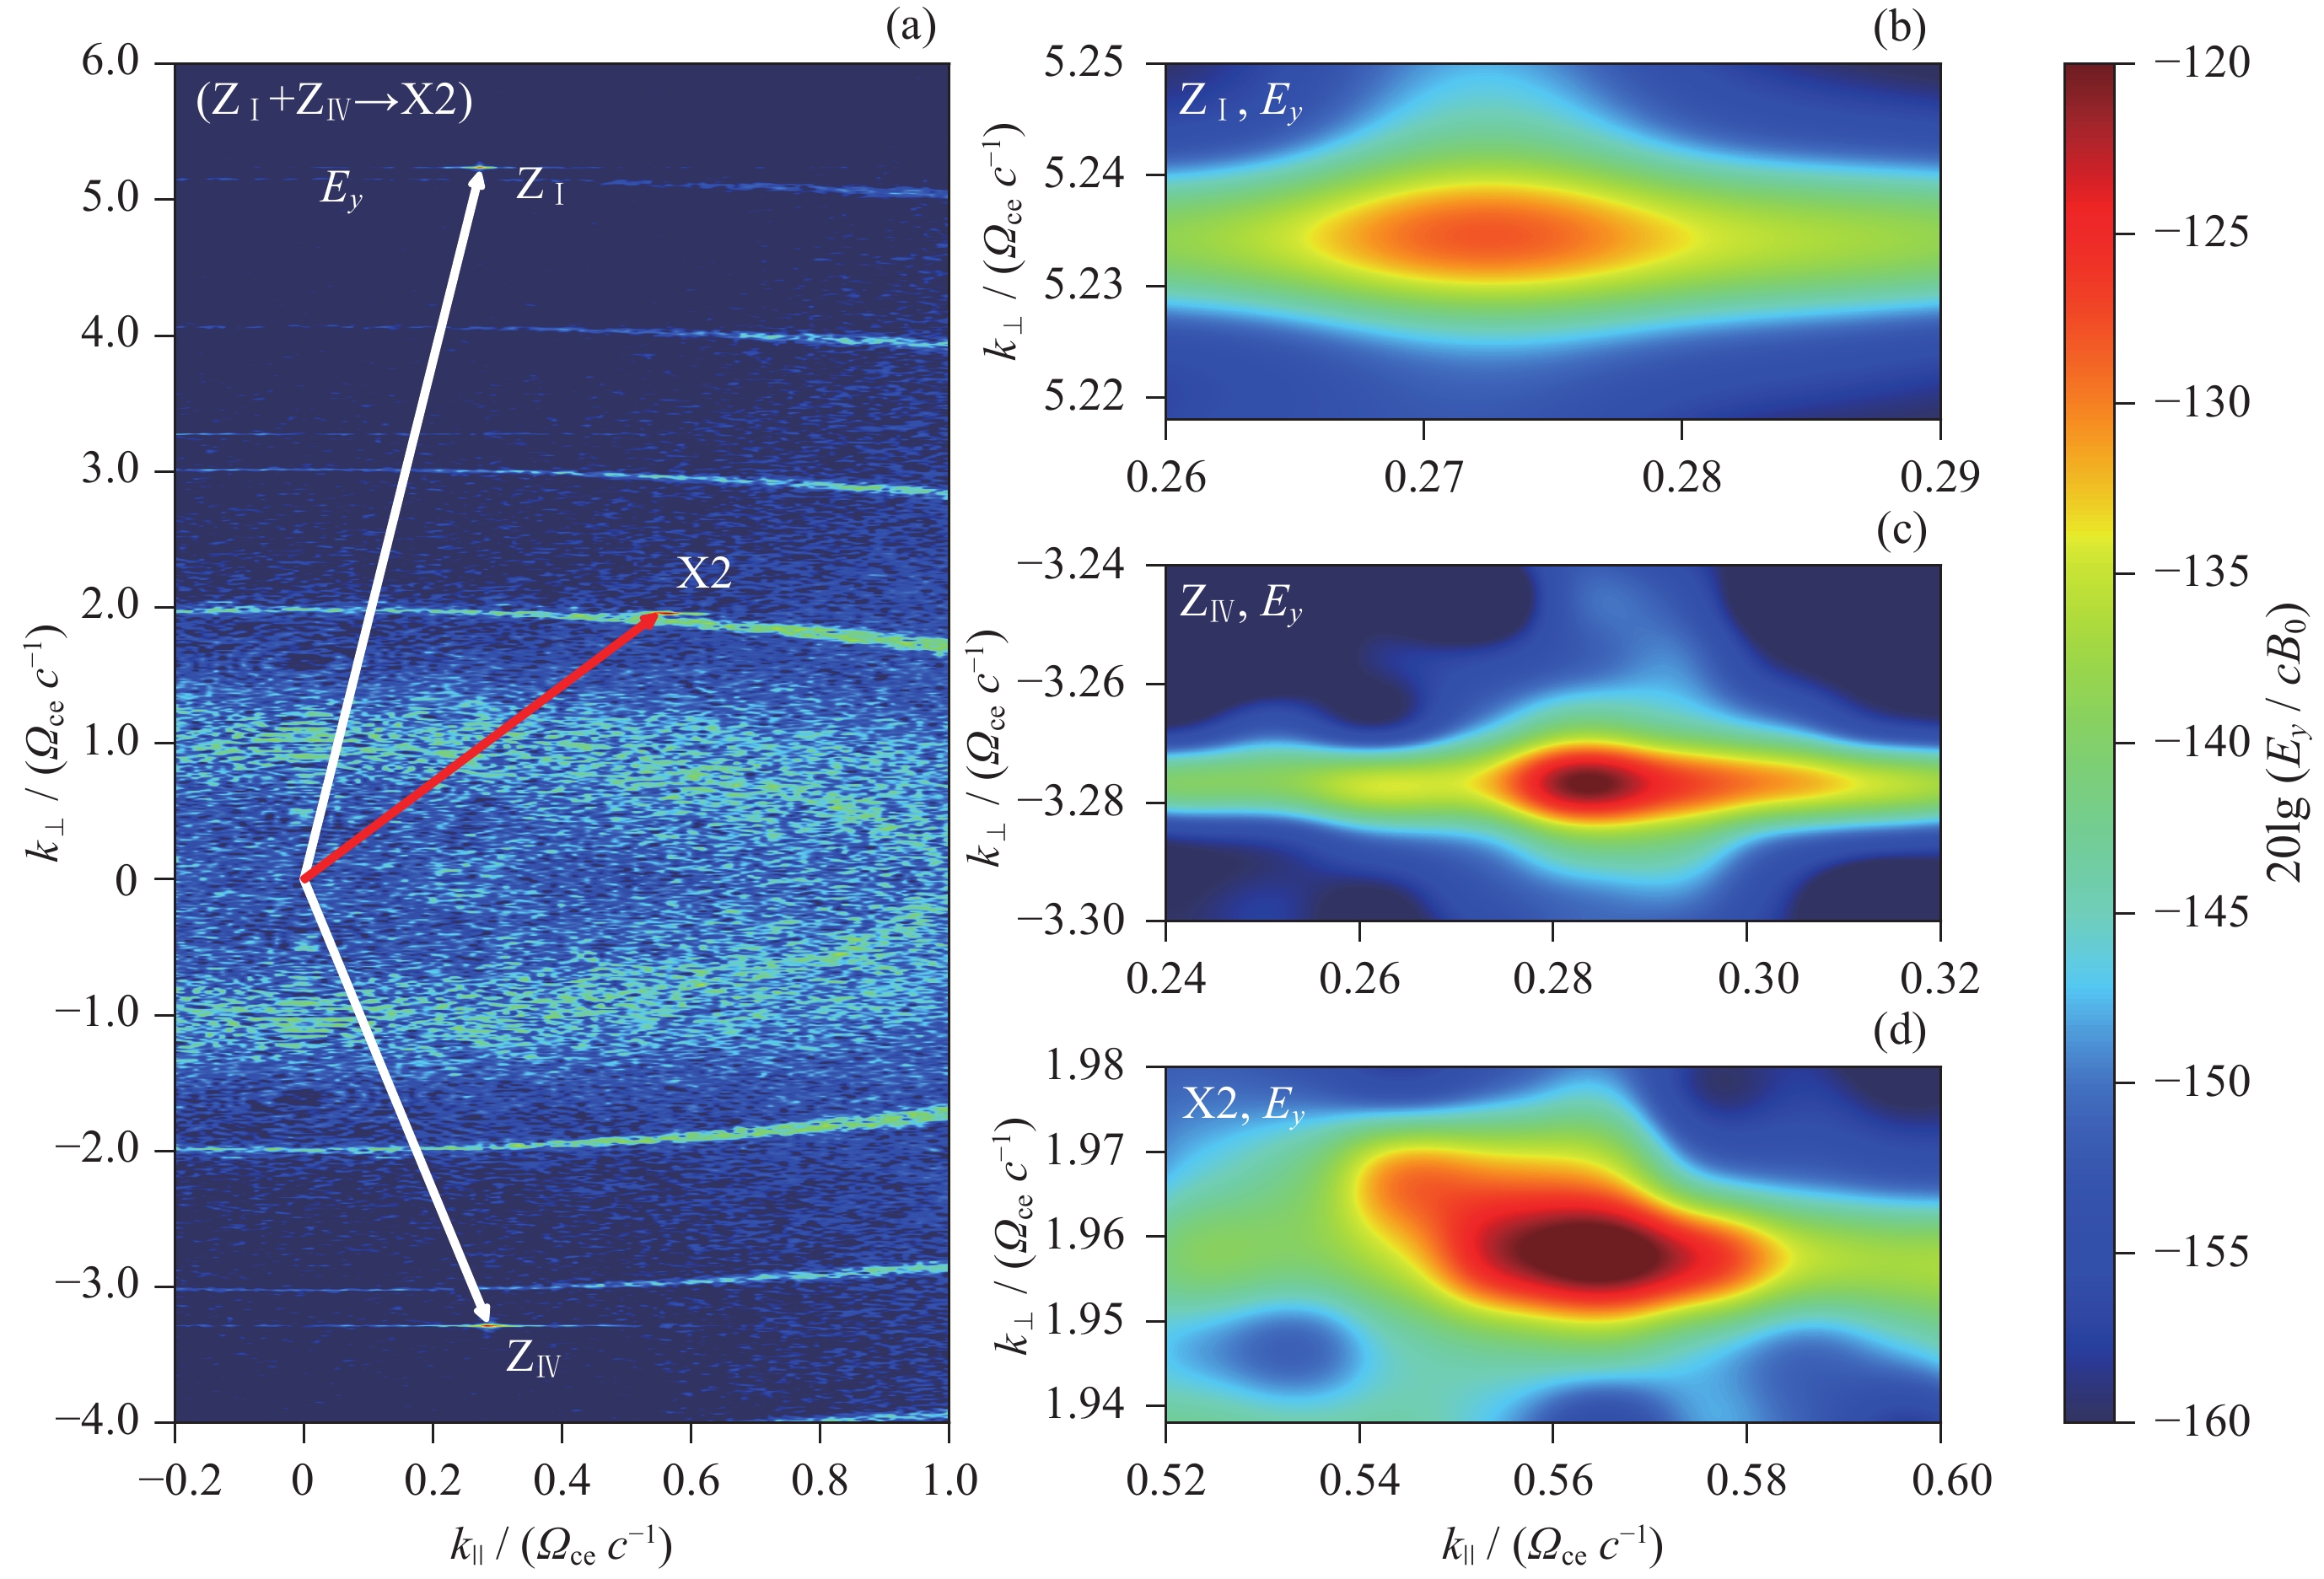
图 3 (a) Case A中电场$ {E}_{y} $分量在波数空间($ {k}_{\parallel } $, $ {k}_{\perp } $)分布, 箭头为($ \mathrm{Z}{\mathrm{}}_{\mathrm{I}}+{\mathrm{Z}}_{\mathrm{I}\mathrm{V}}\to \mathrm{X}2 $)三种波模的波矢关系. (b)~(d)分别为$ \mathrm{Z}{\mathrm{}}_{\mathrm{I}},\;{\mathrm{Z}}_{\mathrm{I}\mathrm{V}}, \;{\mathrm{X}}2$的波数空间放大结果. 分析时间段为3600~4000 $ {\varOmega }_{\mathrm{c}\mathrm{e}}^{-1} $
Figure 3. (a) Maximum intensity distribution of $ {E}_{y} $ component in wave vector space ($ {k}_{\parallel } $, $ {k}_{\perp } $) of Case A. The arrows refer to the wave vectors of the three wave modes ($ \mathrm{Z}{\mathrm{}}_{\mathrm{I}}+{\mathrm{Z}}_{\mathrm{I}\mathrm{V}}\to \mathrm{X}2 $). (b)~(d) The enlarged views of $ \mathrm{Z}{\mathrm{}}_{\mathrm{I}} $, $ {\mathrm{Z}}_{\mathrm{I}\mathrm{V}} $, $ \mathrm{X}2 $, respectively. The analysis time period is 3600 to 4000 $ {\varOmega }_{\mathrm{c}\mathrm{e}}^{-1} $
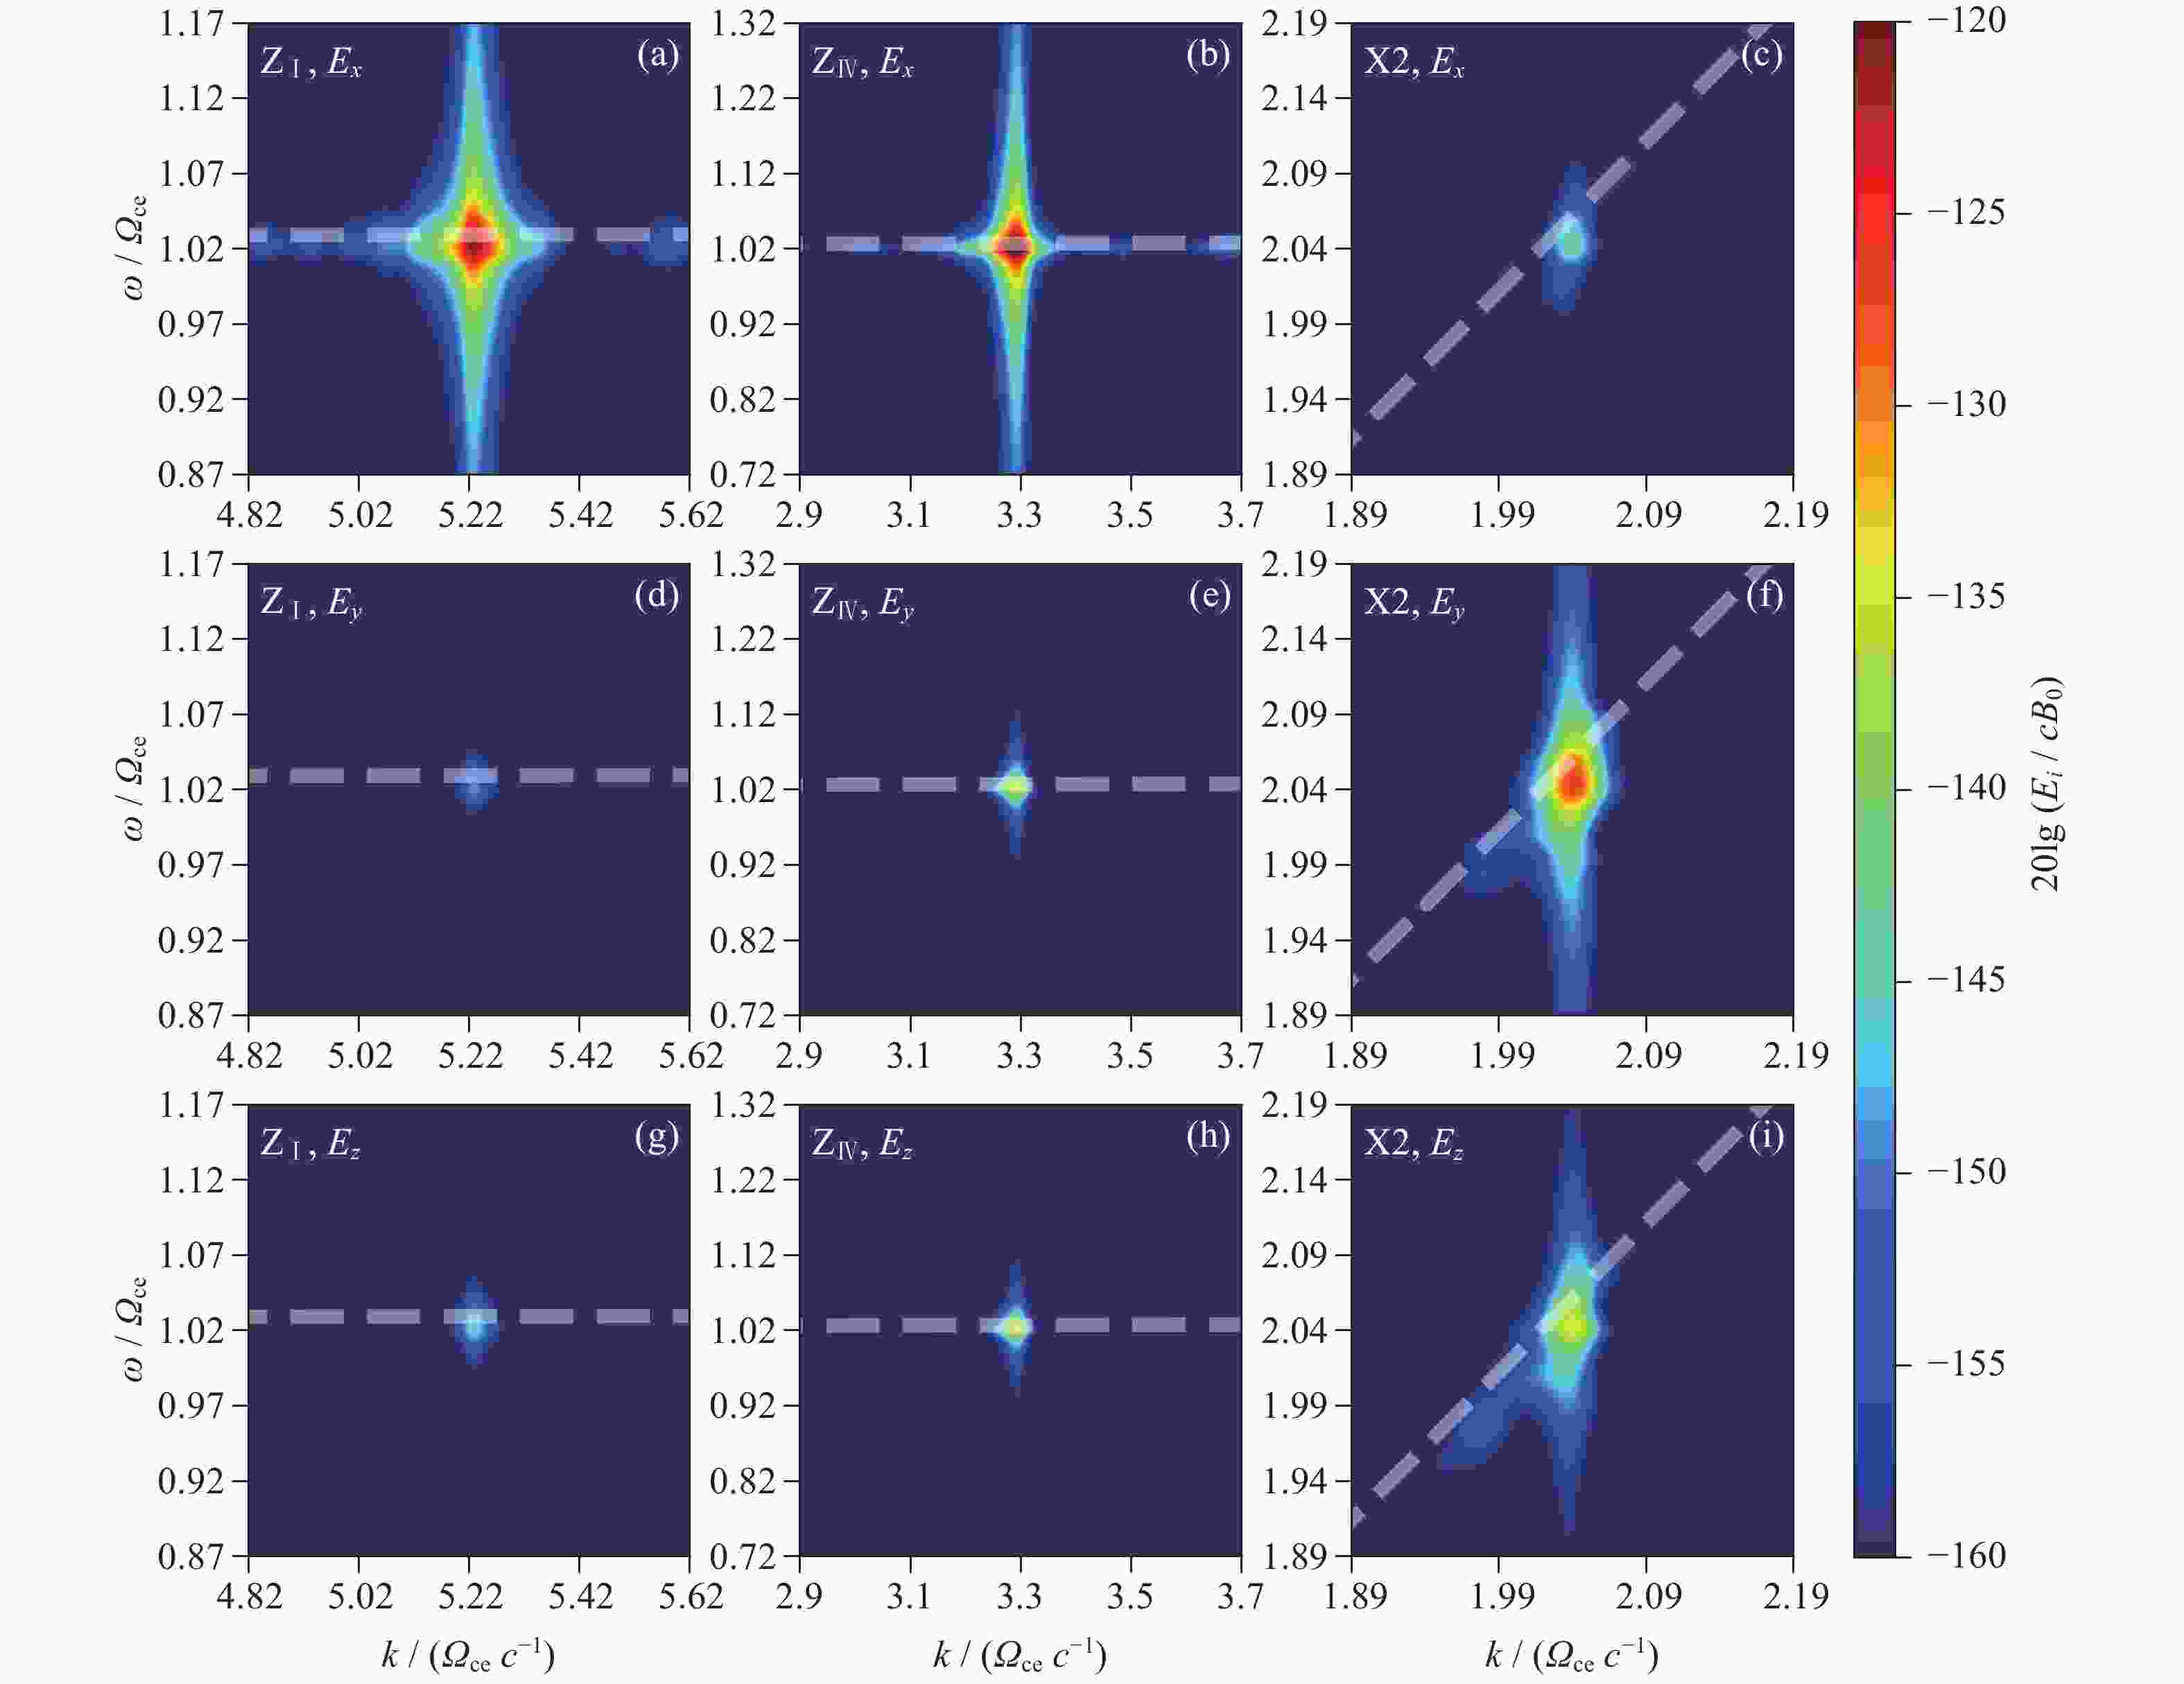
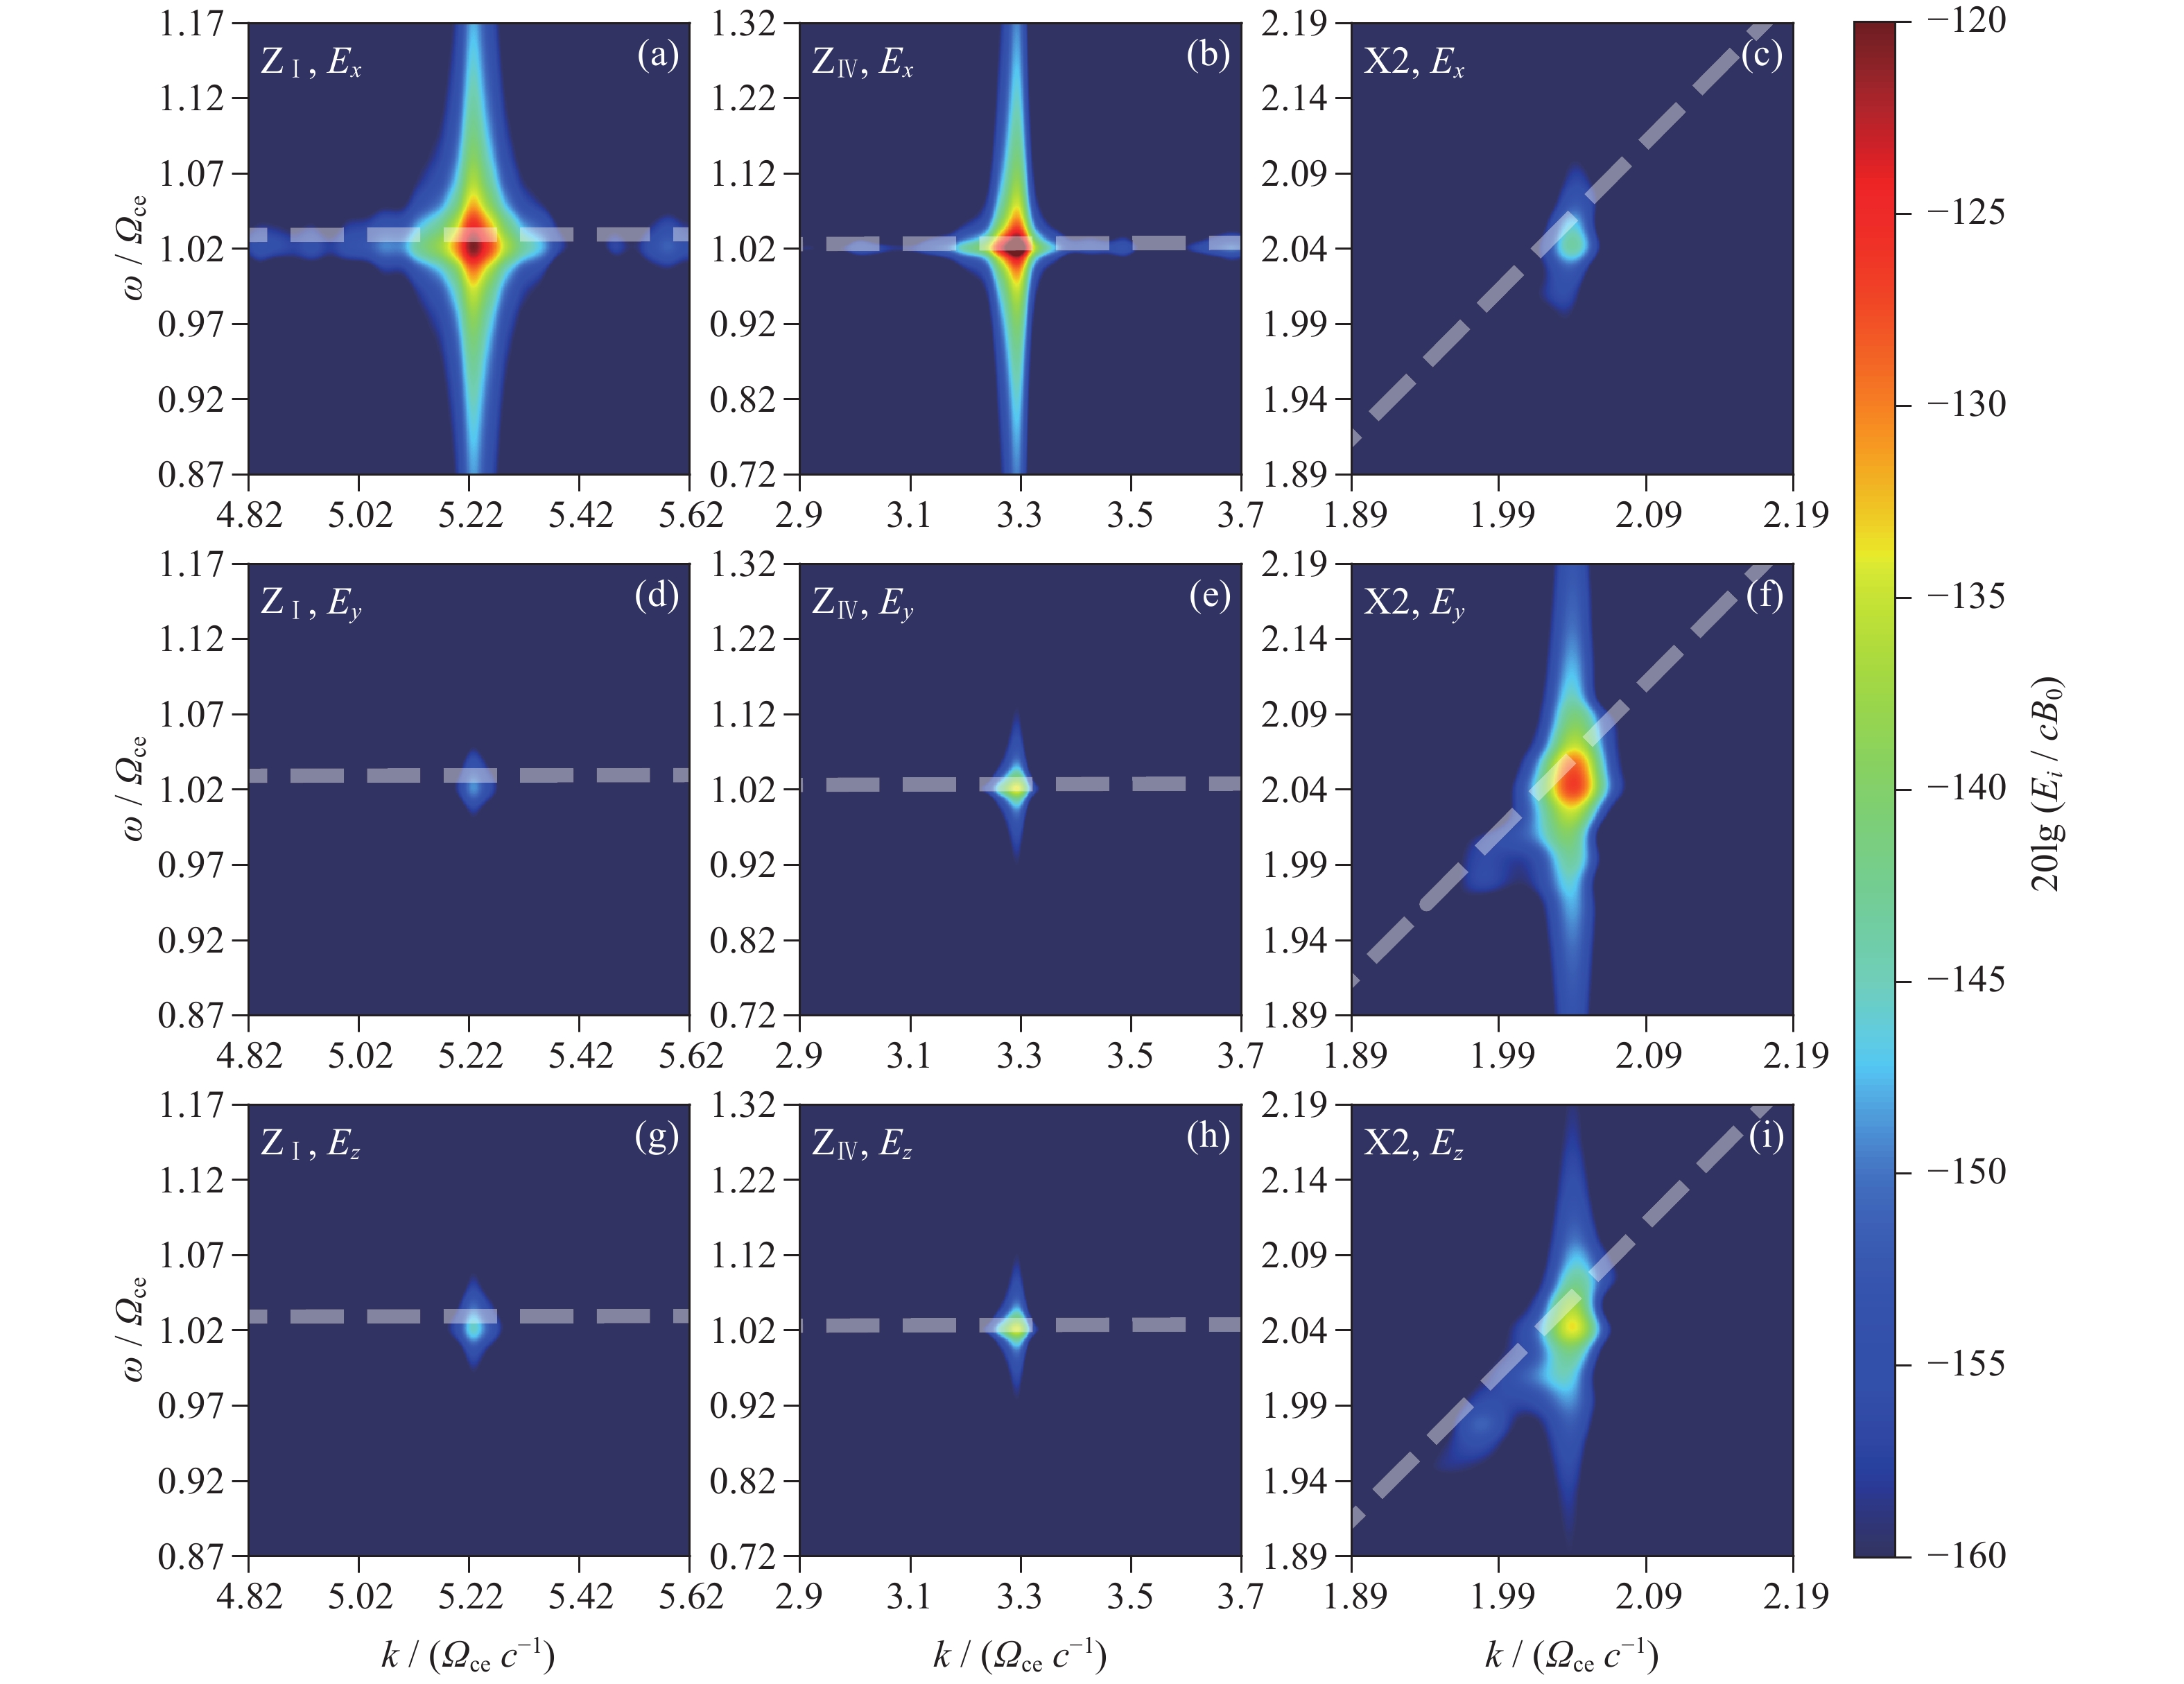
图 4 Case A中各电场分量强度的色散空间($ \omega $, $ k $)分布. $ {\mathrm{Z}}_{\mathrm{I}} $, $ {\mathrm{Z}}_{\mathrm{I}\mathrm{V}} , \;{\mathrm{X}}2$在相应传播方向($ \theta $=87°, –85°, 74°)各电场($ {E}_{x} $, $ {E}_{y} $, $ {E}_{z} $)分量的色散空间分布. 分析时间段为3600~4000 $ {\varOmega }_{\mathrm{c}\mathrm{e}}^{-1} $. 图中白色虚线为冷等离子体波模色散曲线
Figure 4. Maximum intensity distribution of each electric field ($ {E}_{x} $, $ {E}_{y} $, $ {E}_{z} $) component for $ {\mathrm{Z}}_{\mathrm{I}} $, $ {\mathrm{Z}}_{\mathrm{I}\mathrm{V}} $, and ${\mathrm{X}}2 $ in dispersion space ($ \omega $, $ k $) at the corresponding propagation directions ($ \theta $=87°, –85°, 74°) of Case A. The analysis time period is 3600~4000 $ {\varOmega }_{\mathrm{c}\mathrm{e}}^{-1} $. The white dashed lines present the cold plasma dispersion curve
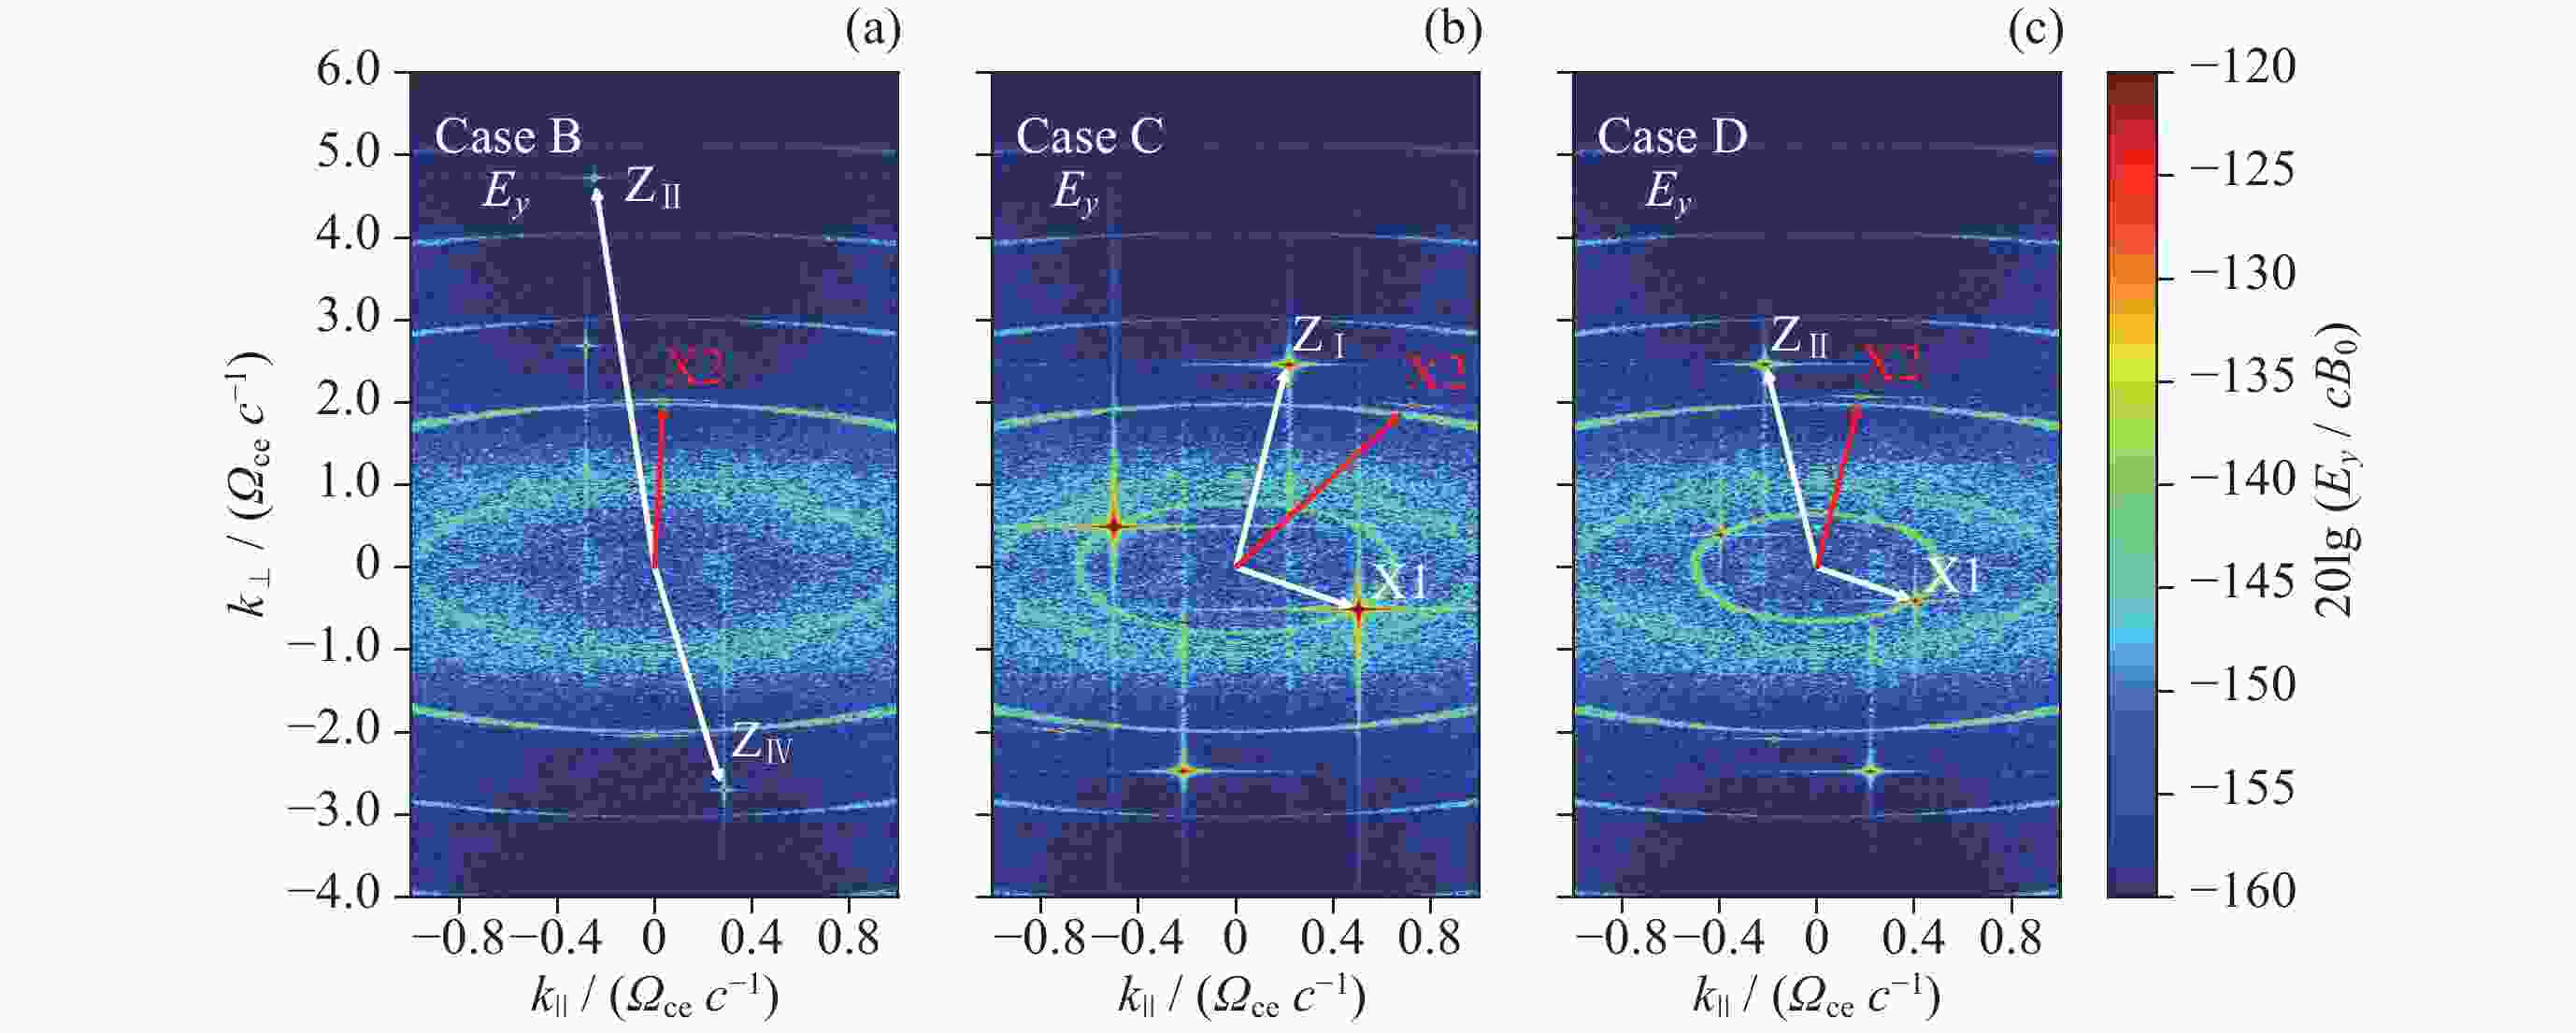
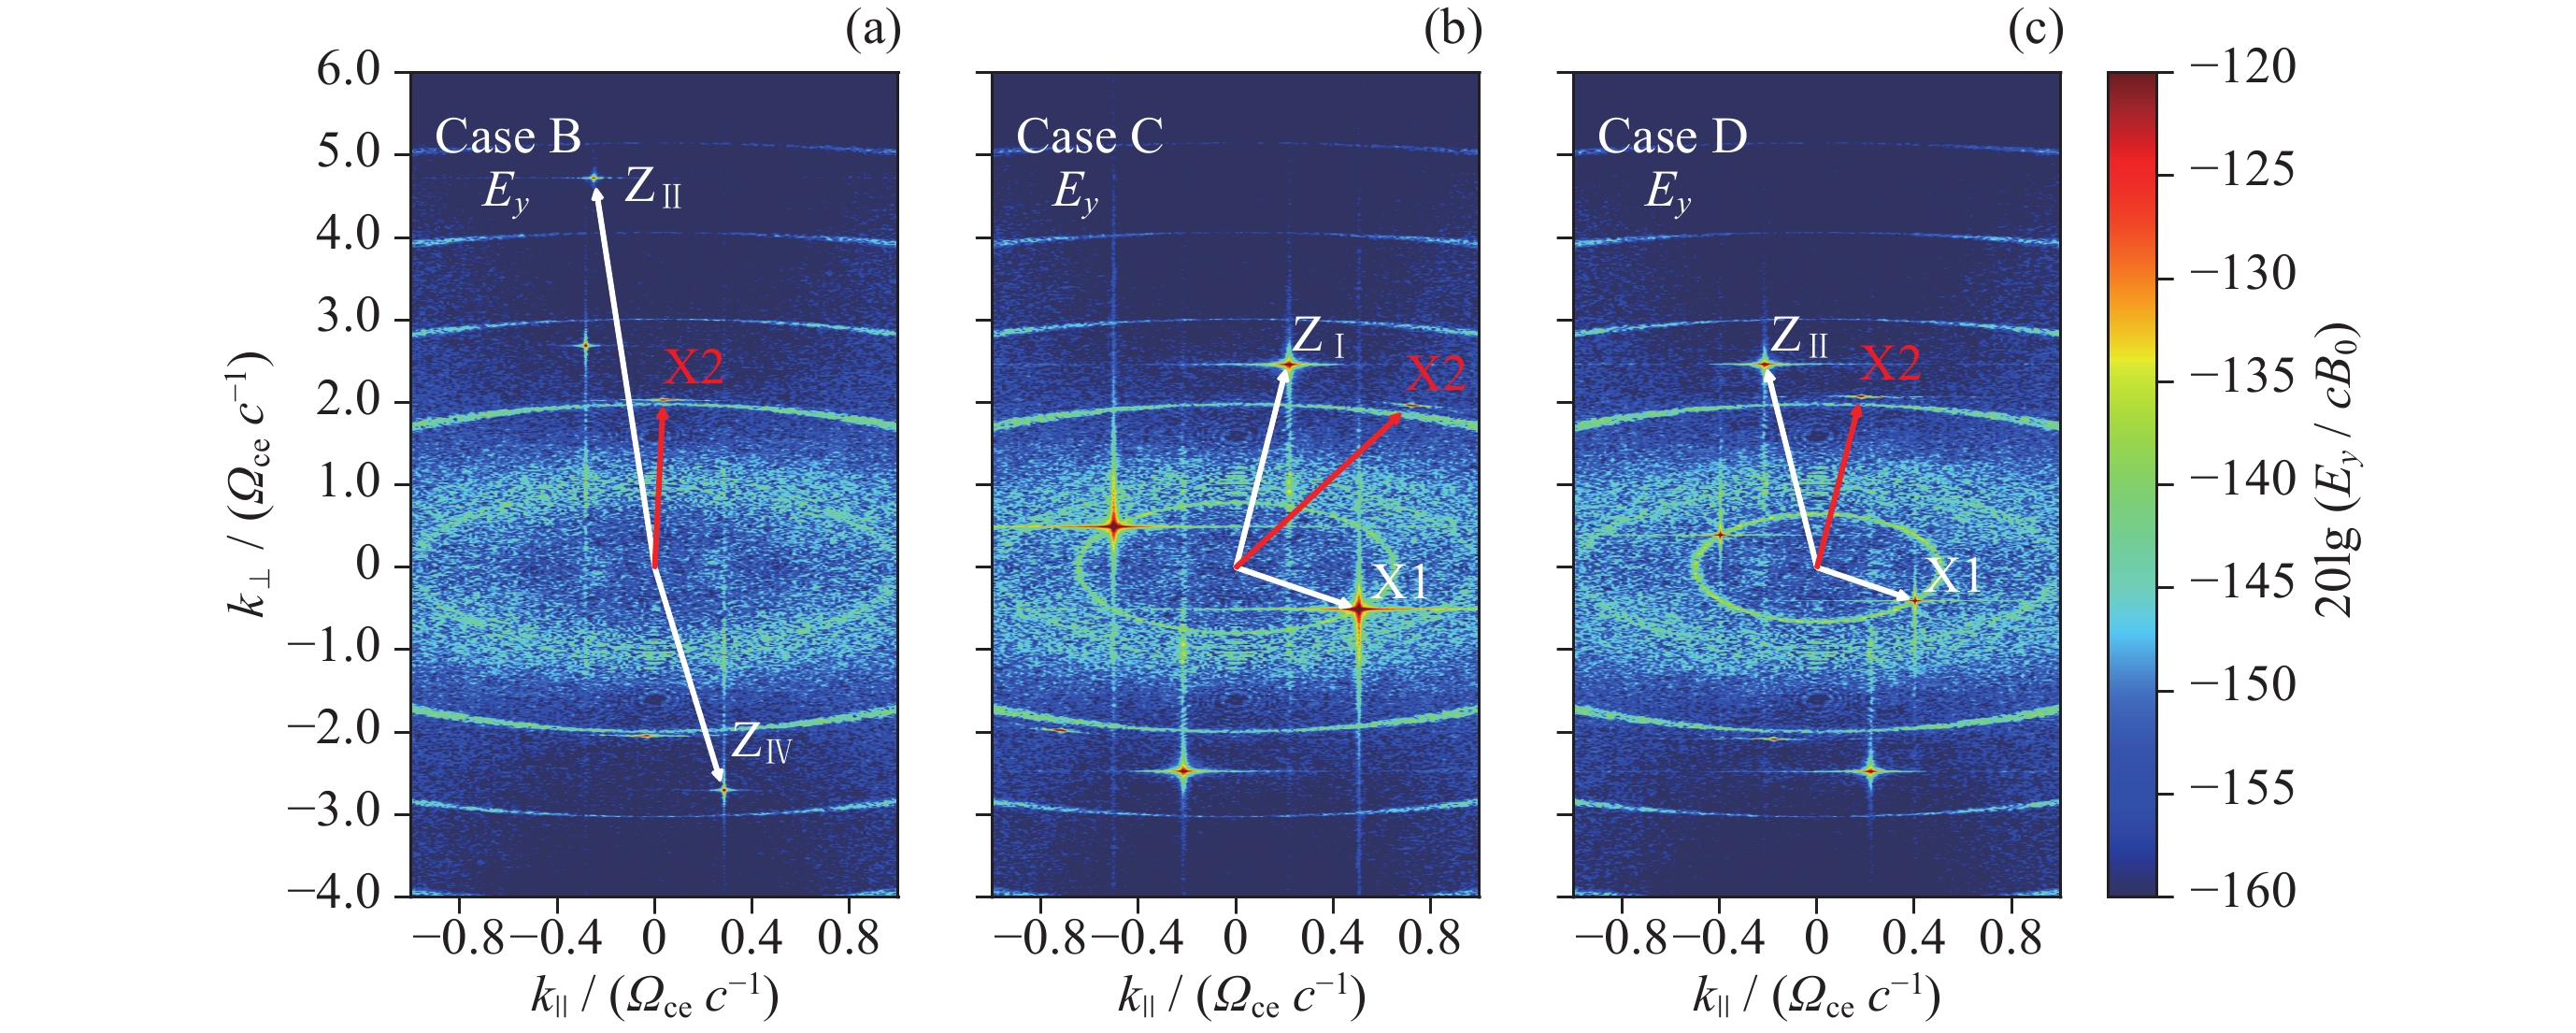
图 5 3600~4000 $ {\varOmega }_{{\mathrm{ce}}}^{-1} $时间段内Case B~D中电场$ {E}_{y} $分量在波数空间($ {k}_{\parallel } $, $ {k}_{\perp } $)分布情况. 白色箭头为对应Z与X1的波矢, 红色箭头为对应X2的波矢
Figure 5. Maximum intensity distribution of the $ {E}_{y} $ component in wave vector space ($ {k}_{\parallel } $, $ {k}_{\perp } $) of Cases B~D within 3600~4000 $ {\varOmega }_{\mathrm{c}\mathrm{e}}^{-1} $. The white arrows represent the wave vectors of Z and X1, and the red arrows represent X2
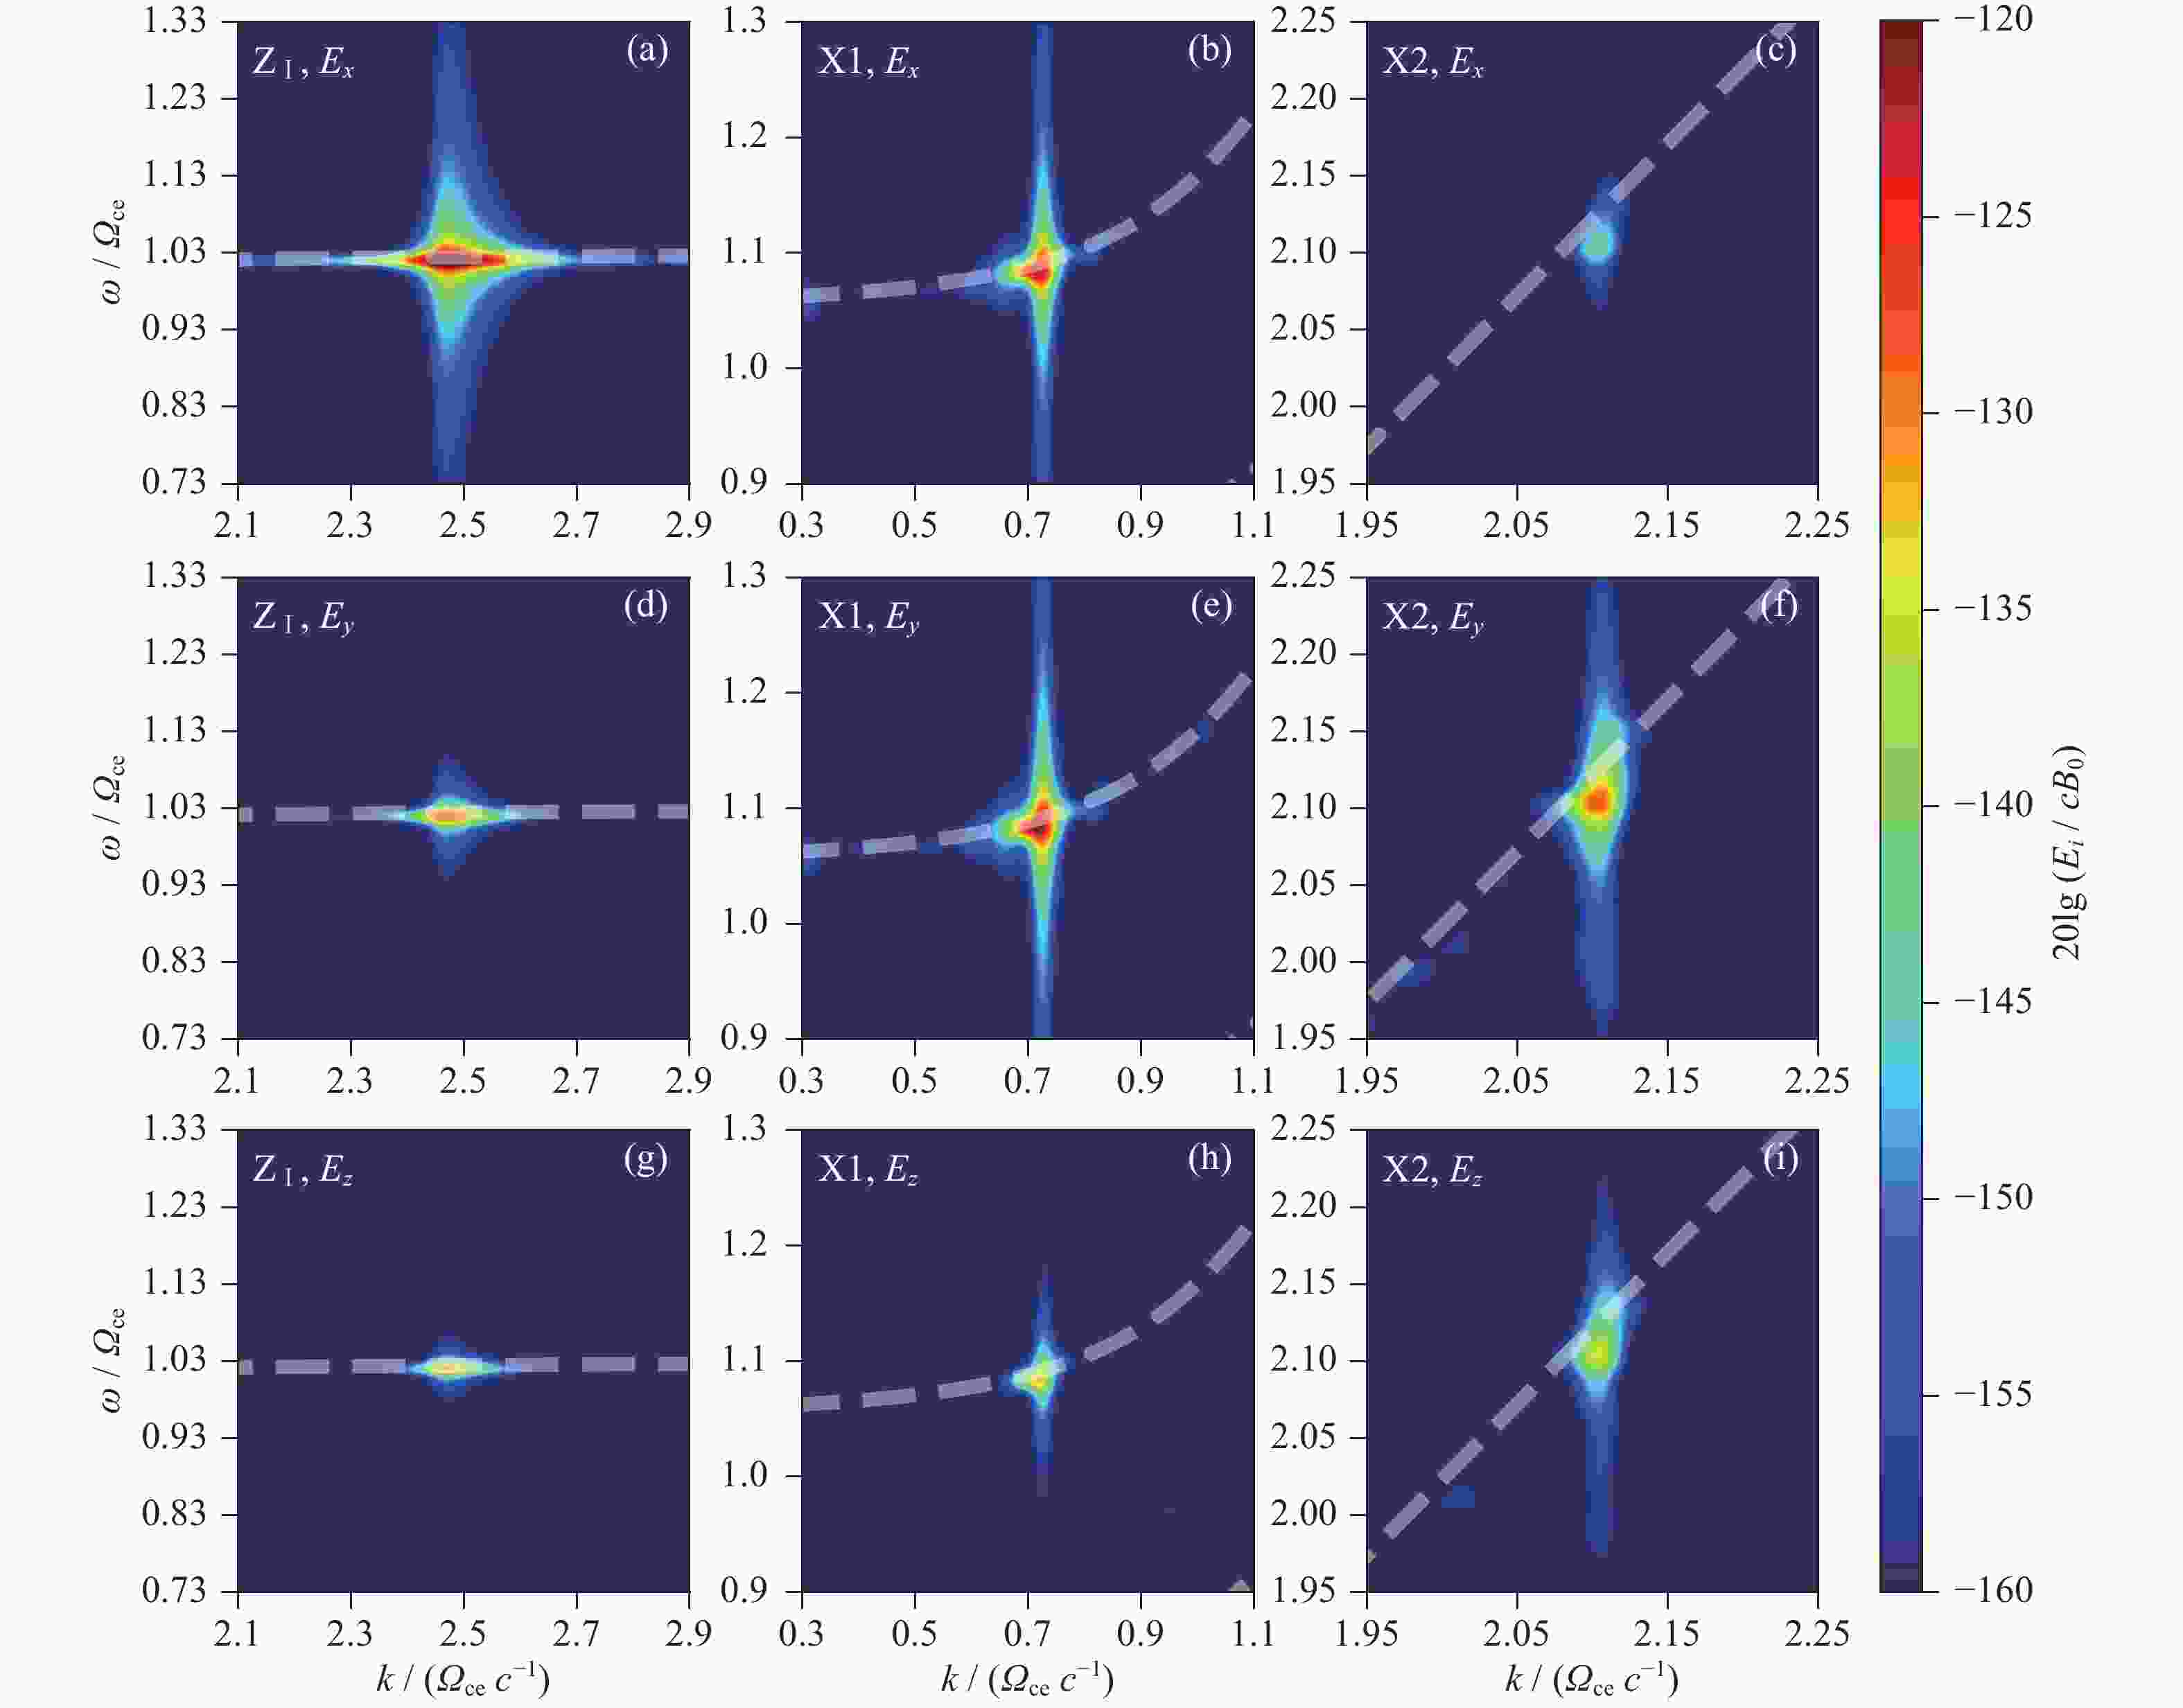
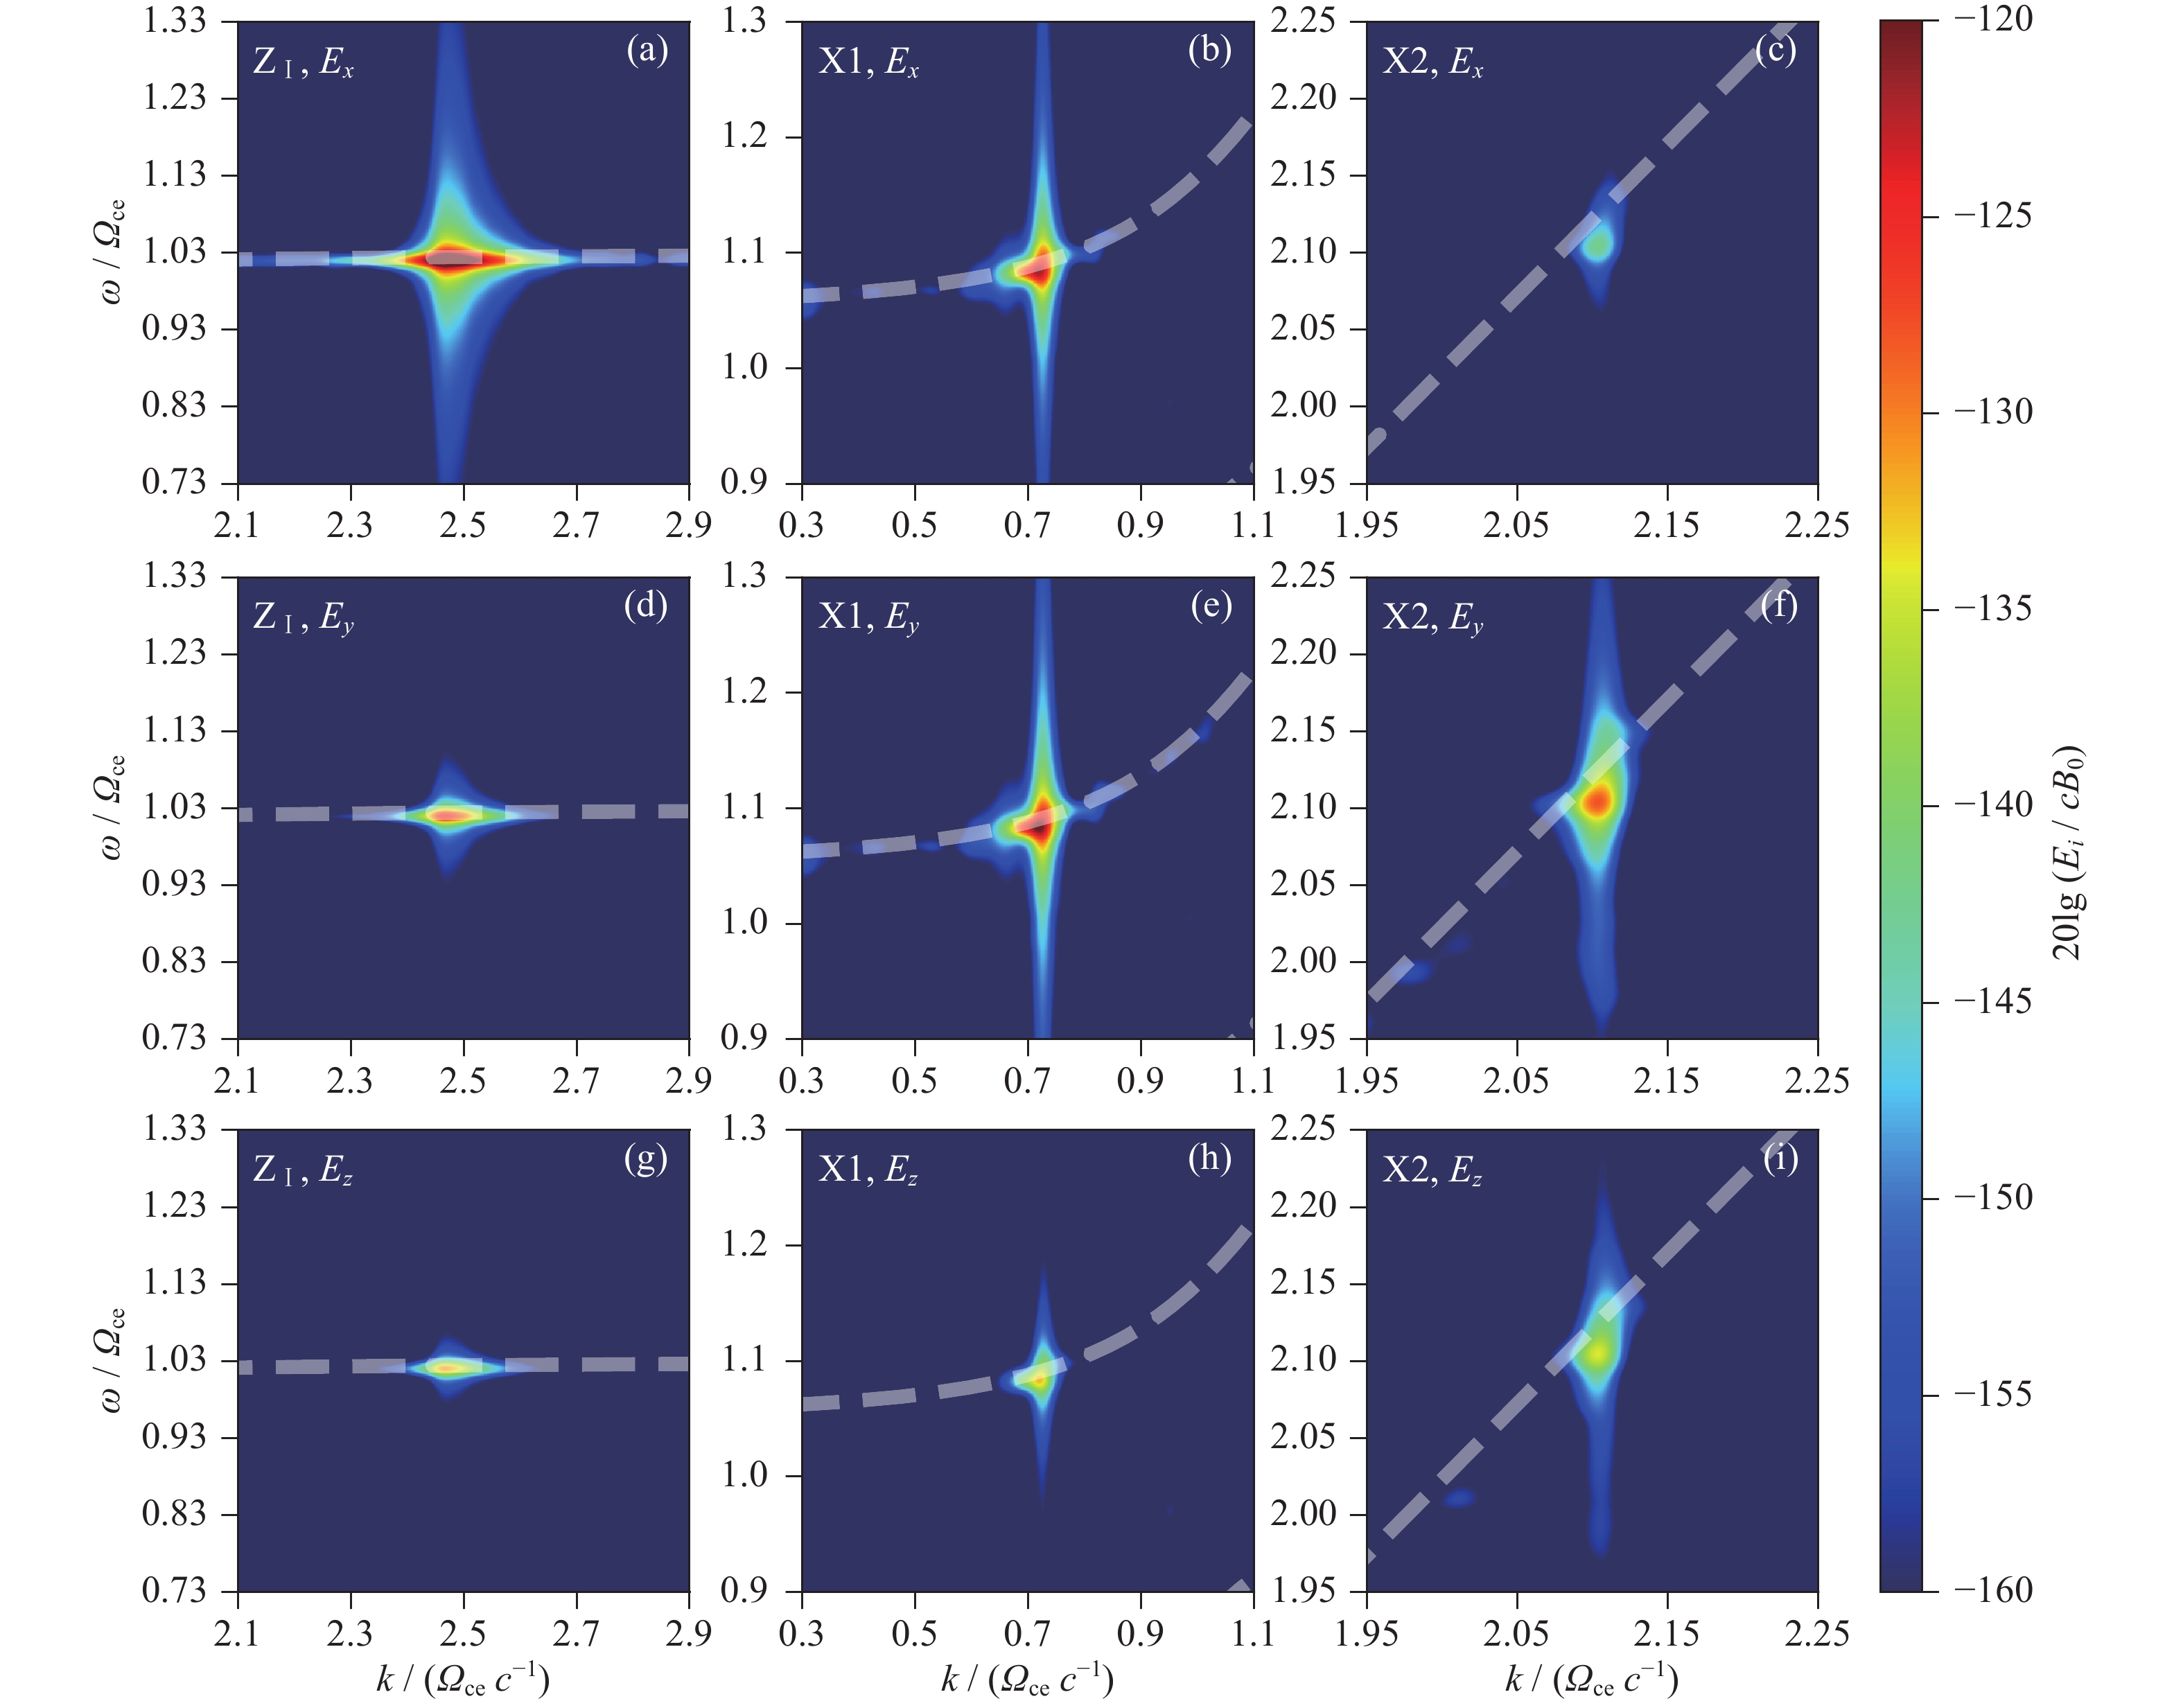
图 6 Case C中各电场分量($ {E}_{x} $, $ {E}_{y} $, $ {E}_{z} $)强度的色散空间($ \omega $, $ k $)分布. 分析时间段为3600~4000 $ {\varOmega }_{\mathrm{c}\mathrm{e}}^{-1} $. 白色虚线为冷等离子体波模色散曲线
Figure 6. Maximum intensity distribution of each electric field ($ {E}_{x} $, $ {E}_{y} $, $ {E}_{z} $) component in dispersion space ($ \omega $, $ k $) for $ {\mathrm{Z}}_{\mathrm{I}} $, X1, X2 of Case C. The analysis time period is 3600~4000 $ {\varOmega }_{\mathrm{c}\mathrm{e}}^{-1} $. The white dashed lines present the cold plasma dispersion curve
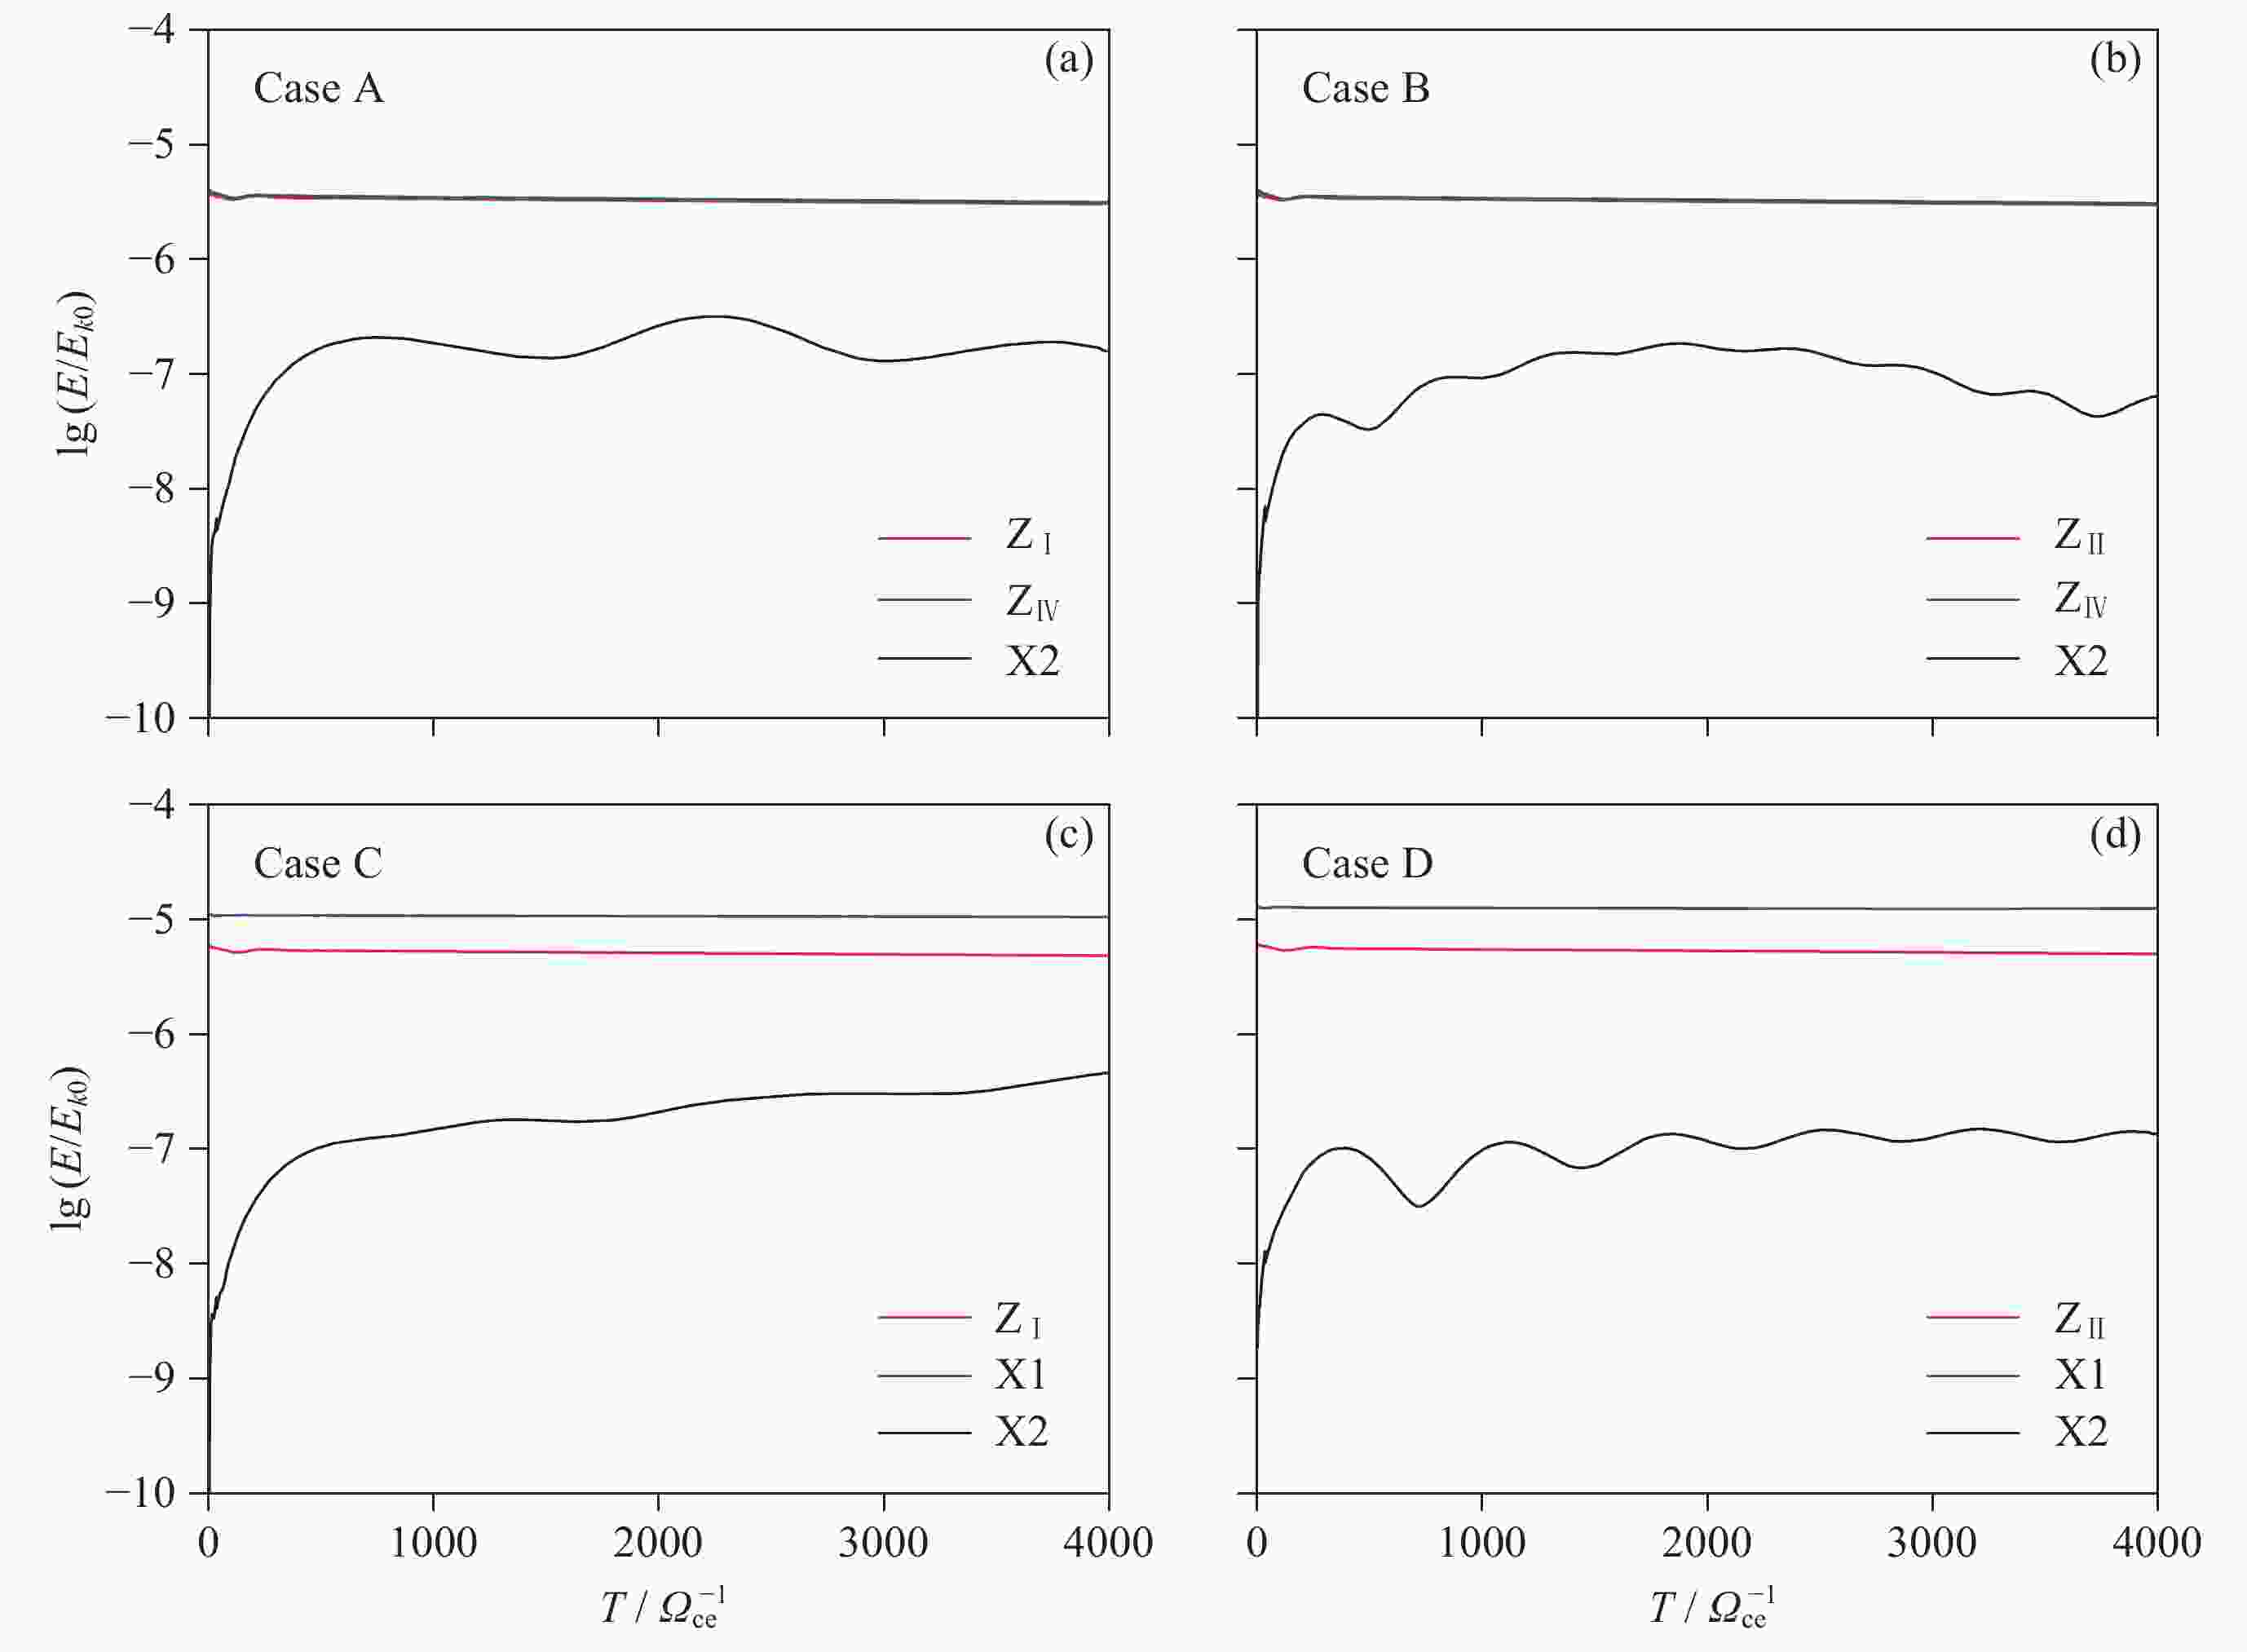
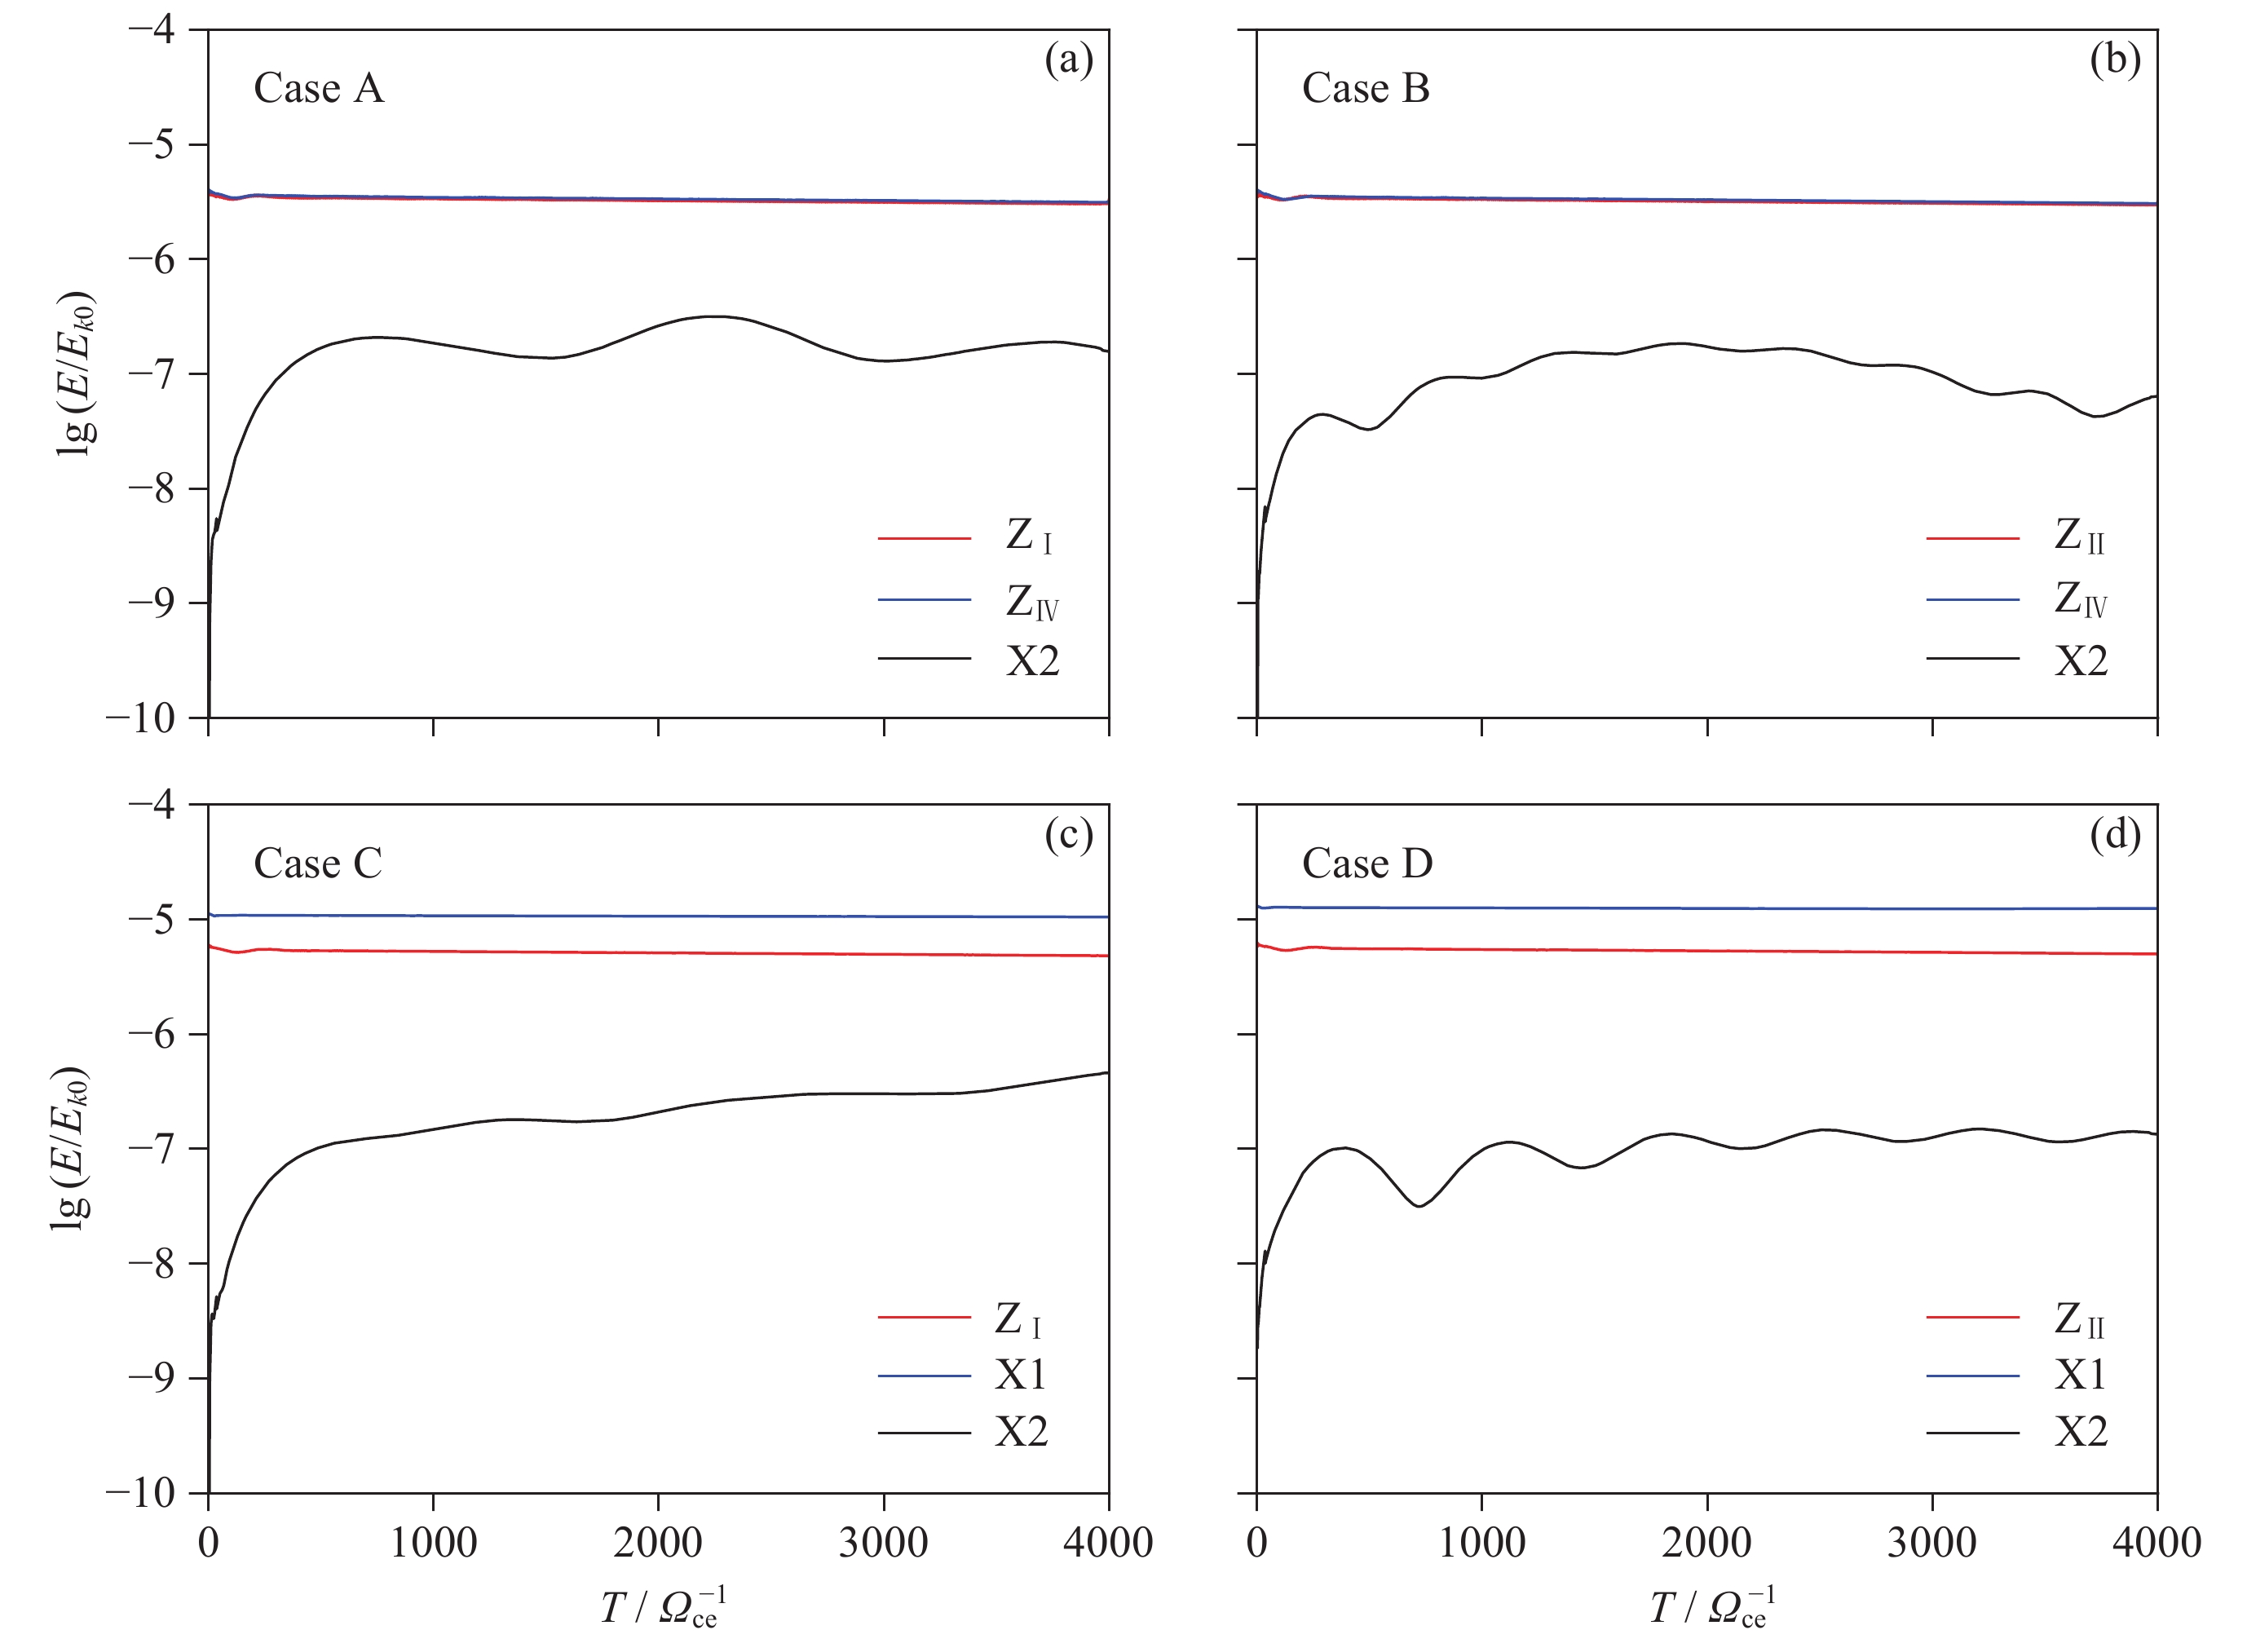
图 7 0~4000 $ {\varOmega }_{\mathrm{c}\mathrm{e}}^{-1} $时间段内, Case A~D各模式能量随时间演化关系. 所有能量取值 均归一化为初始时刻电子总能量$ {E}_{k0} $
Figure 7. Temporal evolution of the energies of each mode in Cases A~D in 0~4000 $ {\varOmega }_{{\mathrm{ce}}}^{-1} $. The values are normalized to the initial kinetic energy of total electrons $ {E}_{k0} $
表 1 Case A~D各模式参数
Table 1. Parameters of Z, X1 and X2 modes for Cases A~D
mode $ \omega \left({\varOmega }_{\mathrm{c}\mathrm{e}}\right) $ $ k({\varOmega }_{\mathrm{c}\mathrm{e}}/c) $ $ \theta / \left({\mathrm{}}^{\circ }\right) $ $ A_0\left(\times10^{-5}cB_0\right) $ Case A $ {\mathrm{Z}}_{\mathrm{I}} $ 1.0293 5.242 87 3.100 $ {\mathrm{Z}}_{\mathrm{I}\mathrm{V}} $ 1.0280 3.290 –85 2.975 $ \mathrm{X}2 $ 2.0573 2.040 74 Case B $ {\mathrm{Z}}_{\mathrm{I}\mathrm{I}} $ 1.0293 4.737 93 3.100 $ {\mathrm{Z}}_{\mathrm{I}\mathrm{V}} $ 1.0256 2.711 –84 2.875 $ \mathrm{X}2 $ 2.0549 2.034 89 Case C $ {\mathrm{Z}}_{\mathrm{I}} $ 1.0246 2.475 85 3.500 $ \mathrm{X}1 $ 1.0890 0.707 –45 2.750 $ \mathrm{X}2 $ 2.1136 2.092 70 Case D $ {\mathrm{Z}}_{\mathrm{I}\mathrm{I}} $ 1.0246 2.478 95 3.500 $ \mathrm{X}1 $ 1.0740 0.561 –45 3.275 $ \mathrm{X}2 $ 2.0986 2.079 85 注 $ \omega $, $ k $, $ \theta $, $ {A}_{0} $分别为相应模式的频率、波数、$ \boldsymbol{k} $与$ \boldsymbol{B} $夹角、$ {E}_{x} $扰动量振幅值.  下载: 导出CSV
-
[1] TREUMANN R A. The electron–cyclotron maser for astrophysical application[J]. The Astronomy and Astrophysics Review, 2006, 13(4): 229-315 doi: 10.1007/s00159-006-0001-y [2] MELROSE D B. Coherent emission mechanisms in astrophysical plasmas[J]. Reviews of Modern Plasma Physics, 2017, 1(1): 5 doi: 10.1007/s41614-017-0007-0 [3] TWISS R Q. Radiation transfer and the possibility of negative absorption in radio astronomy[J]. Australian Journal of Physics, 1958, 11(4): 564-579 doi: 10.1071/PH580564 [4] WU C S, LEE L C. A theory of the terrestrial kilometric radiation[J]. The Astrophysical Journal, 1979, 230: 621-626 doi: 10.1086/157120 [5] WU C S. Kinetic cyclotron and synchrotron maser instabilities: radio emission processes by direct amplification of radiation[J]. Space Science Reviews, 1985, 41(3): 215-298 [6] ASCHWANDEN M J. Relaxation of the loss-cone by quasi-linear diffusion of the electron-cyclotron maser instability in the solar corona[J]. Astronomy and Astrophysics Supplement Series, 1990, 85: 1141-1177 [7] YOON P H, ZIEBELL L F. Quasilinear evolution of cyclotron maser instability[J]. Physical Review E, 1995, 51(5): 4908-4916 doi: 10.1103/PhysRevE.51.4908 [8] ZIEBELL L F, YOON P H. Quasilinear analysis of loss-cone driven weakly relativistic electron cyclotron maser instability[J]. Physics of Plasmas, 1995, 2(4): 1285-1295 doi: 10.1063/1.871459 [9] LEE S Y, YI S, LIM D, et al. Loss cone-driven cyclotron maser instability[J]. Journal of Geophysical Research: Space Physics, 2013, 118(11): 7036-7044 doi: 10.1002/2013JA019298 [10] MELROSE D B, DULK G A. Electron-cyclotron masers as the source of certain solar and stellar radio bursts[J]. The Astrophysical Journal, 1982, 259: 844-858 doi: 10.1086/160219 [11] YOUSEFZADEH M, NING H, CHEN Y. Harmonic electron cyclotron maser emission excited by energetic electrons traveling inside a coronal loop[J]. The Astrophysical Journal, 2021, 909(1): 3 doi: 10.3847/1538-4357/abd8d5 [12] NING H, CHEN Y, NI S L, et al. Harmonic electron-cyclotron maser emissions driven by energetic electrons of the horseshoe distribution with application to solar radio spikes[J]. Astronomy & Astrophysics, 2021, 651: A118 [13] YOUSEFZADEH M, CHEN Y, NING H, et al. Harmonic electron cyclotron maser emission along the coronal loop[J]. The Astrophysical Journal, 2022, 932(1): 35 doi: 10.3847/1538-4357/ac6de3 [14] NING H, CHEN Y, NI S L, et al. Harmonic maser emissions from electrons with loss-cone distribution in solar active regions[J]. The Astrophysical Journal Letters, 2021, 920(2): L40 doi: 10.3847/2041-8213/ac2cc6 [15] BOWERS K J, ALBRIGHT B J, YIN L, et al. Ultrahigh performance three-dimensional electromagnetic relativistic kinetic plasma simulation[J]. Physics of Plasmas, 2008, 15(5): 055703 doi: 10.1063/1.2840133 [16] BOWERS K J, ALBRIGHT B J, YIN L, et al. Advances in petascale kinetic plasma simulation with VPIC and Roadrunner[J]. Journal of Physics: Conference Series, 2009, 180: 012055 doi: 10.1088/1742-6596/180/1/012055 [17] NI S L, CHEN Y, LI C Y, et al. An alternative form of the fundamental plasma emission through the coalescence of Z-mode waves with whistlers[J]. Physics of Plasmas, 2021, 28(4): 040701 doi: 10.1063/5.0045546 [18] MELROSE D B, HEWITT R G, DULK G A. Electron-cyclotron maser emission: relative growth and damping rates for different modes and harmonics[J]. Journal of Geophysical Research: Space Physics, 1984, 89(A2): 897-904 doi: 10.1029/JA089iA02p00897 [19] MELROSE D B. Emission at cyclotron harmonics due to coalescence of Z-mode waves[J]. The Astrophysical Journal, 1991, 380: 256 doi: 10.1086/170582 [20] GURNETT D A. The earth as a radio source: the nonthermal continuum[J]. Journal of Geophysical Research, 1975, 80(19): 2751-2763 doi: 10.1029/JA080i019p02751 [21] YE S Y, MENIETTI J D, FISCHER G, et al. Z mode waves as the source of Saturn narrowband radio emissions[J]. Journal of Geophysical Research: Space Physics, 2010, 115(A8): A08228 -
-

 下载:
下载:

计量
- 文章访问数: 757
- HTML全文浏览量: 490
- PDF下载量: 83
-
被引次数:
0(来源:Crossref)
0(来源:其他)

