


面向小规模面元天体数据集的二阶段边缘检测方法
doi: 10.11728/cjss2025.04.2024-0086 cstr: 32142.14.cjss.2024-0086
-
 郑洋 男, 1996年7月出生于广东省茂名市, 现为广东海洋大学数学与计算机学院助教, 主要研究方向为空间天体测量技术、计算机视觉. E-mail: wlwzy@gdou.edu.cn
 -
 郑中杰 男, 1988年1月出生于广东省茂名市, 现为广东海洋大学数学与计算机学院讲师, 主要研究方向为图像处理、高精度天体测量. E-mail: azhengzj@gdou.edu.cn
作者简介:
通讯作者:
Two-stage Contour Detection Method for Small-scale Disk-resolved Celestial Datasets
-
摘要: 提出了一种面向小规模面元天体数据集的二阶段边缘检测方法. 第一阶段采用基于数字图像处理技术的窗口–边缘检测法进行初步边缘提取. 第二阶段则引入基于ResNet调整后的LPC-ResNet分类器, 用于补充第一阶段中可能遗漏的边缘点. 对新视野号远程勘测成像仪图像中的冥王星和冥卫一的边缘检测实验结果表明, 窗口–边缘检测法在精确率方面表现最佳, 即其去除非边缘点的能力最强, 但召回率较低. 通过引入LPC-ResNet, 召回率与F1分数均有提升, 从而增强了对边缘点的保留能力, 使提取的边缘更完整. 此外, 基于提取的边缘对冥王星和冥卫一进行的中心测量应用实验显示, 二阶段方法相较于单一的窗口–边缘检测法具有更高的检测精度, 证实了LPC-ResNet可有效改善窗口–边缘检测法的边缘提取结果.
-
关键词:
- 边缘检测 /
- ResNet /
- 新视野号远程勘测成像仪 /
- 面元天体
Abstract: In the astrometry of the disk resolved objects, contour detection acts as an important step, and it is equivalent to a binary classification process of classifying pixel points as contour points and non-contour points. For the purpose of automated extraction of hierarchical contour features, enhancement of contour detection precision, and accommodation of either limited-scale disk-resolved celestial datasets or preliminary-phase observational campaigns, a two-stage contour detection method for small-scale disk-resolved celestial datasets is proposed in this paper. In the first stage, a window contour detection method utilizing digital image processing techniques and comprising three operational steps: window extraction, window searching, and elliptical fitting, is employed to perform initial contour extraction. The second stage introduces an LPC-ResNet classifier, an adapted version of ResNet architecture, to supplement potential contour points missed by the window-contour detection method in the first stage. Experimental validation using New Horizons’ Long-Range Reconnaissance Imager (LORRI) images of Pluto and its biggest satellite Charon demonstrates that the window-based method achieves optimal Precision, indicating its superior capability in filtering non-contour pixels, yet exhibits limited Recall, likely due to unintended exclusion of contour points during elliptical fitting in the window-contour detection method. After incorporating the LPC-ResNet classifier, both Recall and F1 score are improved, enhancing the ability to retain contour points and resulting in more complete contour extraction. To further validate the role of LPC-ResNet classifier in refining detection outcomes, centroid measurement experiment of Pluto and Charon is conducted using the contours extracted by the two-stage detection method and the single window-contour detection method, using the ephemerides Plu060 as the reference. The results of the experiment demonstrate that the two-stage method reduces mean and standard deviation of the Observed-minus-Calculated (O-C) residuals in both x and y directions, which means that the two-stage method has higher detection precision compared to the single window-contour detection method, confirming that LPC-ResNet classifier can improve the contour extraction effect of the window-contour detection method. -

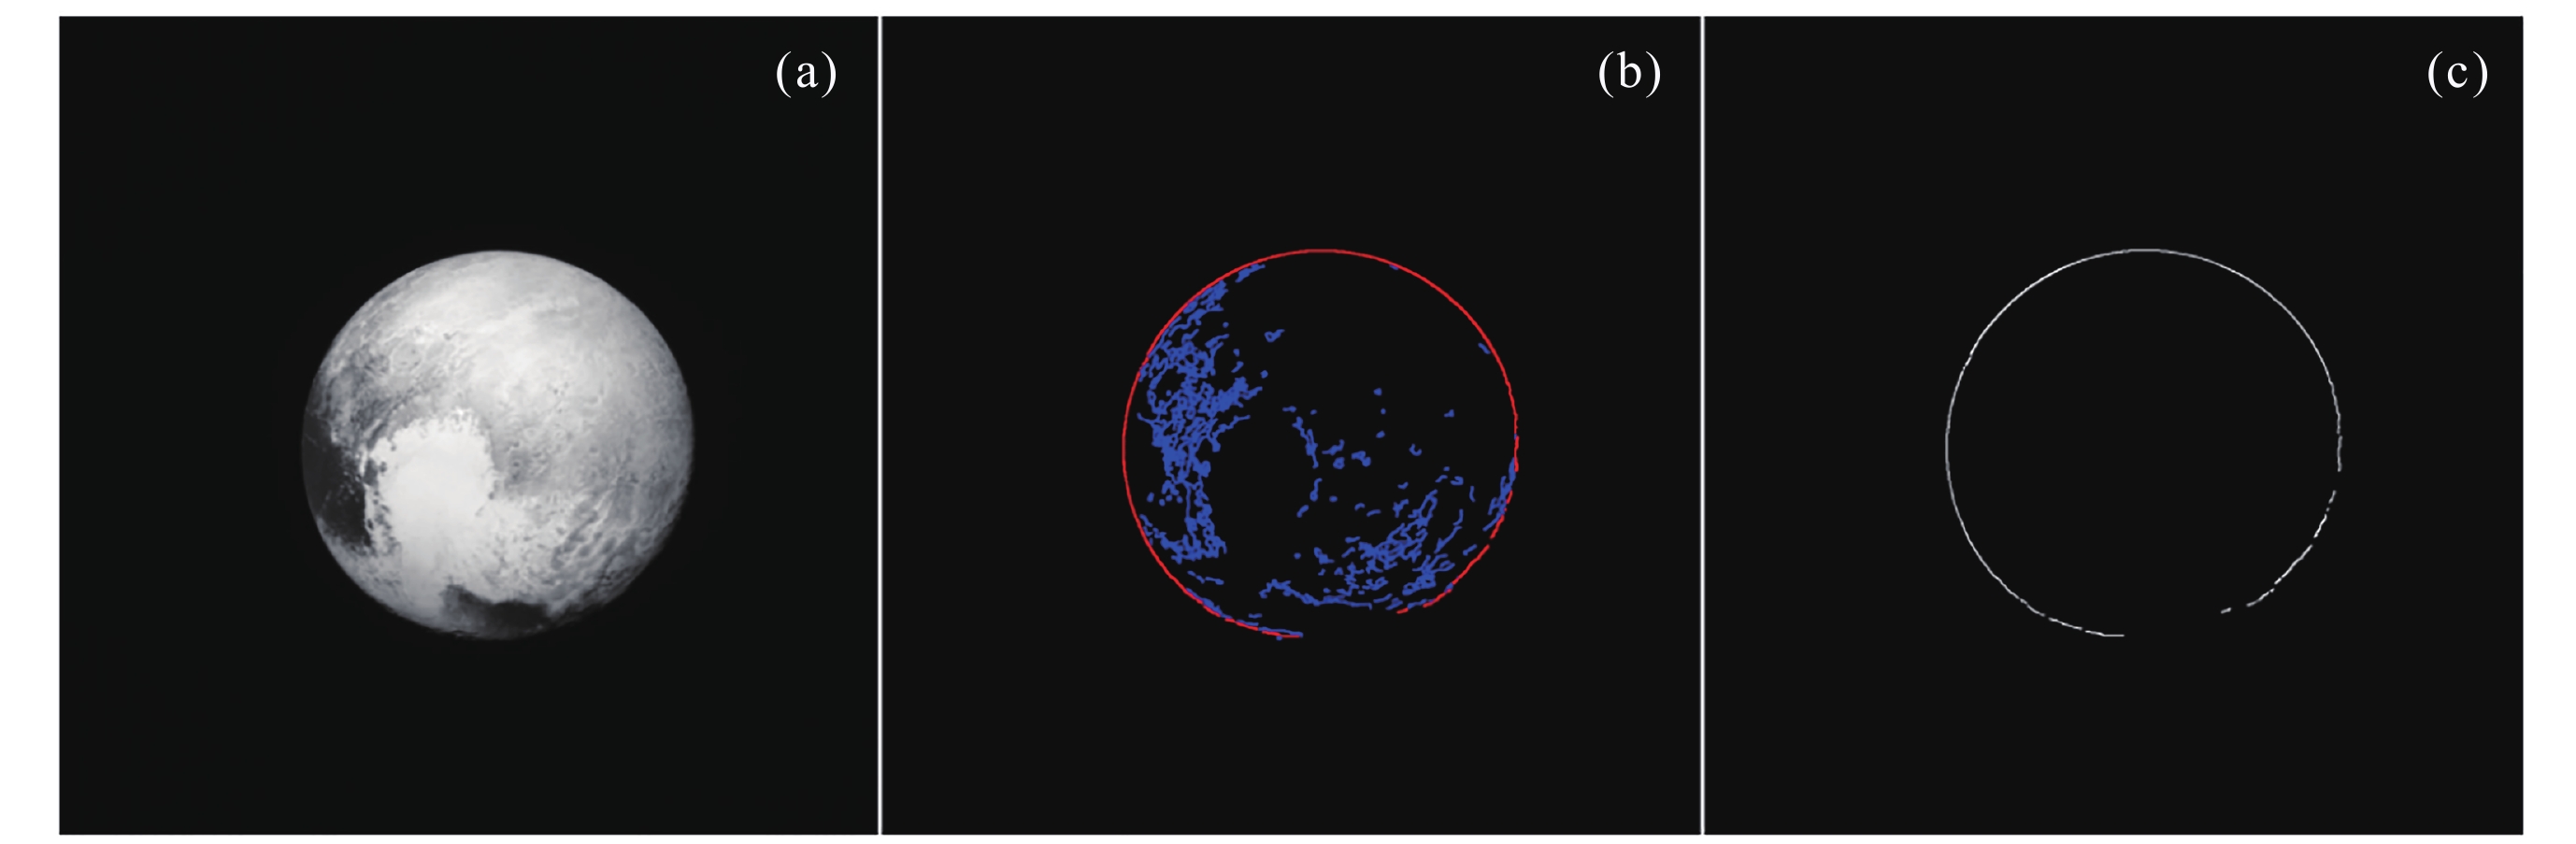
图 1 数据集图像. (a) 原图像; (b) Canny算子滤波图, 红色标记像素点为边缘点,蓝色标记像素点为非边缘点; (c) 真实边缘图
Figure 1. Dataset frame examples. (a) Original frame. (b) Canny operator filtered frame. The red marked pixels are contour points, and the blue marked pixels are non-contour points. (c) True contour frame
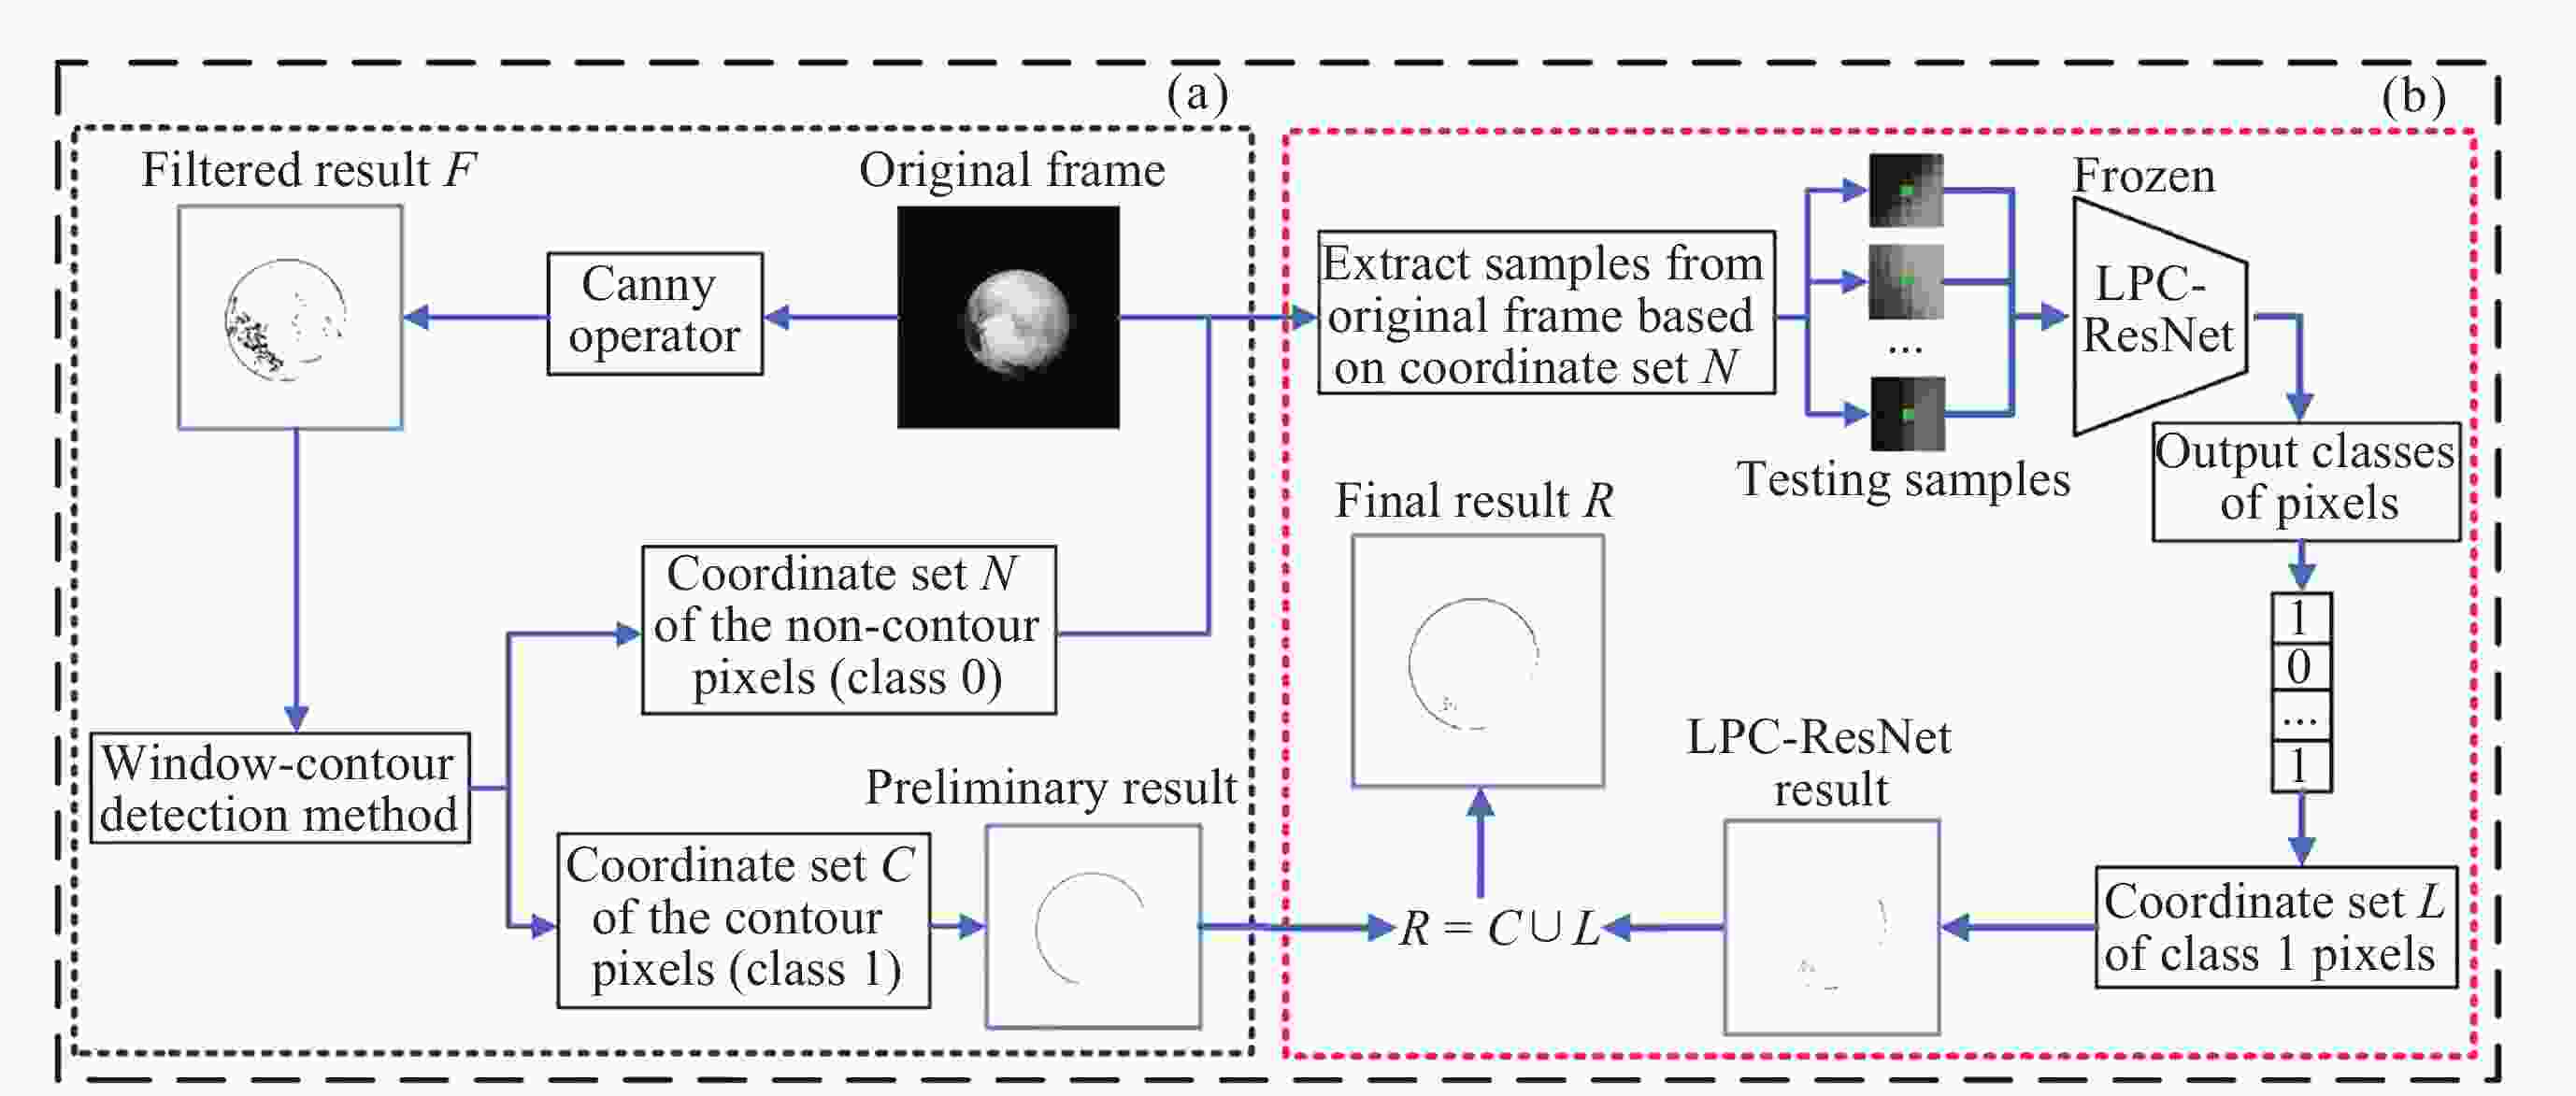
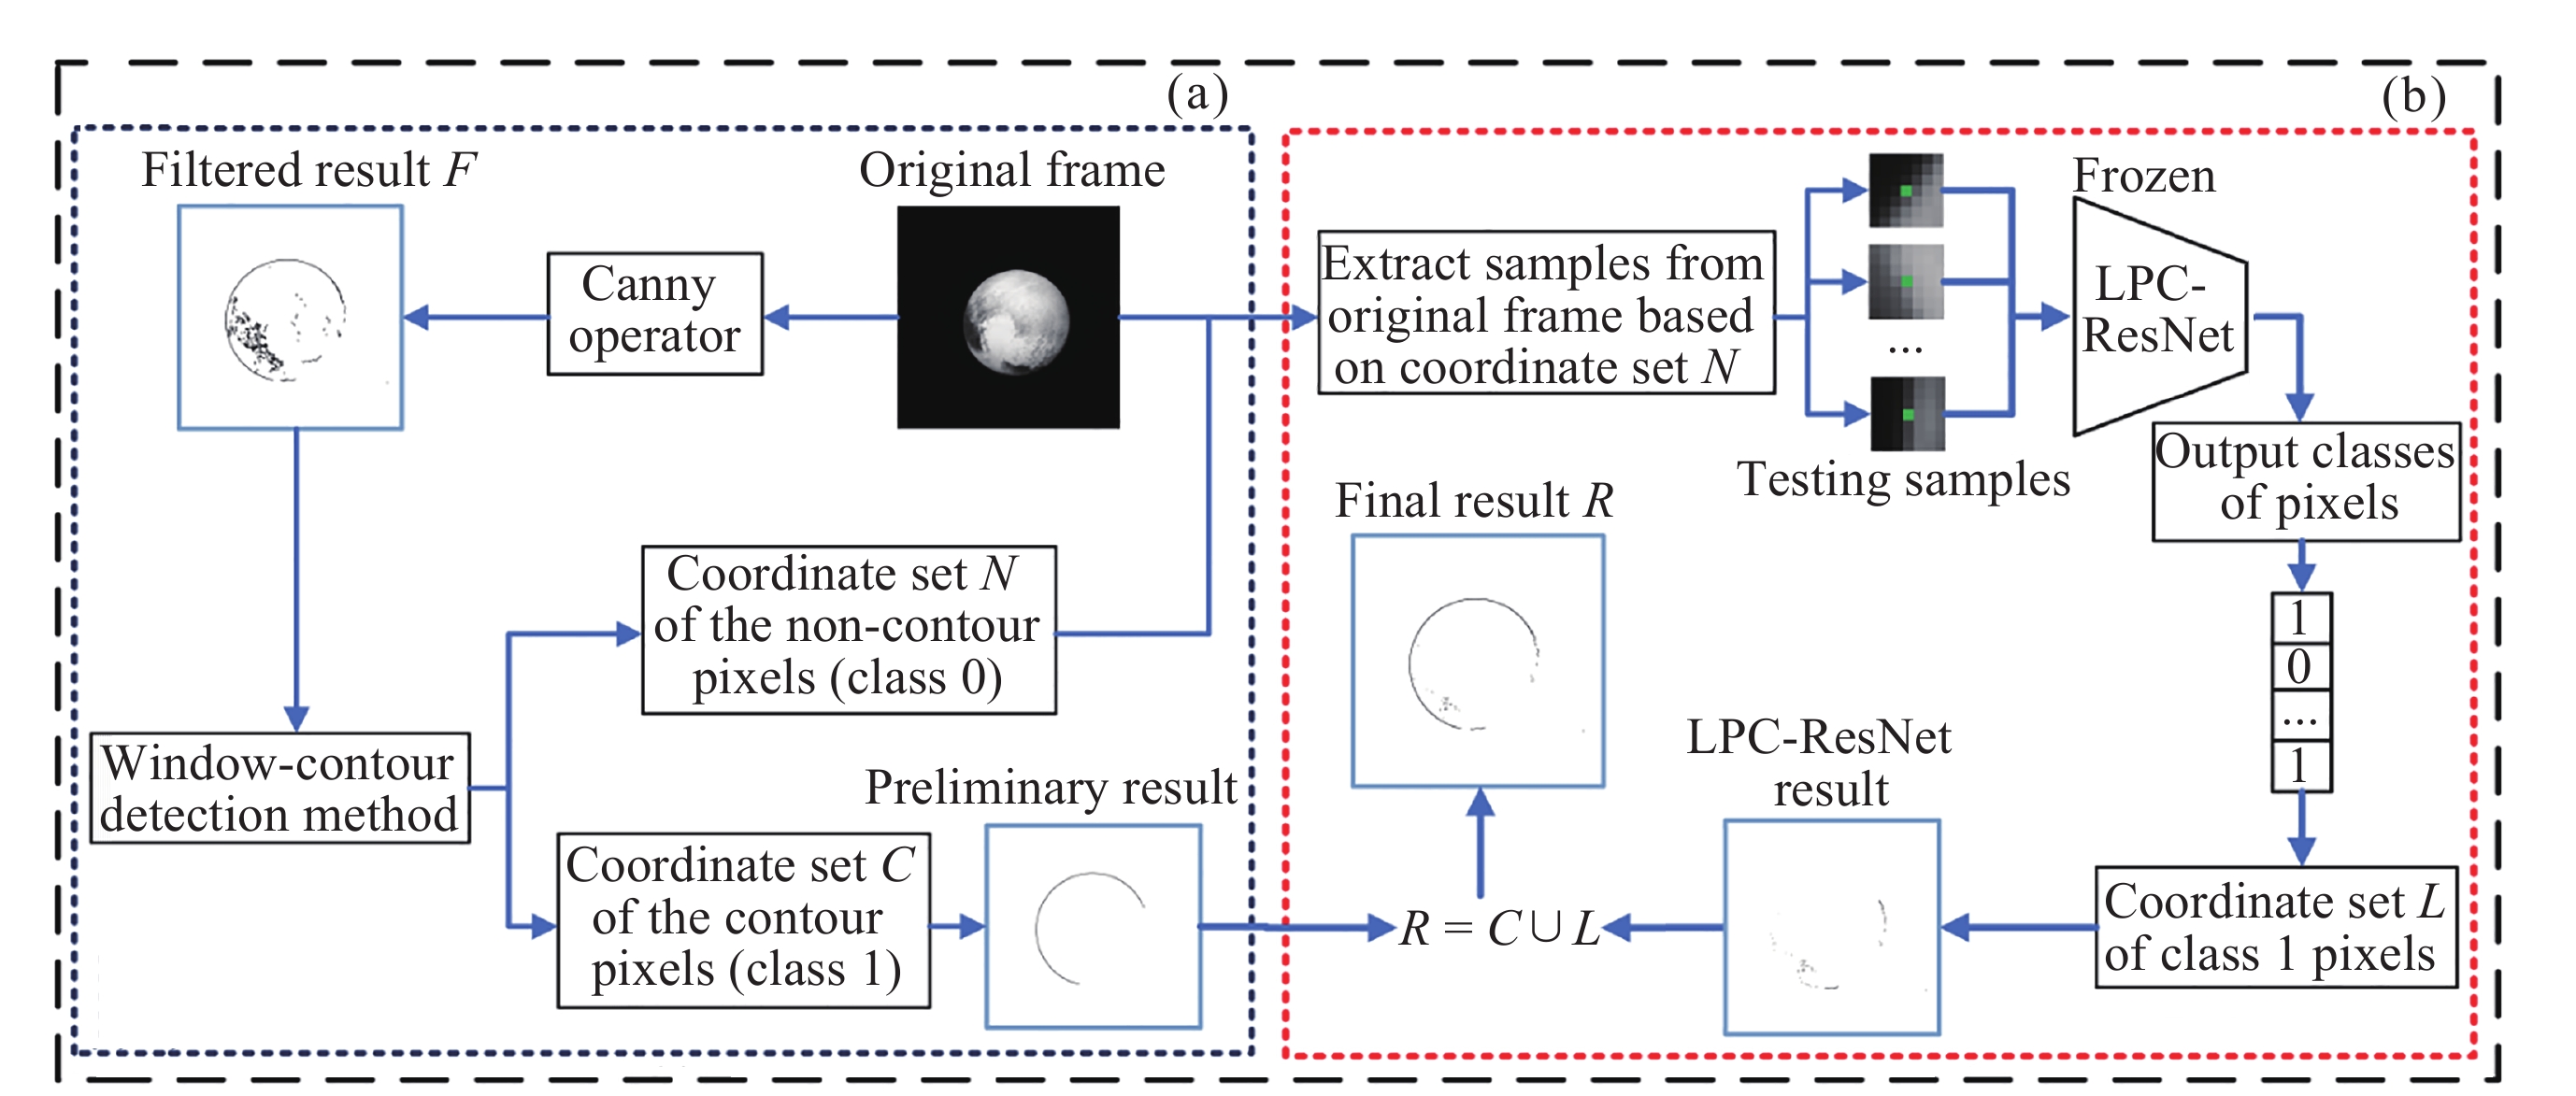
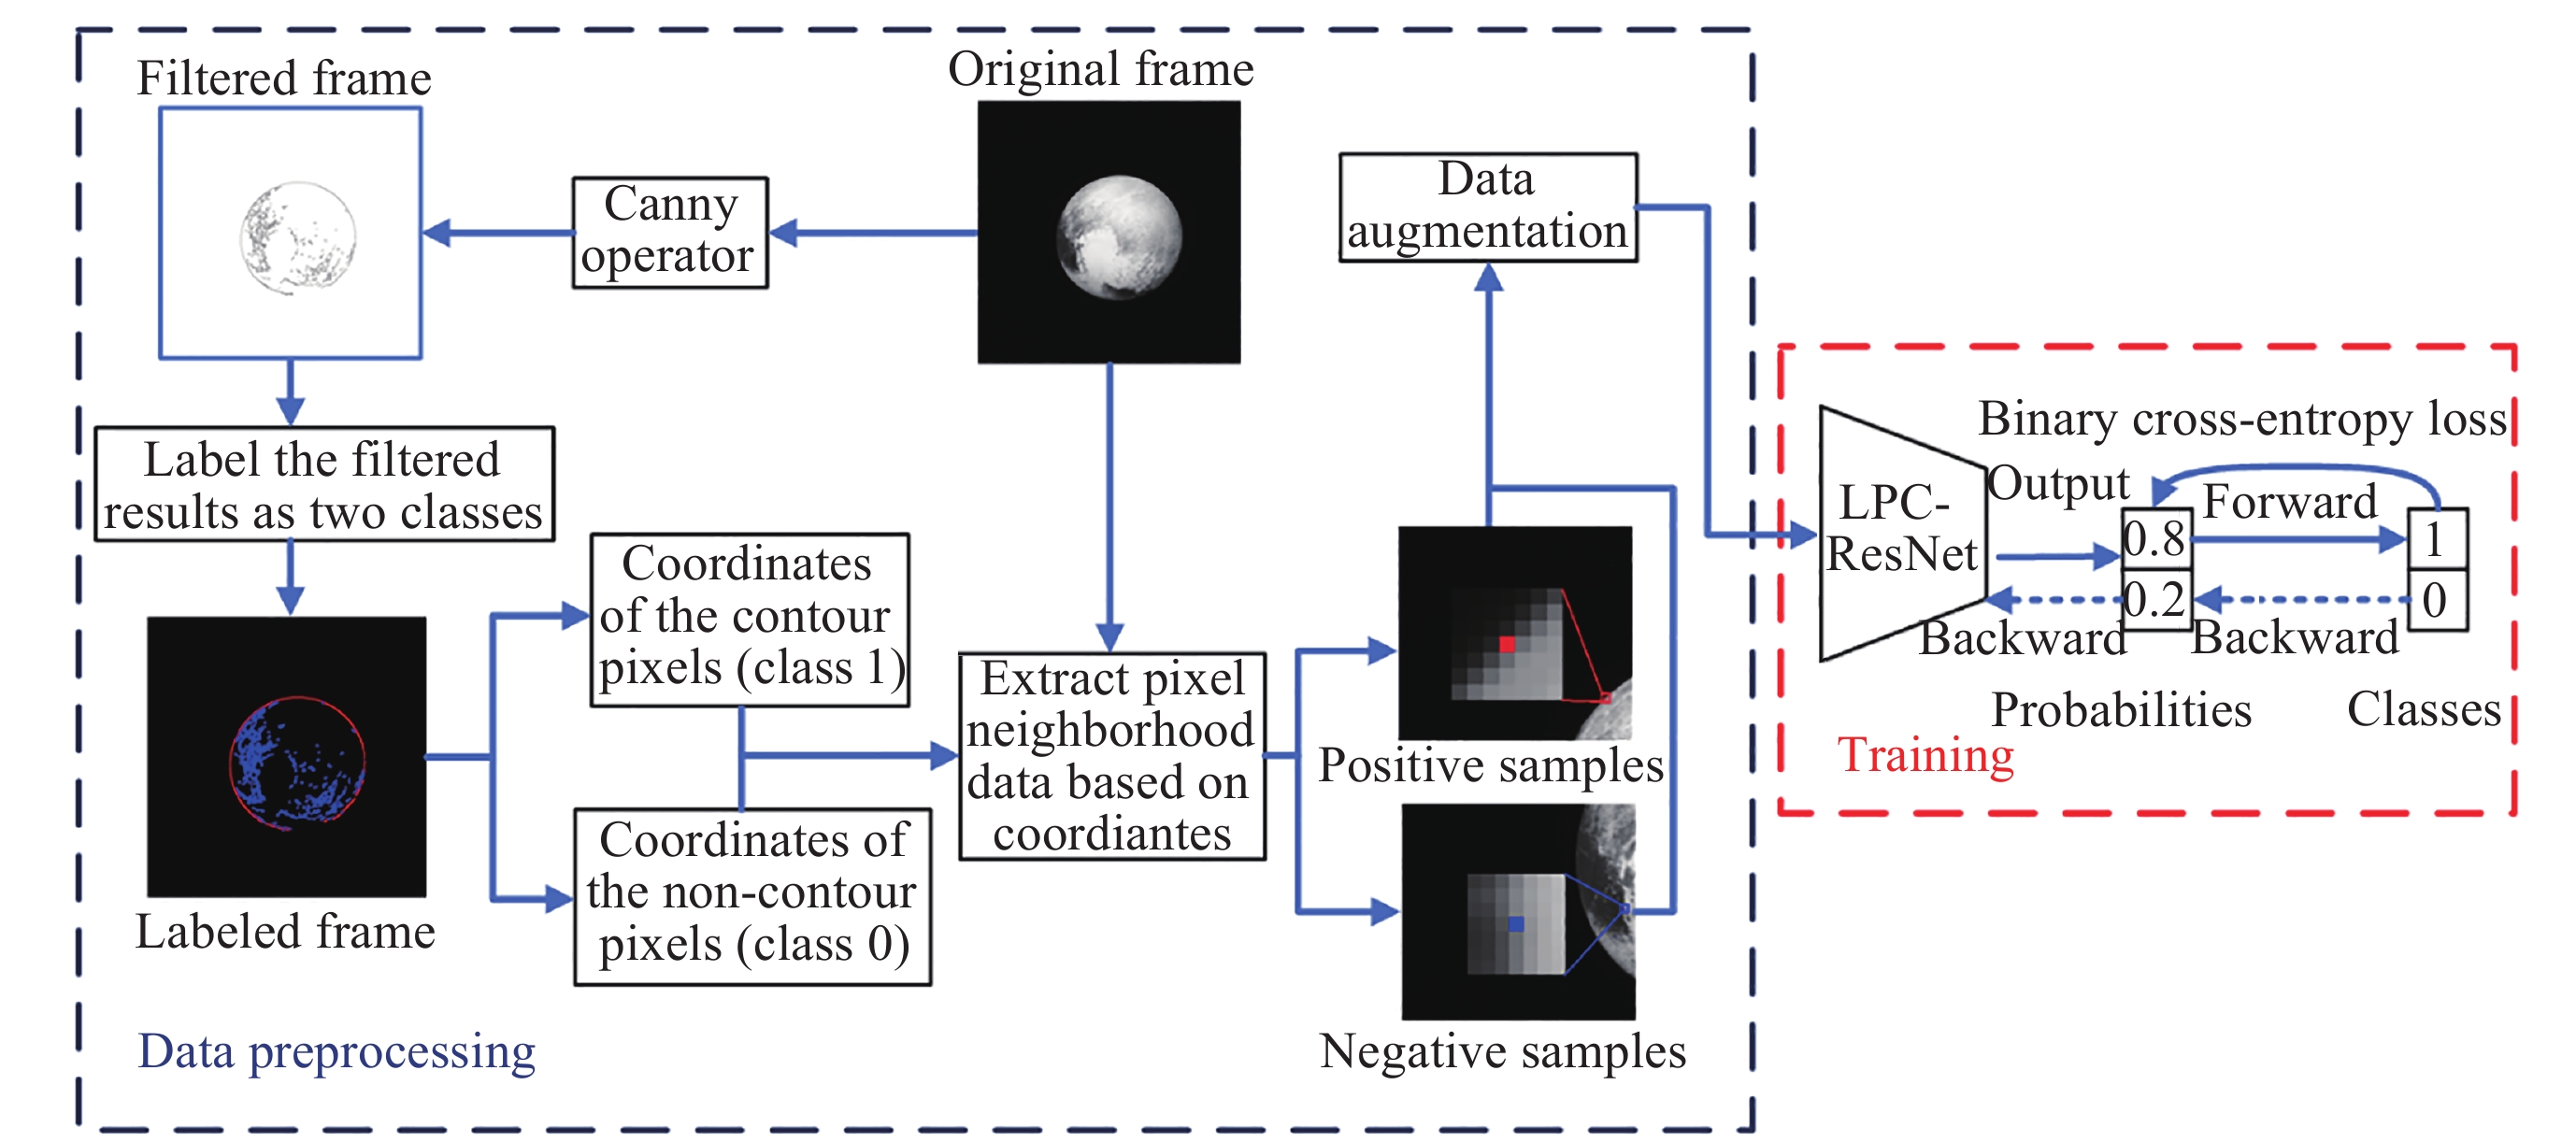
图 2 面向小规模天体面元数据集的二阶段边缘提取方法的流程. (a) 第一阶段, 通过执行窗口–边缘检测法获得初步的边缘. (b) 第二阶段, 使用LPC-ResNet分类器补充第一阶段遗漏的边缘点
Figure 2. Process flowchart for a two-stage contour detection method for small-scale disk resolved celestial datasets. (a) The first stage, where preliminary contours are obtained by performing the window-contour detection method. (b) The second stage, where the LPC-ResNet classifier is used to supplement the contour points missed by the first stage
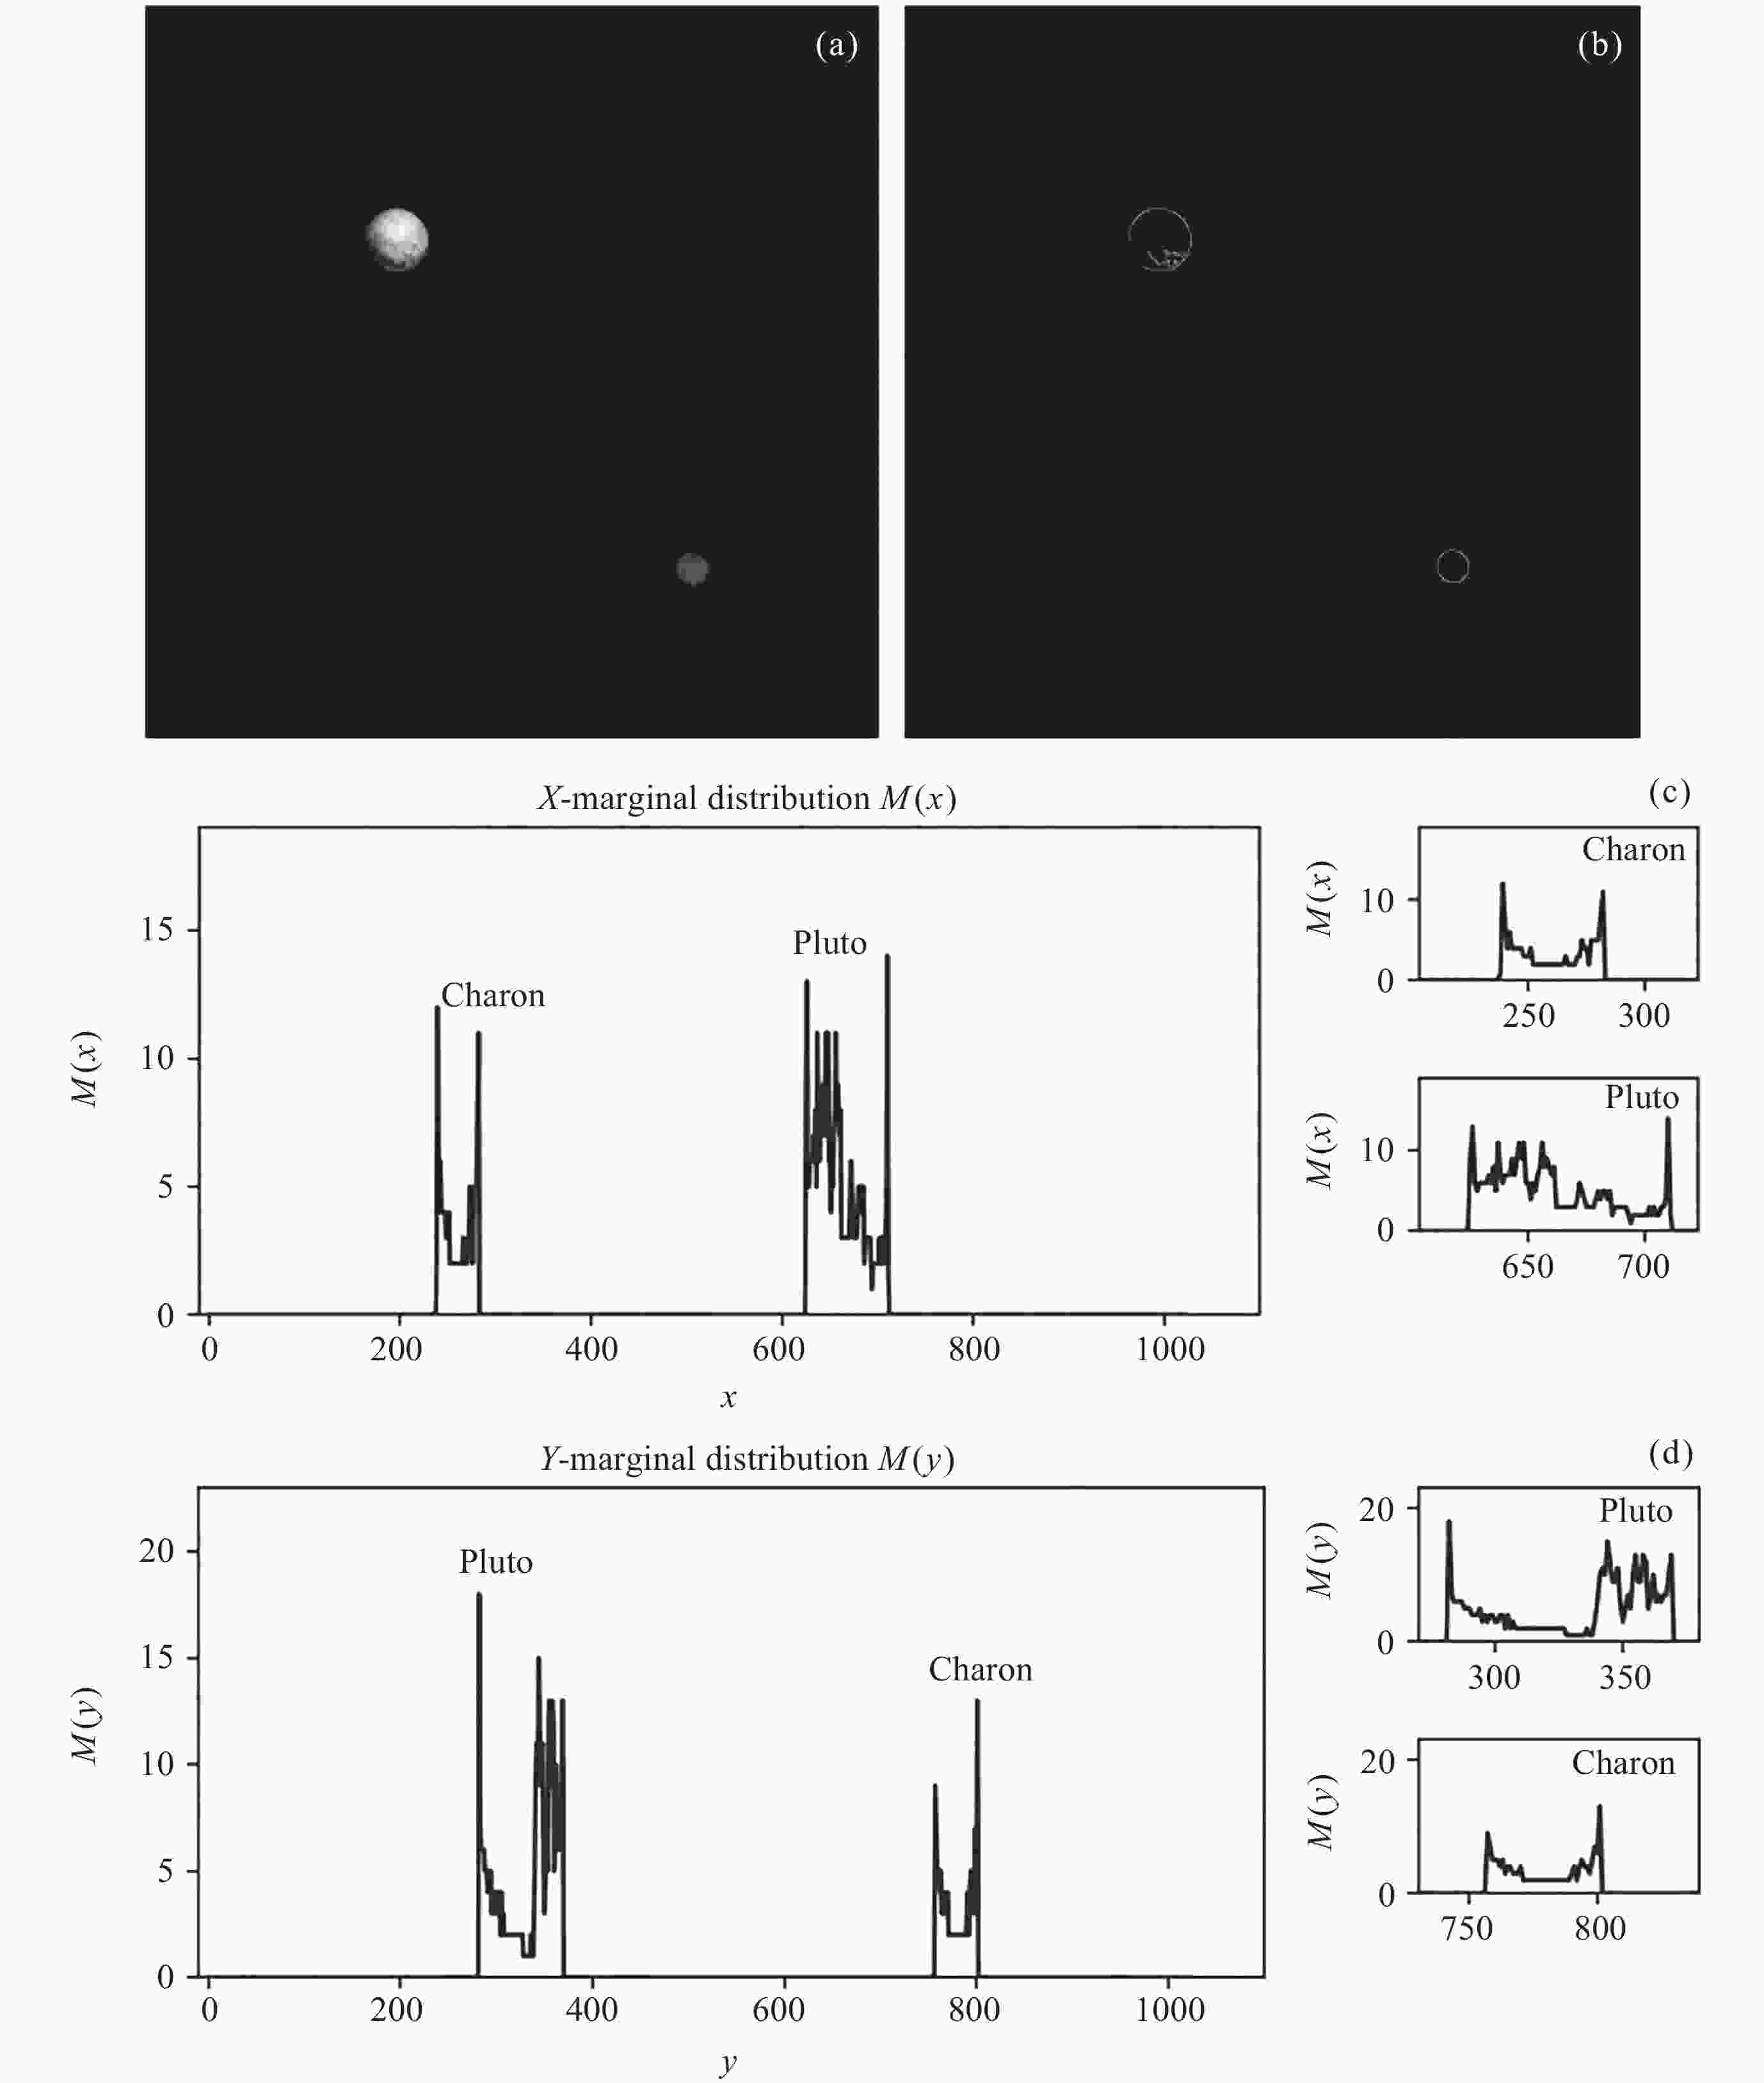
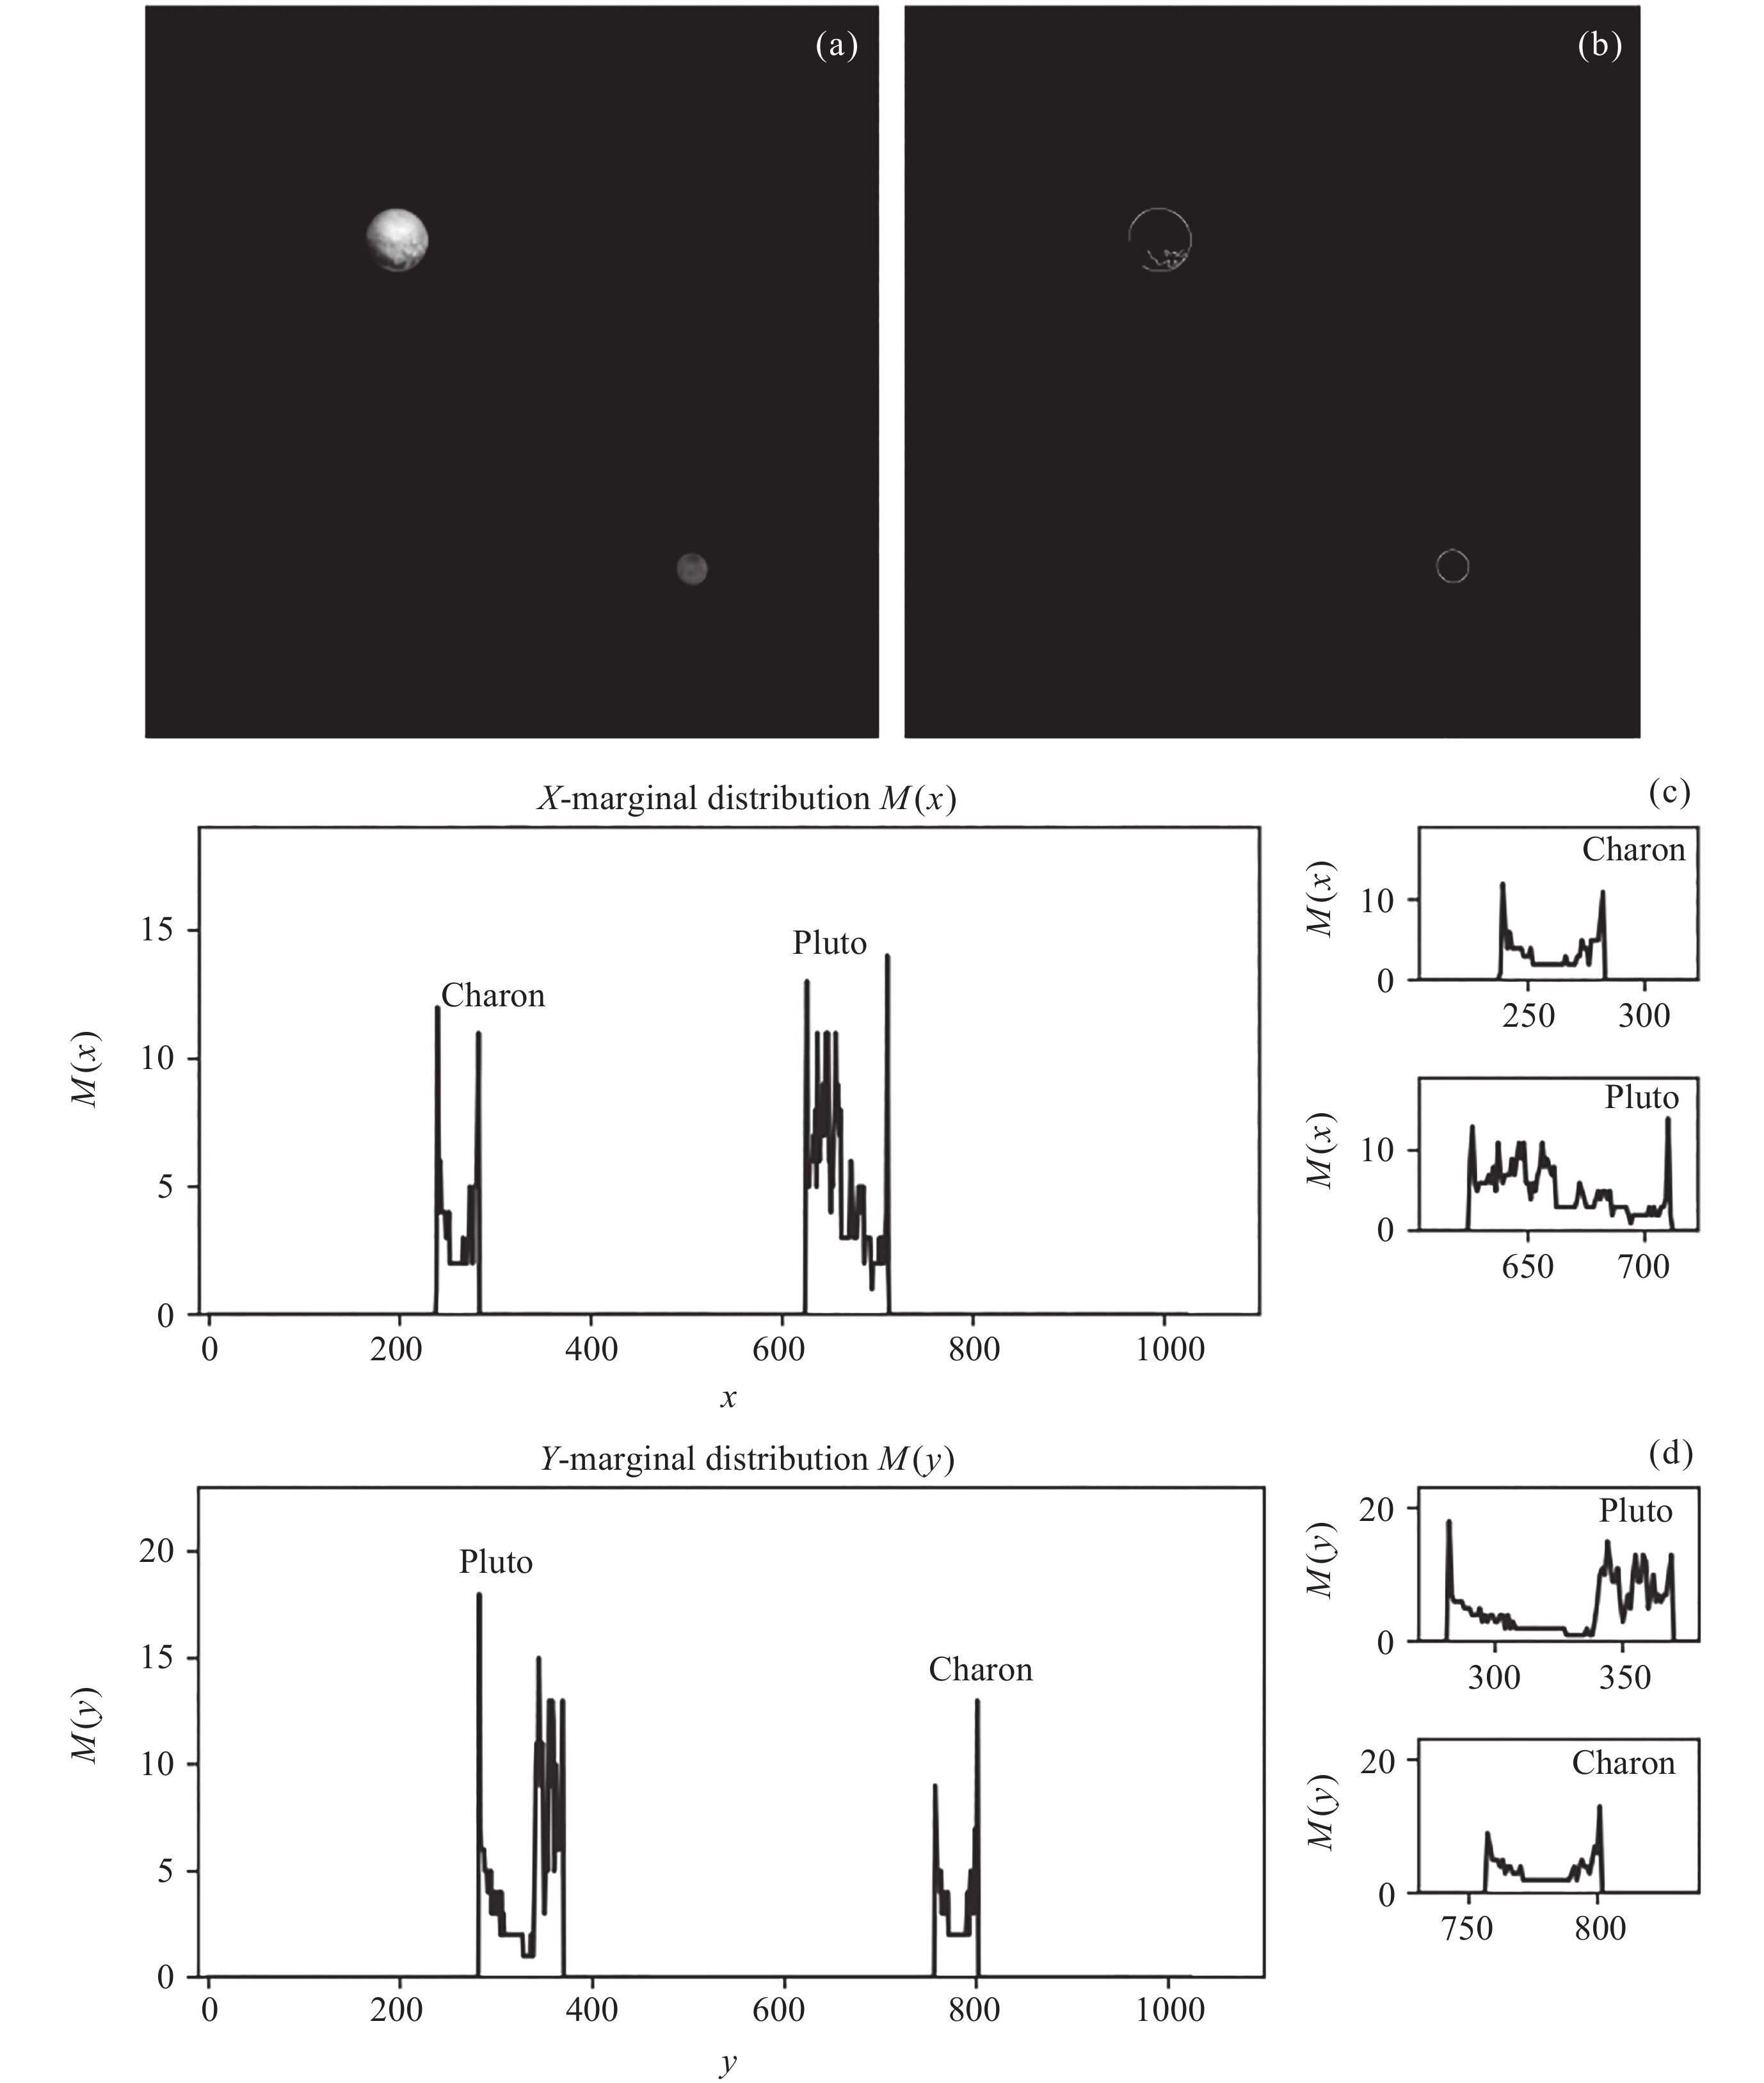
图 3 窗口提取的例子. (a) 原图像, (b) 滤波图像, (c) X-边缘分布$ M \left(x\right) $结果, (d) Y-边缘分布$ M \left(y\right) $结果
Figure 3. Example of window extraction. (a) The original frame, (b) the filtered frame, (c) the X-marginal distribution result $ M \left(x\right) $, (d) the Y-marginal distribution result $ M \left(y\right) $
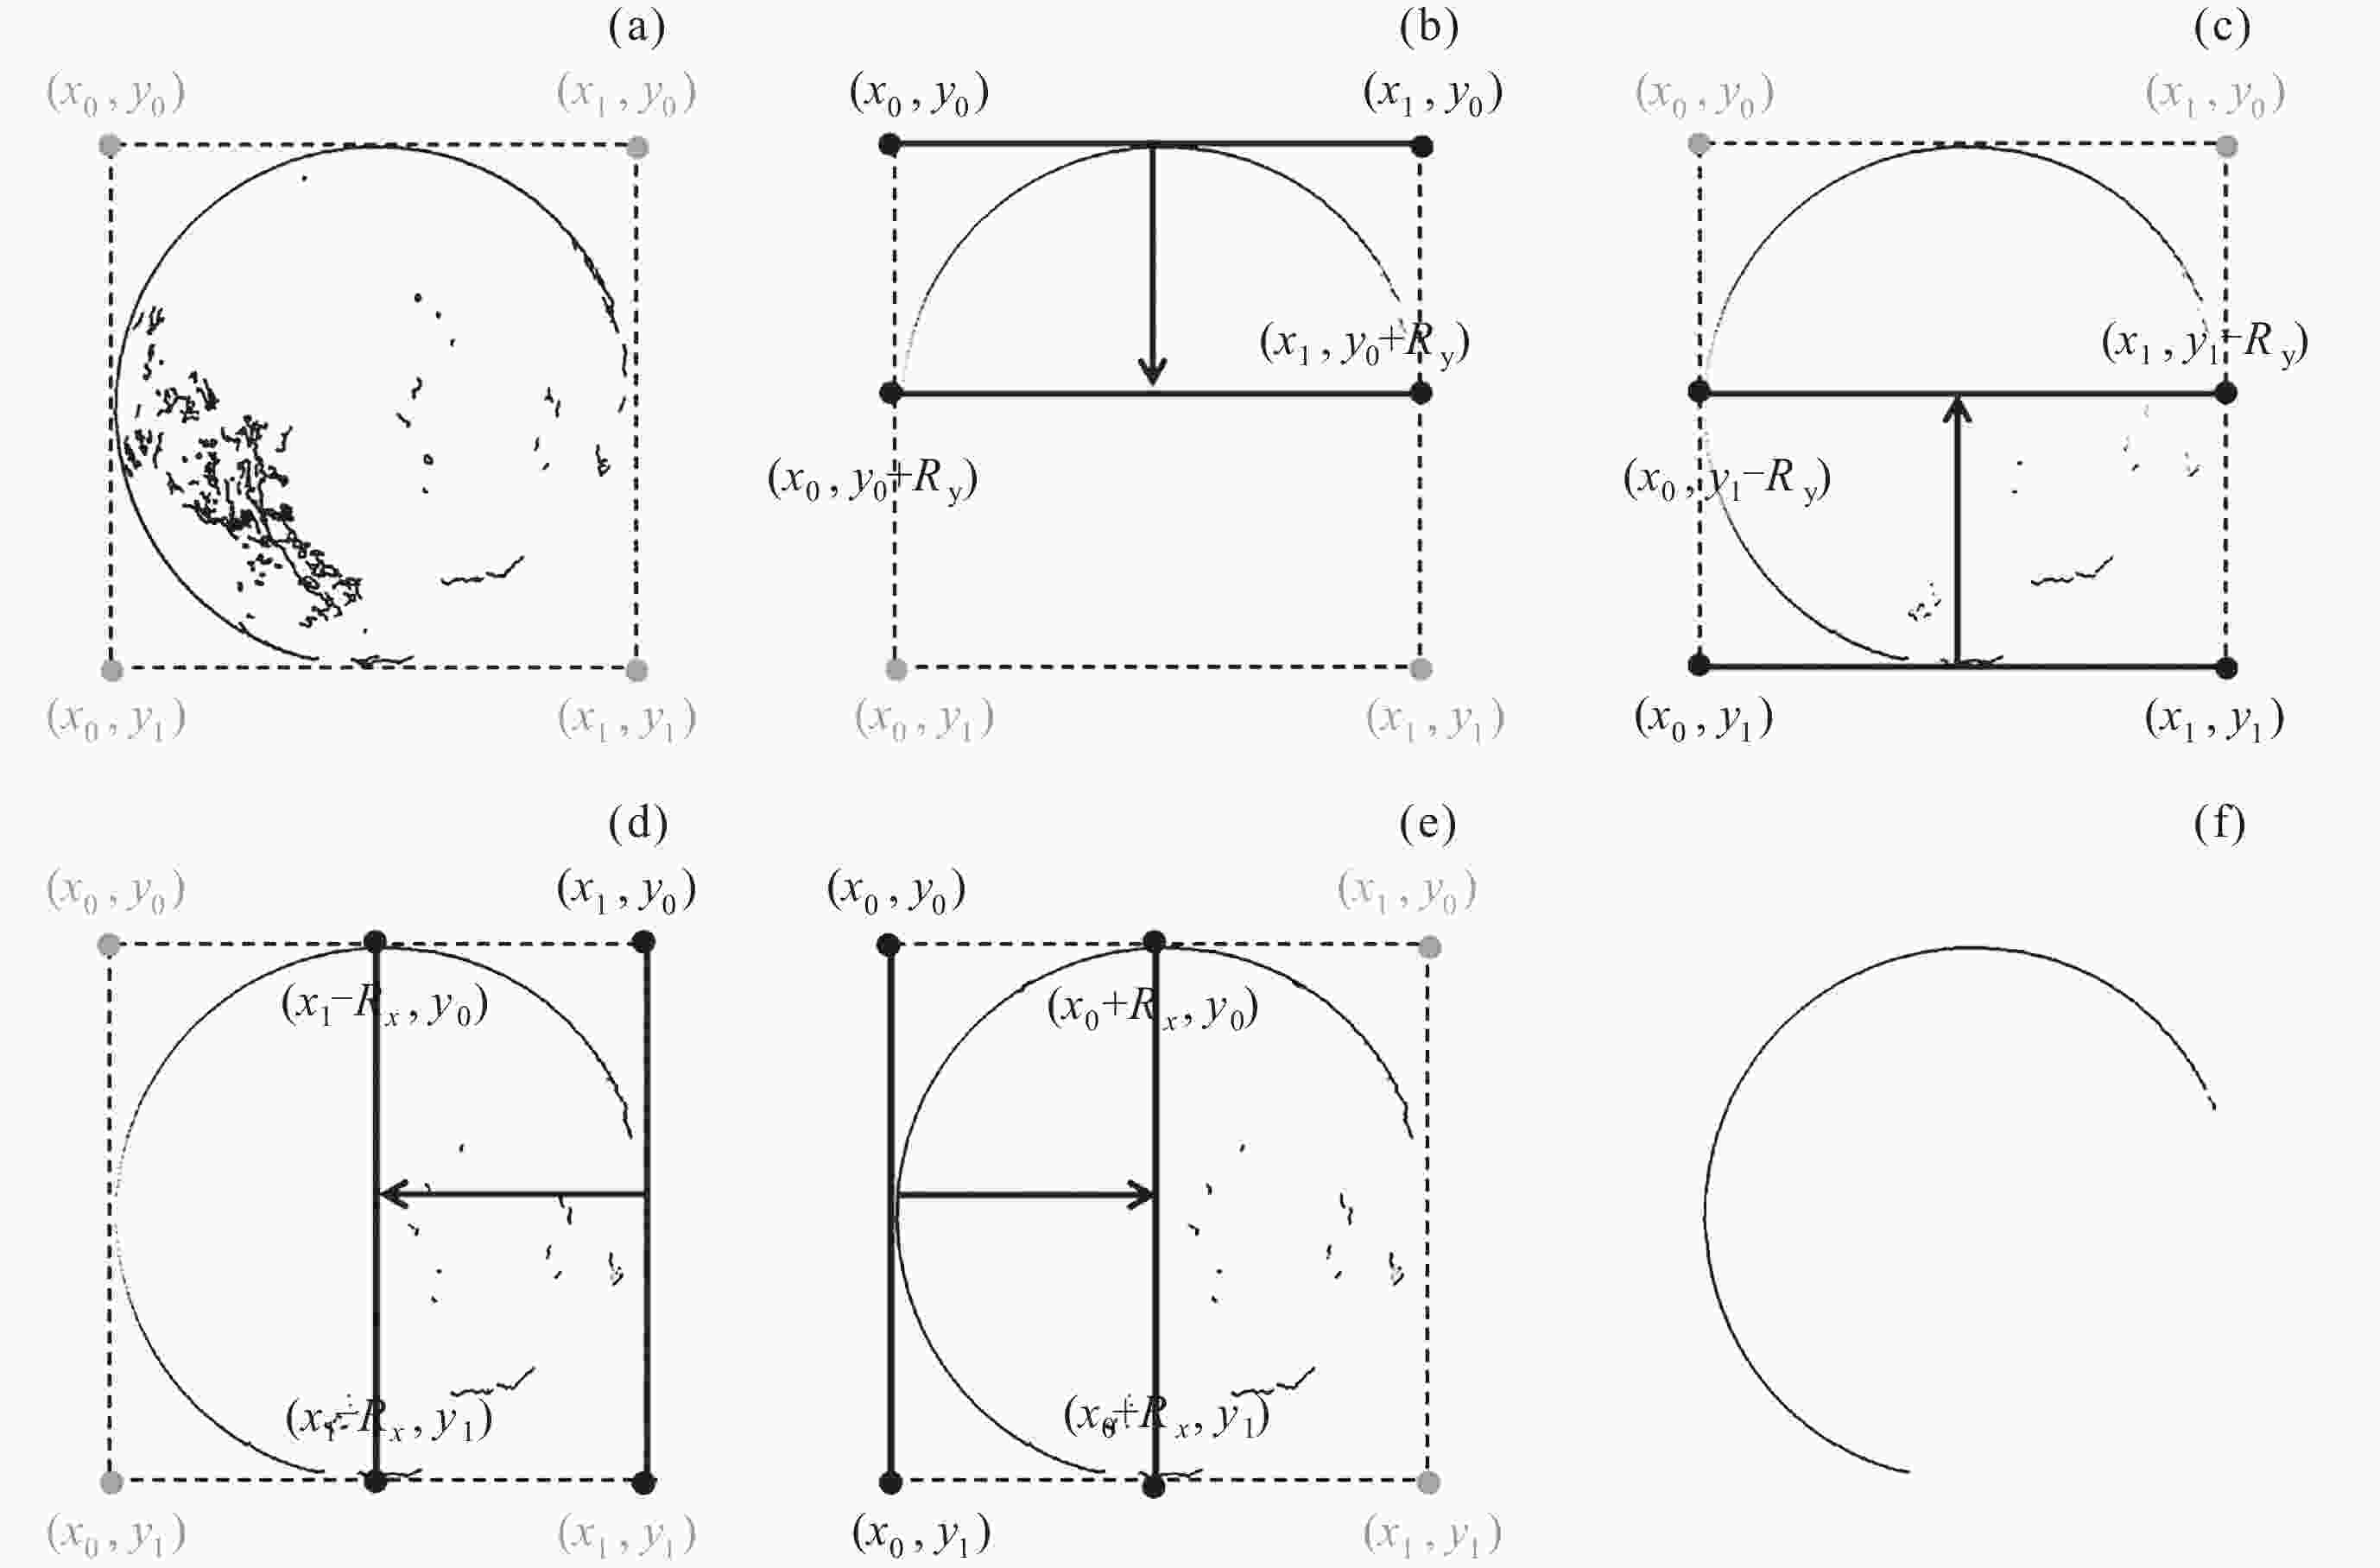
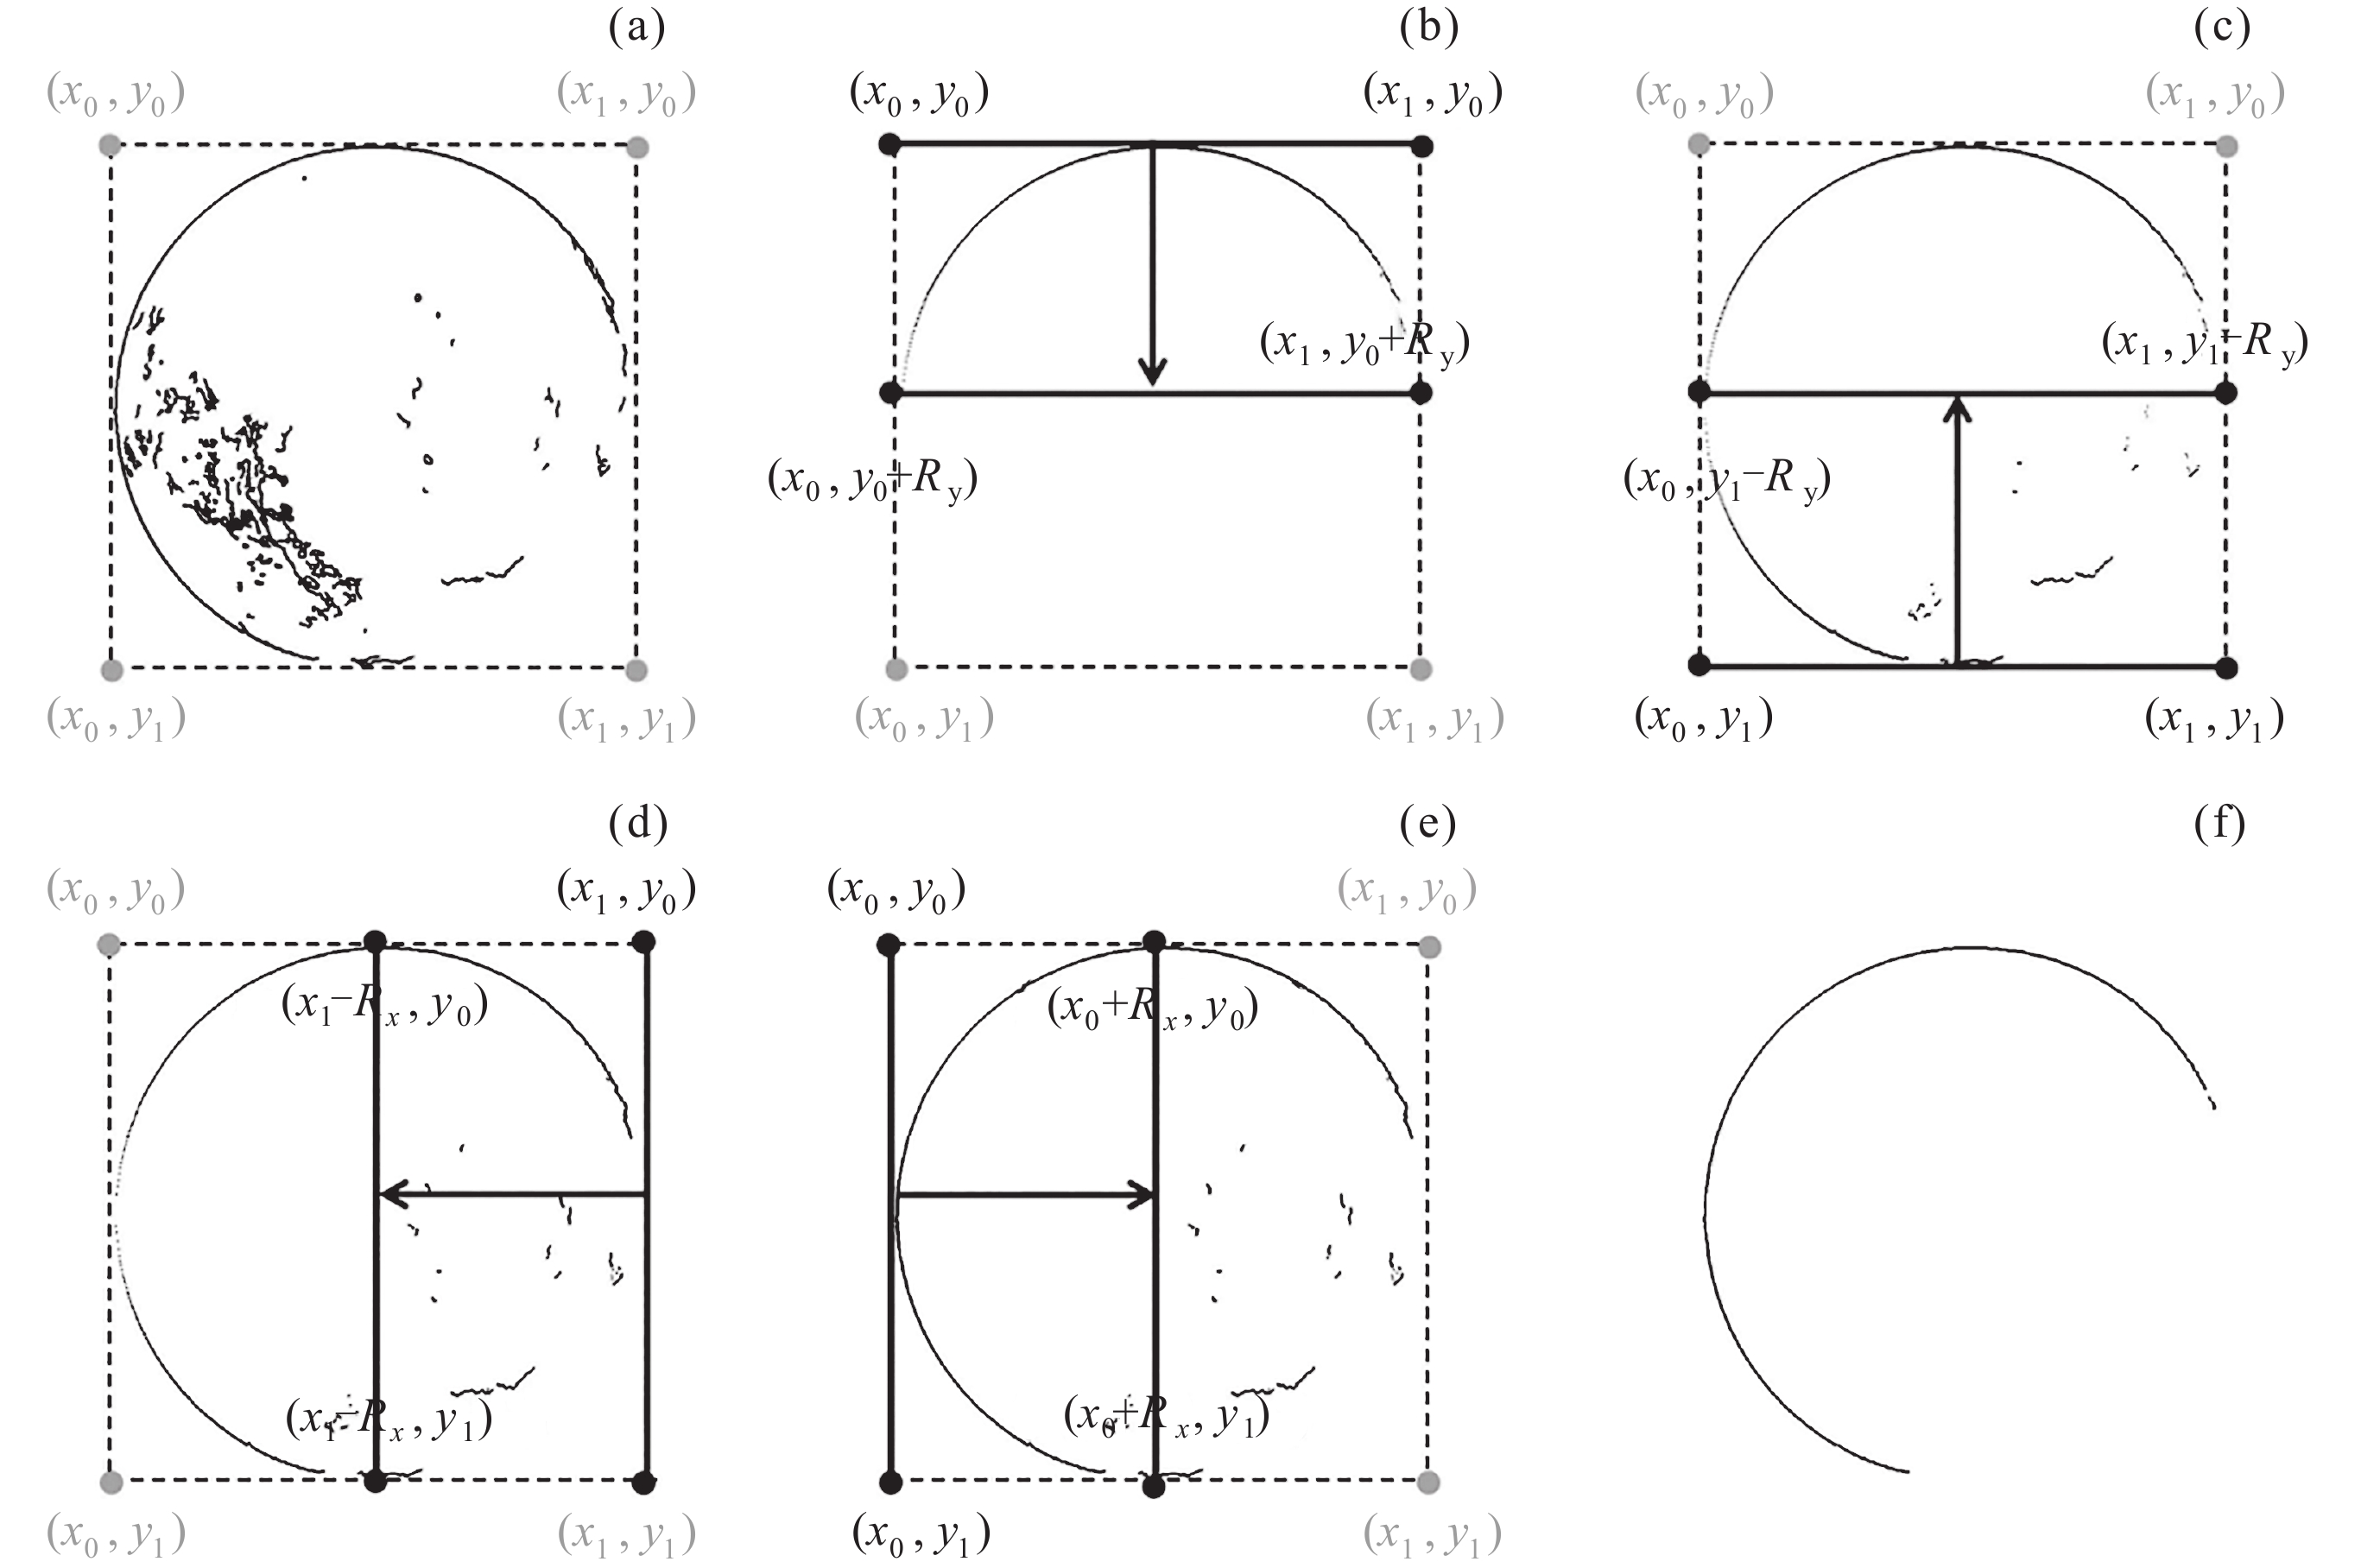
图 4 窗口–边缘检测法的结果. (a) 滤波图像的窗口. (b) Y方向扫描(升序). (c) Y方向扫描(降序).(d) X方向扫描(降序). (e) X方向扫描(升序). (f) 椭圆拟合后的结果
Figure 4. Results of the window-contour detection method. (a) Window of the filtered frame. (b) Scanning in Y direction (ascending order). (c) Scanning in Y direction (descending order). (d) Scanning in X direction (descending order). (e) Scanning in X direction (ascending order). (f) Results after ellipse fitting
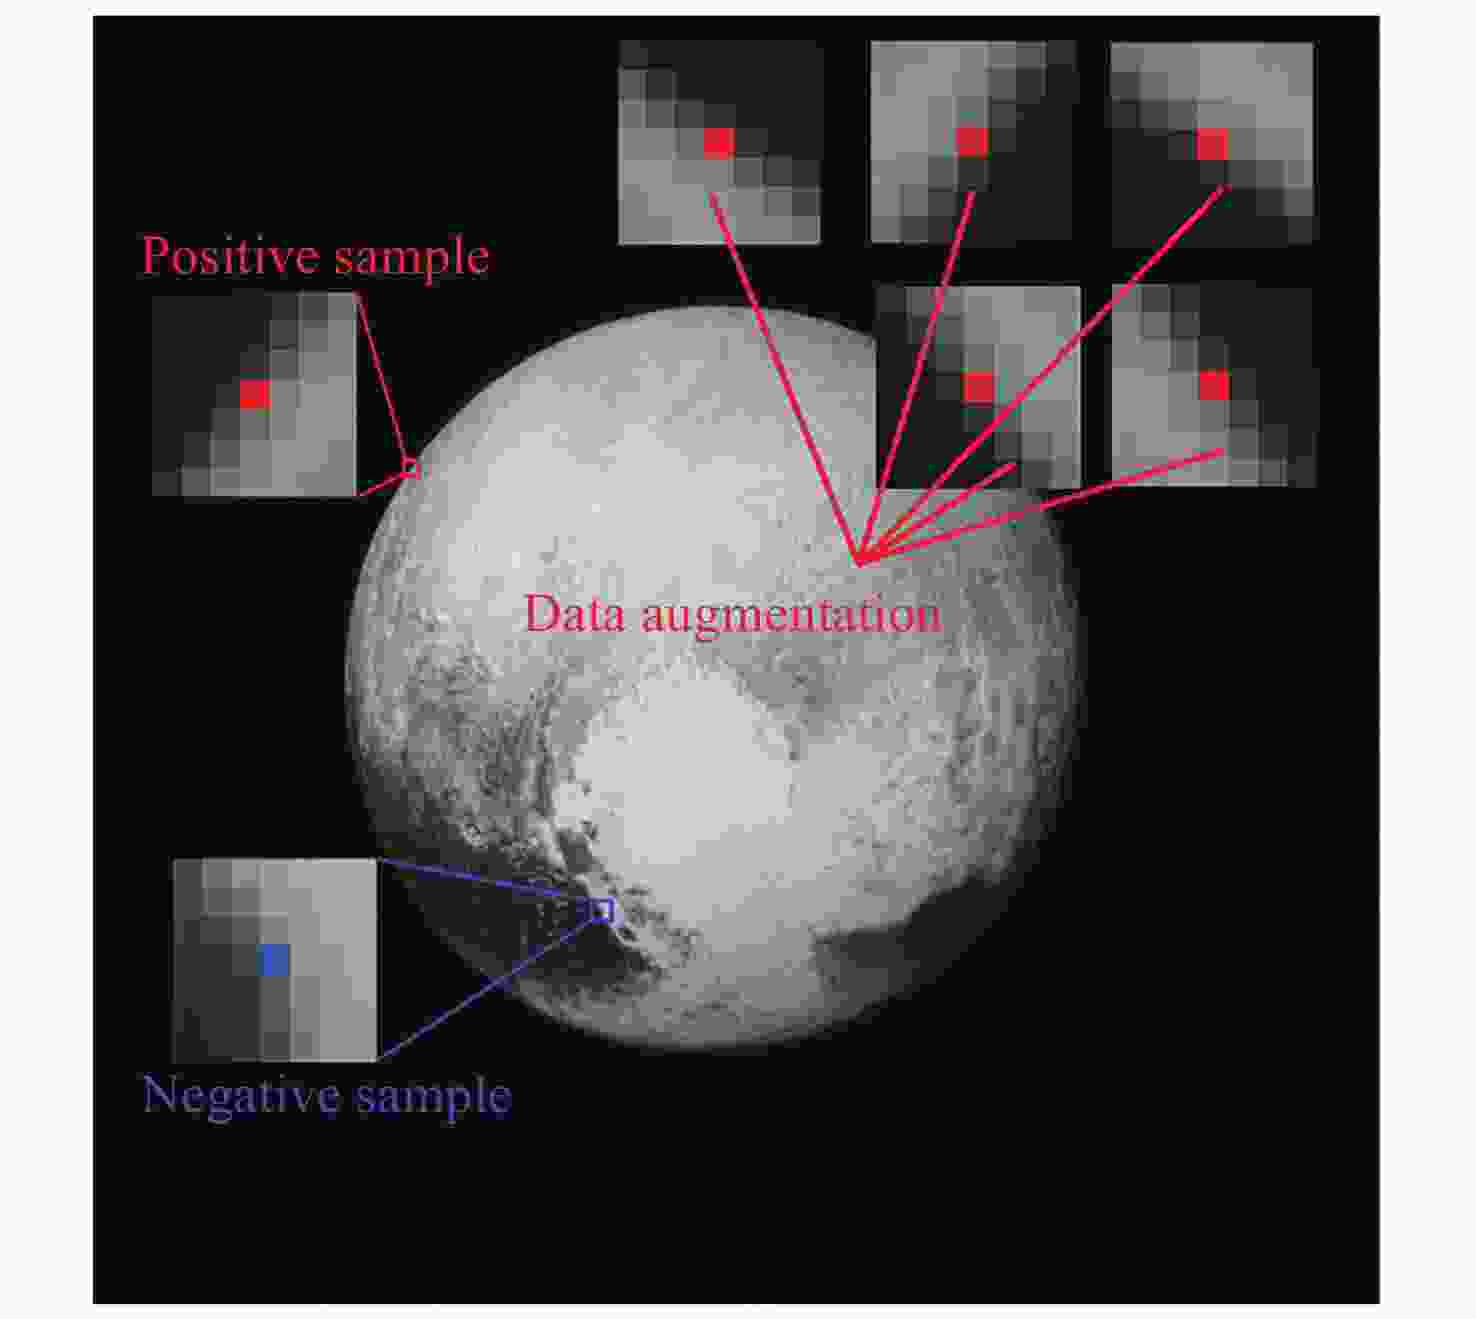
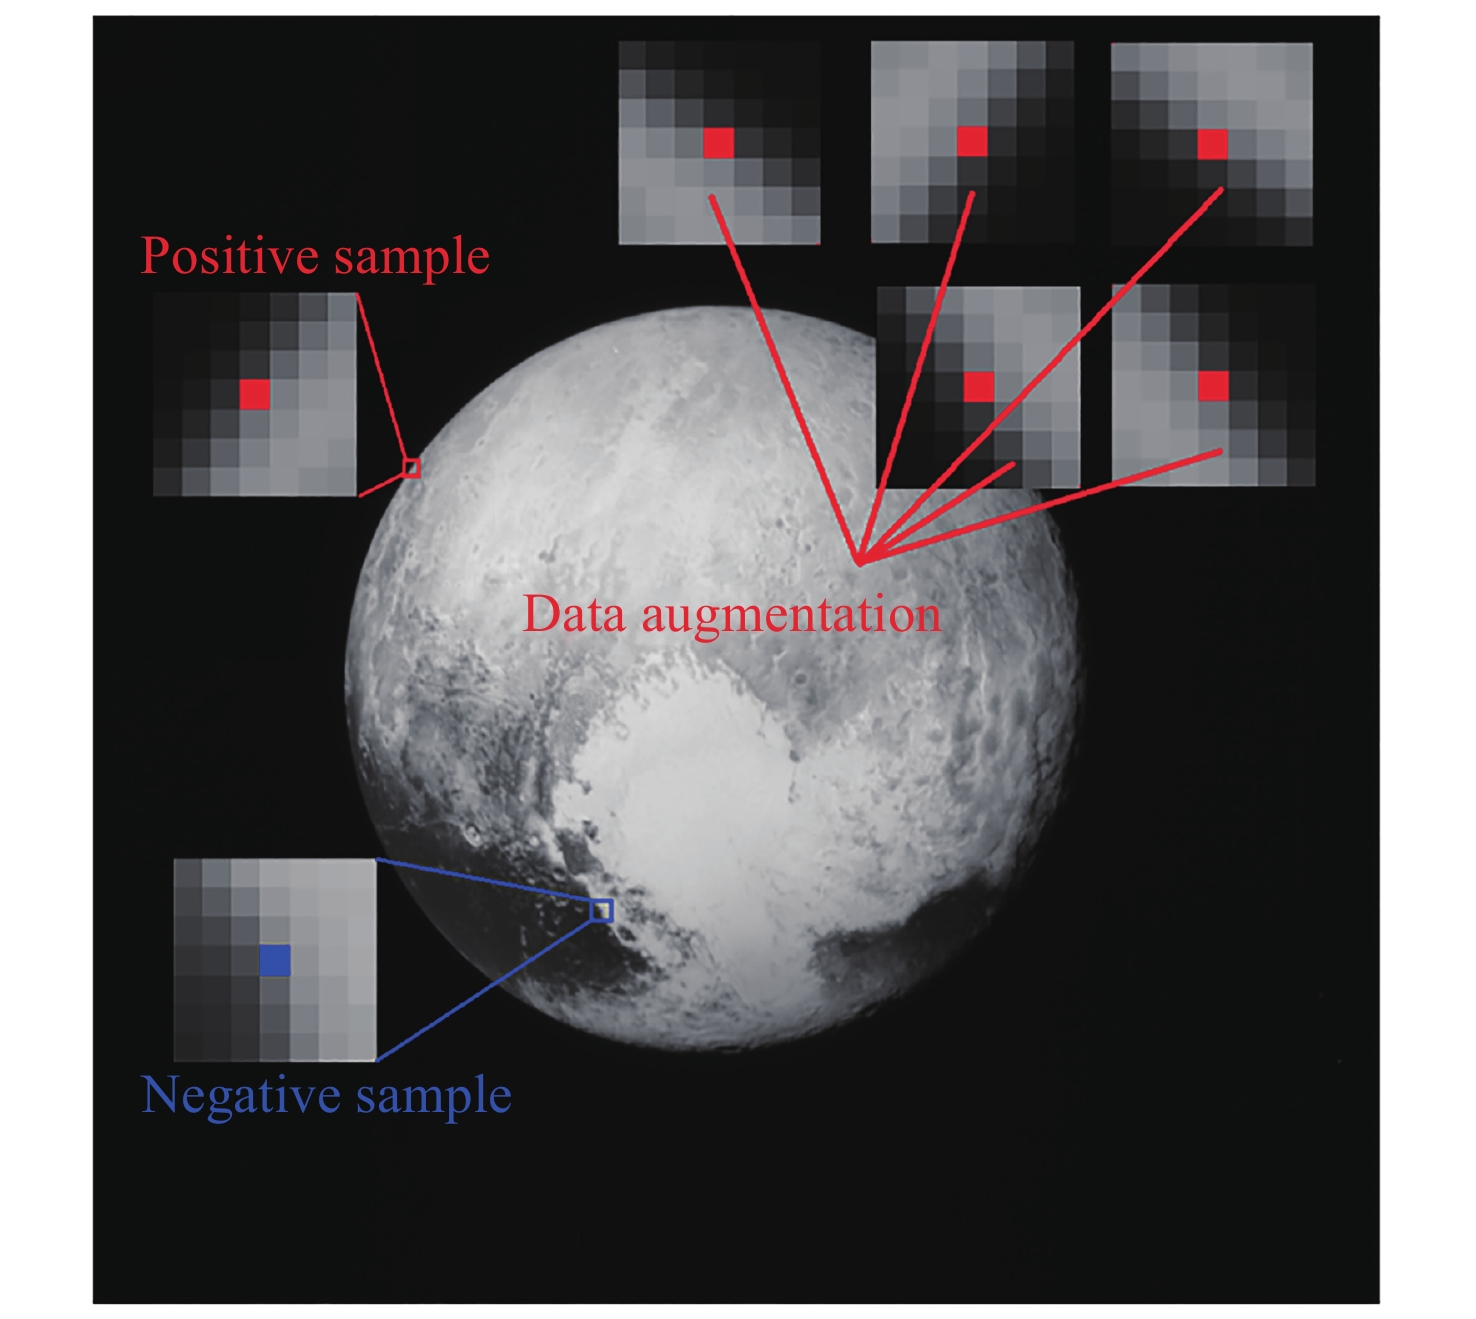
图 5 像素邻域数据的训练样本采集结果, 以7×7大小邻域为例. 右上5幅子图为像素邻域数据经过数据增强后的结果, 包括90°, 180°, 270°旋转以及水平与垂直翻转
Figure 5. Results of training sample collection for pixel neighborhood data, taking a 7×7 neighborhood size as an example. The five subplots in the upper right corner represent the results of data augmentation on pixel neighborhood data, including 90°, 180°, and 270° rotations, as well as horizontal and vertical flips
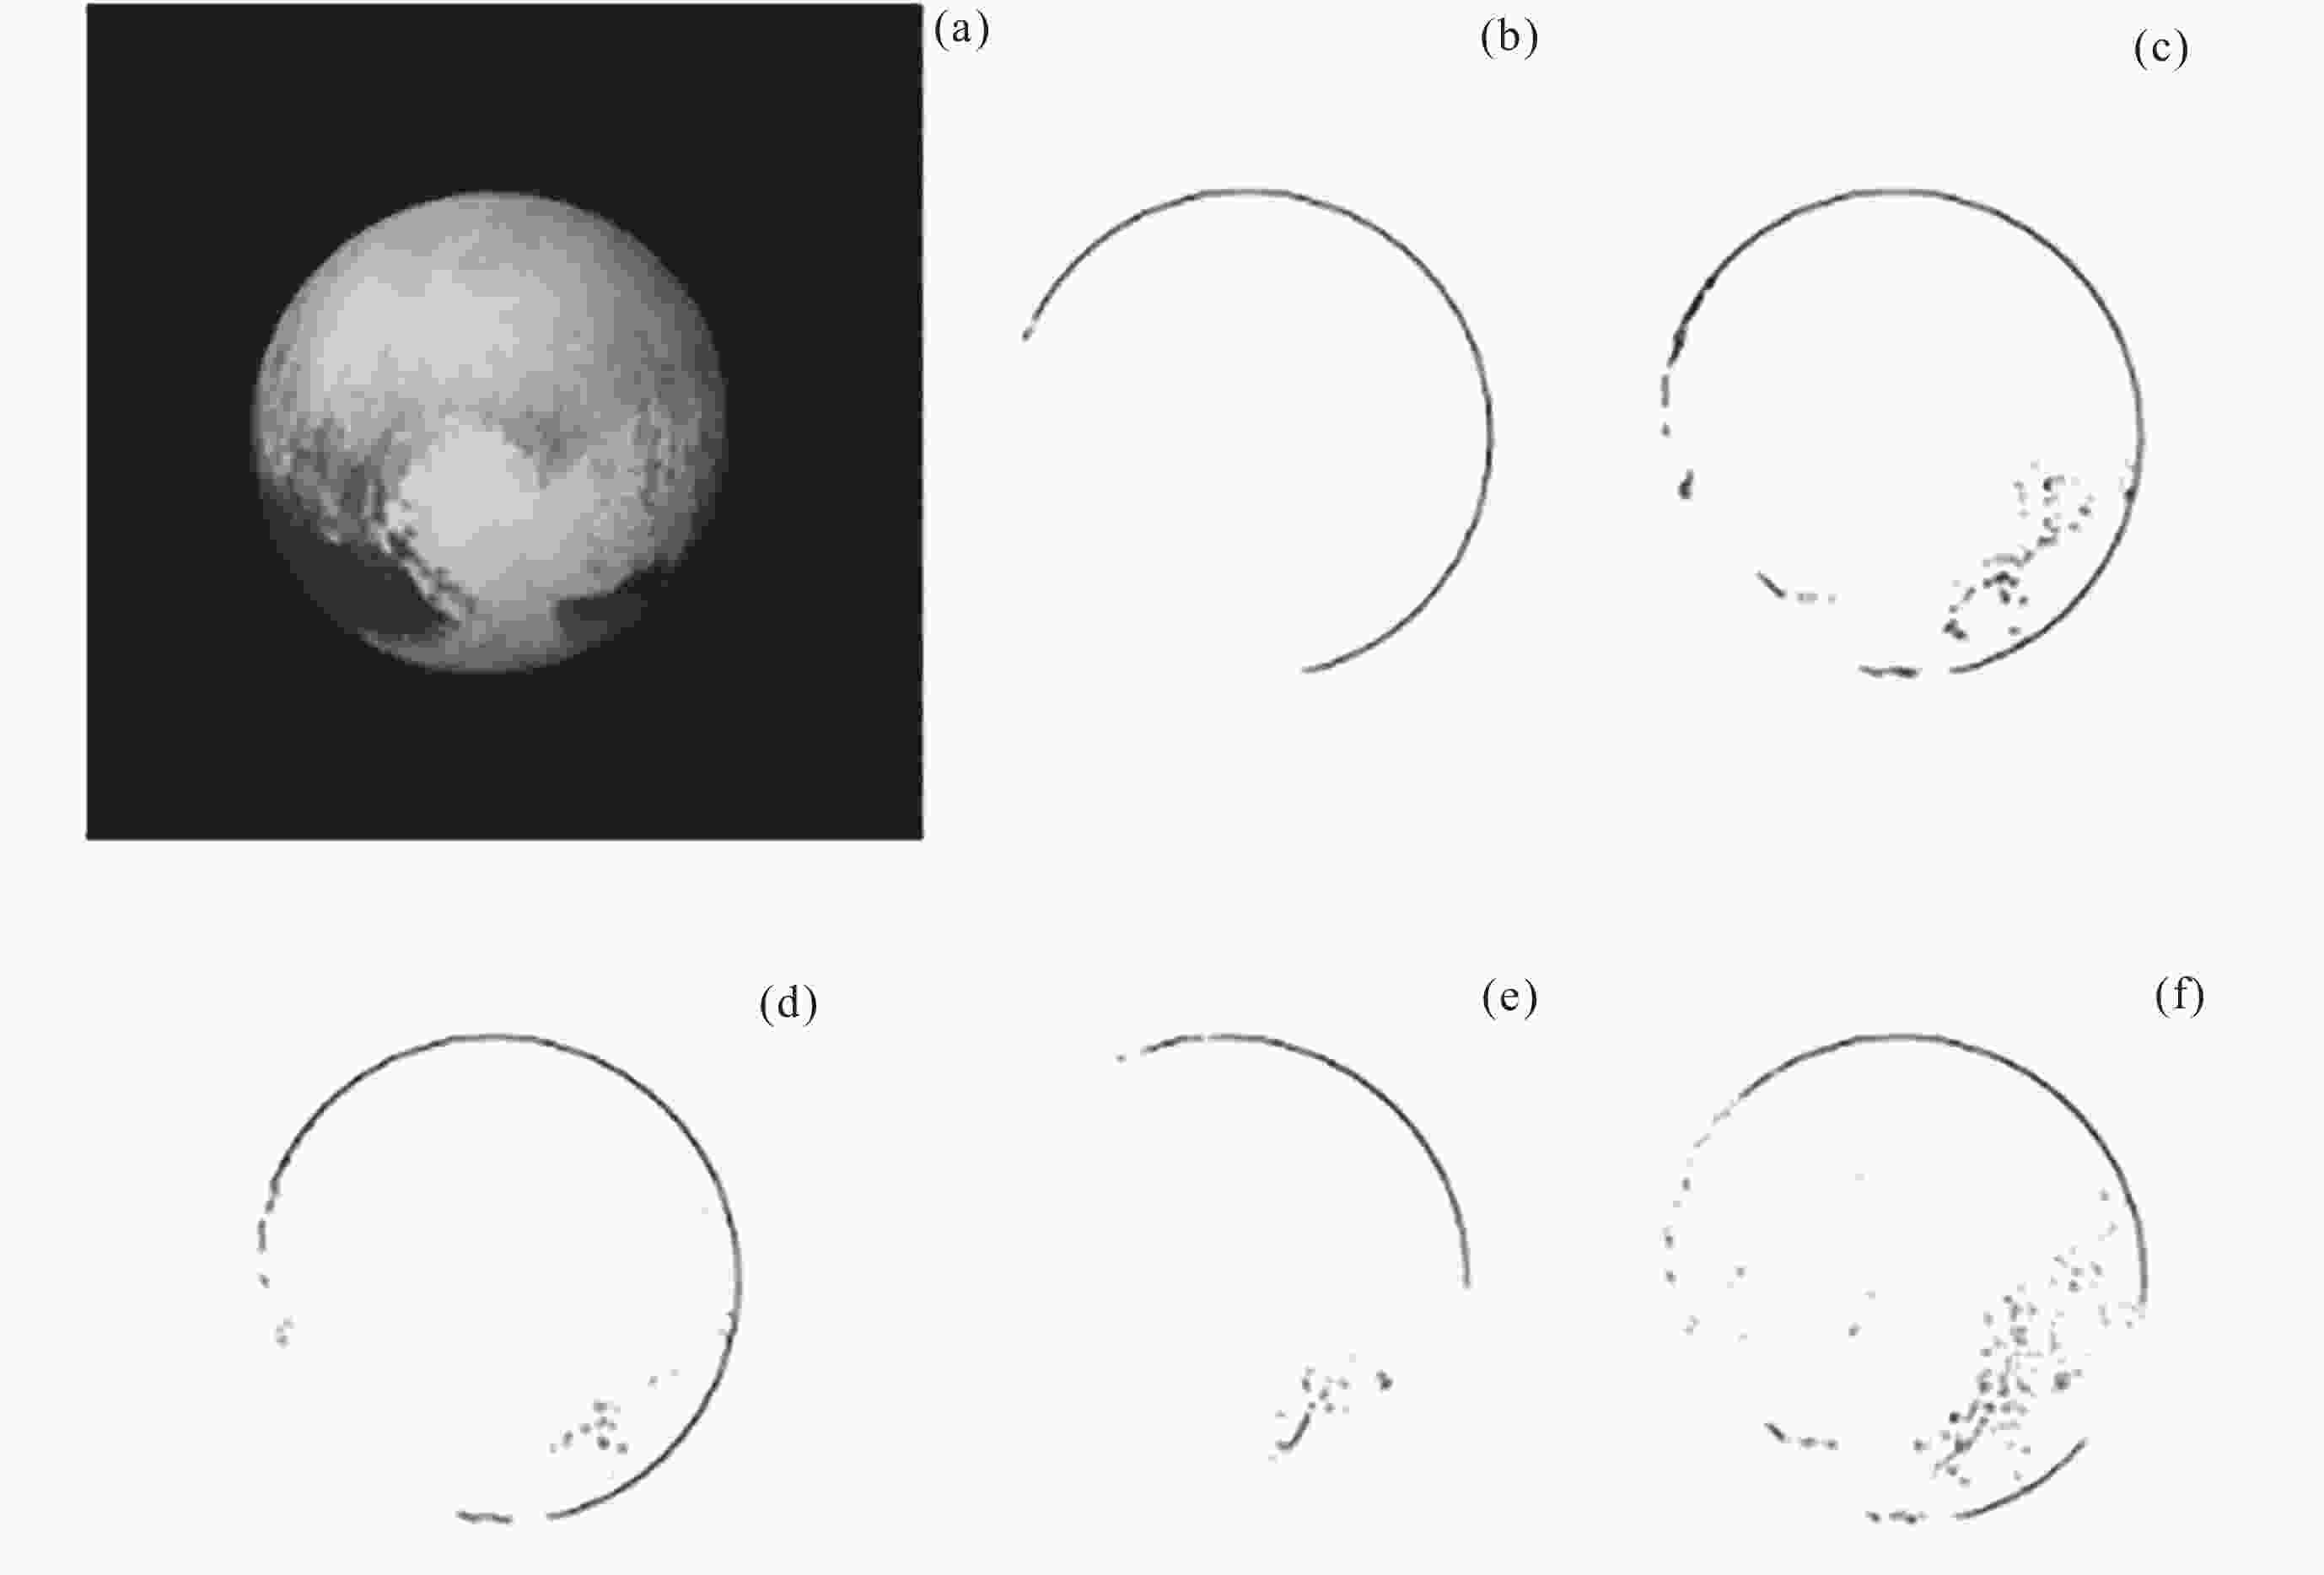
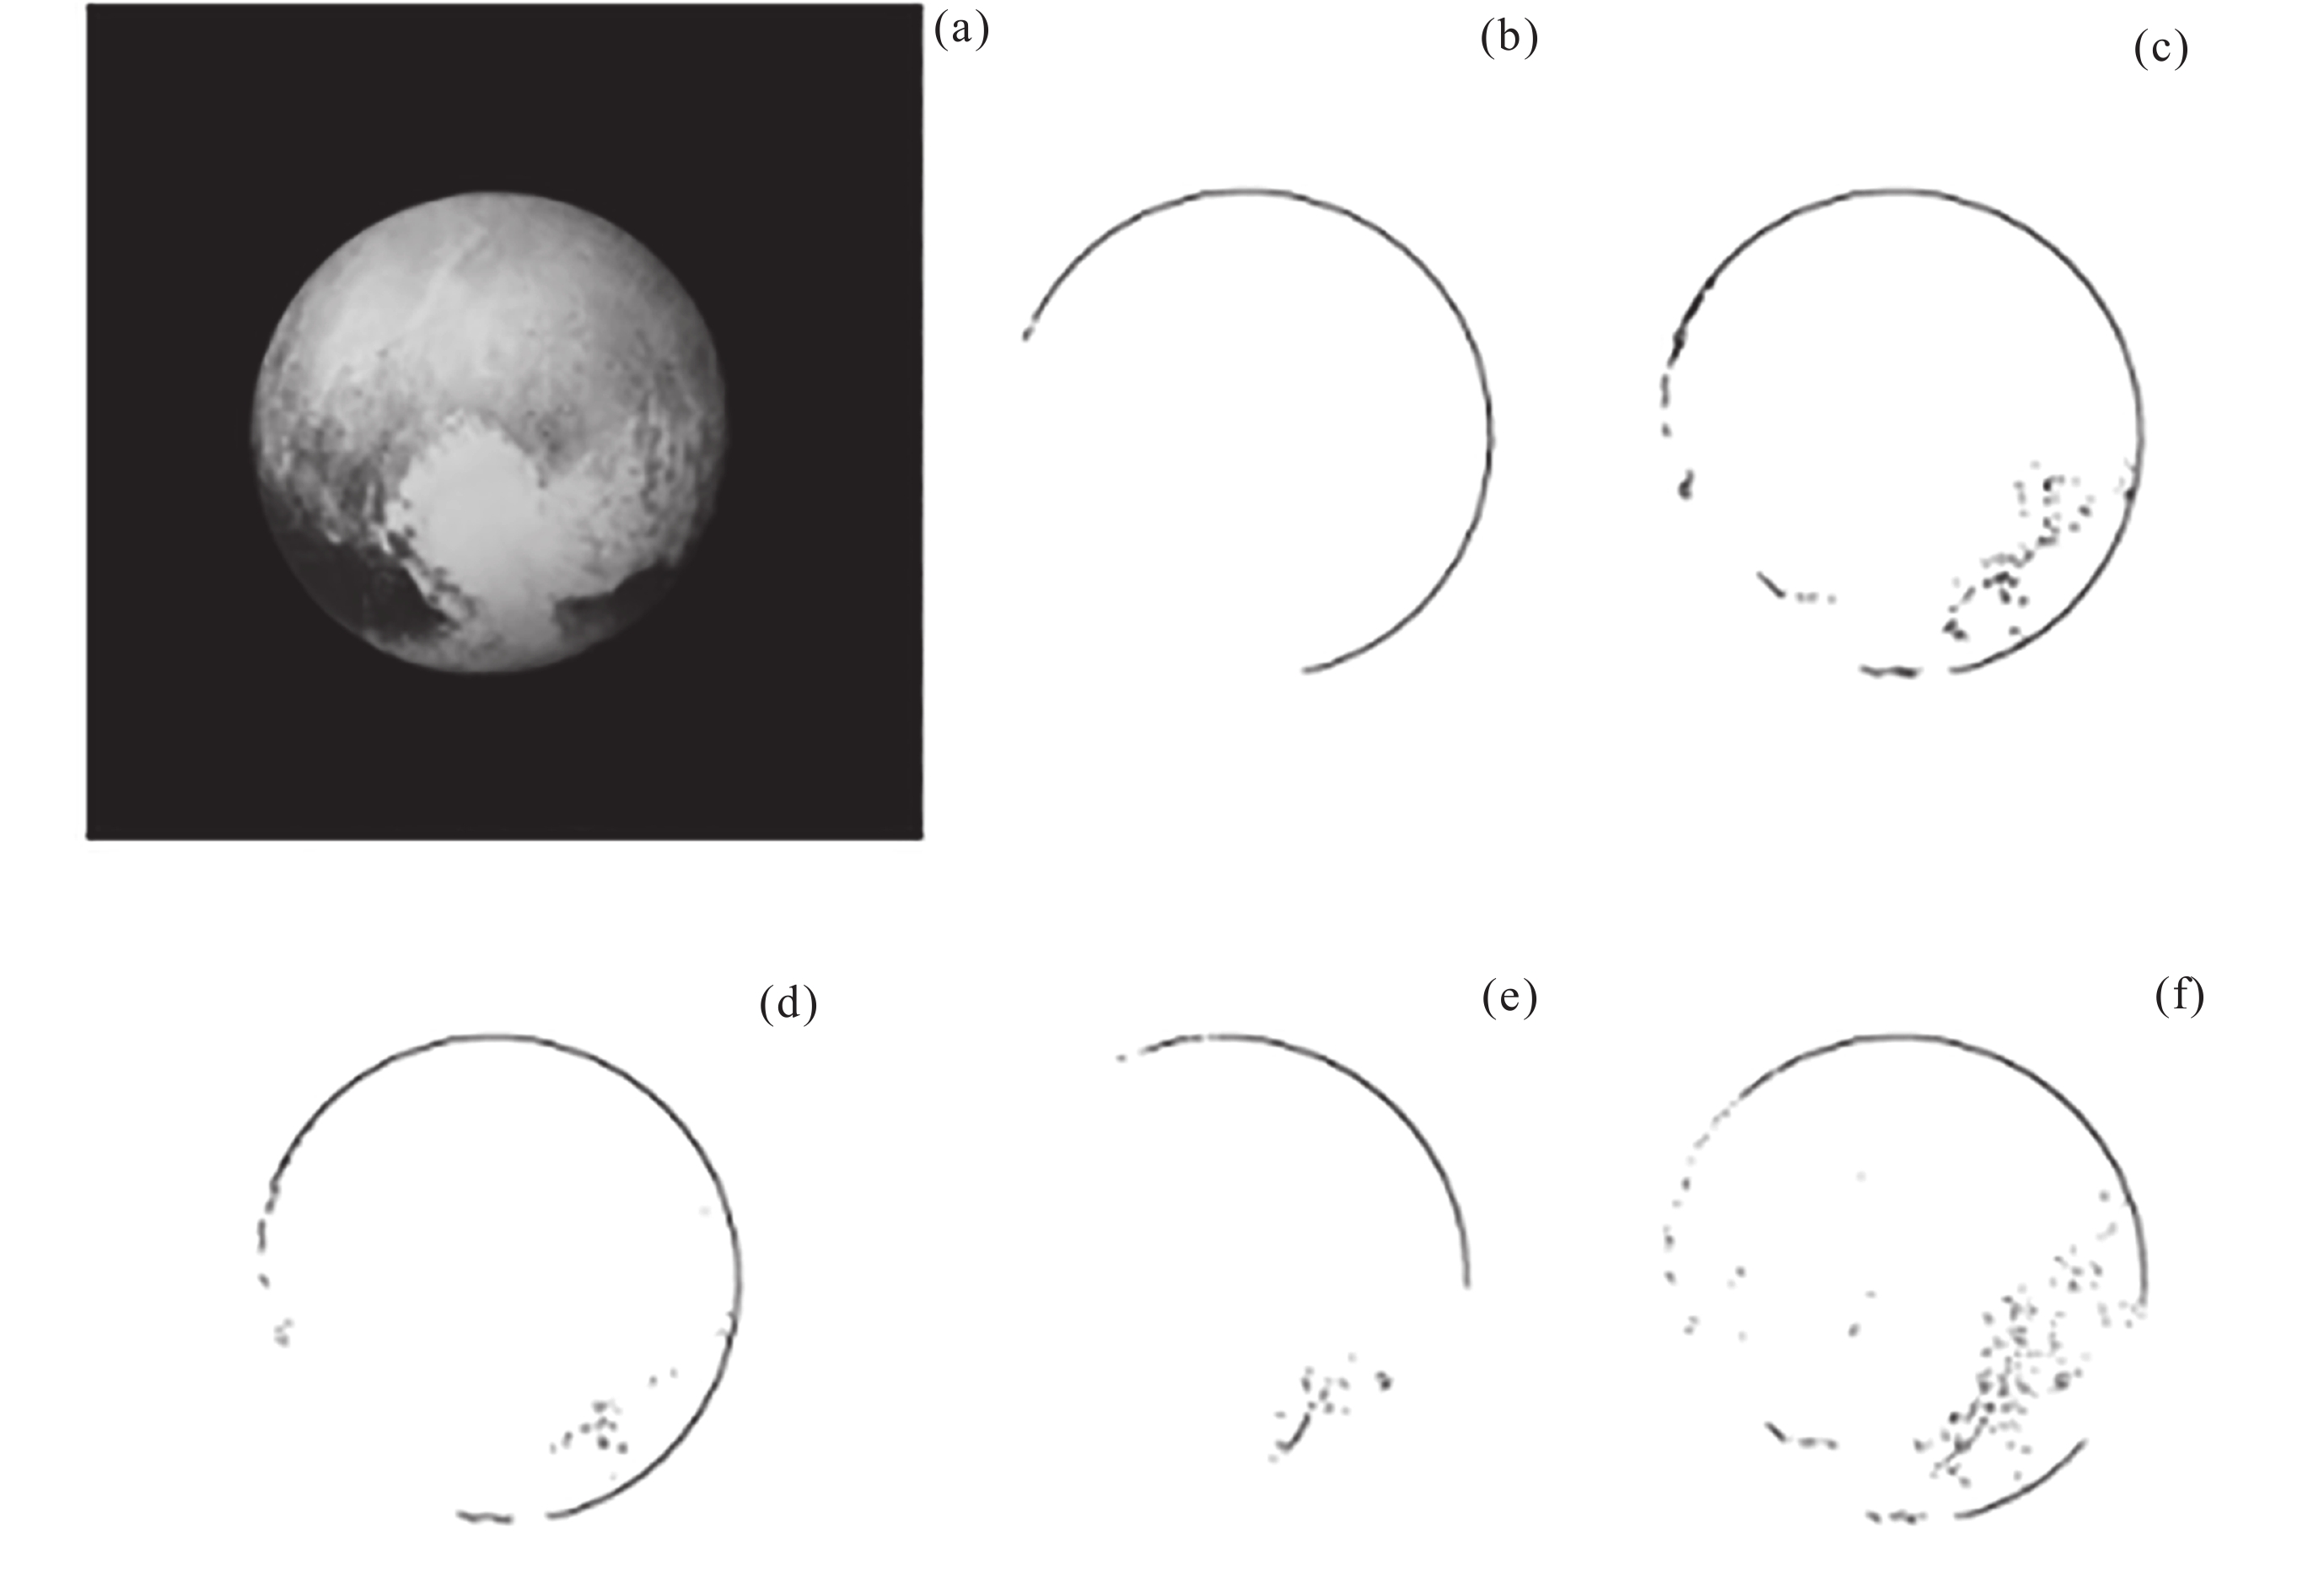
图 8 使用不同方法检测的冥王星边缘结果. (a) 原图像, (b) 窗口–边缘检测法的结果, (c) LPC-ResNet检测结果, (d) 窗口–边缘检测法+LPC-ResNet检测结果, (e) Sobel算子结果, (f) Zhang等提出的方法结果
Figure 8. Contours of Pluto detected using different methods. (a) Original image, (b) the result of window-contour detection method, (c) the result of LPC-ResNet detection, (d) the result of window-contour detection method + LPC-ResNet detection, (e) the result of Sobel operator, (f) the result of method proposed by Zhang et al.
表 4 不同方法的精确率、召回率和F1分数的结果对比
Table 4. Comparison of Precision, Recall, and F1 Score results using different methods
边缘检测方法 精确率 召回率 F1 分数 窗口–边缘检测法 0.954 0.756 0.843 LPC-ResNet-18 0.903 0.965 0.933 LPC-ResNet-34 0.903 0.959 0.929 LPC-ResNet-50 0.900 0.934 0.916 LPC-ResNet-101 0.885 0.903 0.892 LPC-ResNet-152 0.872 0.962 0.914 窗口–边缘检测法+LPC-ResNet-18 0.916 0.963 0.938 窗口–边缘检测法+ LPC-ResNet-34 0.909 0.961 0.934 窗口–边缘检测法+ LPC-ResNet-50 0.887 0.967 0.925 窗口–边缘检测法+LPC-ResNet-101 0.895 0.956 0.925 窗口–边缘检测法+ LPC-ResNet-152 0.895 0.964 0.927 Zhang等提出的方法 0.771 0.746 0.758 Roberts 算子 0.827 0.572 0.676 Sobel 算子 0.829 0.644 0.725 Prewitt 算子 0.829 0.643 0.724  下载: 导出CSV
表 1 LPC-ResNet的架构
Table 1. Architectures for LPC-ResNet
Layer_name LPC-ResNet-18 LPC-ResNet-34 LPC-ResNet-50 LPC-ResNet-101 LPC-ResNet-152 conv1 3×3, 32 3×3, 16 3×3, 8 3×3, 8 3×3, 8 conv2_x 3×3 max pool $ \left[ \begin{array}{c}3\times 3, 32\\ 3\times 3, 32\end{array} \right] $×2 $ \left[ \begin{array}{c}3\times 3, 16\\ 3\times 3, 16\end{array} \right] $×3 $ \left[ \begin{array}{c}1\times 1, 8\\ \begin{array}{c}3\times 3, 8\\ 3\times 3, 32\end{array}\end{array} \right] $×3 $ \left[ \begin{array}{c}1\times 1, 8\\ \begin{array}{c}3\times 3, 8\\ 3\times 3, 32\end{array}\end{array} \right] $×3 $ \left[ \begin{array}{c}1\times 1, 8\\ \begin{array}{c}3\times 3, 8\\ 3\times 3, 32\end{array}\end{array} \right] $×3 conv3_x $ \left[ \begin{array}{c}3\times 3, 64\\ 3\times 3, 64\end{array} \right] $×2 $ \left[ \begin{array}{c}3\times 3, 32\\ 3\times 3, 32\end{array} \right] $×4 $ \left[ \begin{array}{c}1\times 1, 16\\ \begin{array}{c}3\times 3, 16\\ 3\times 3, 64\end{array}\end{array} \right] $×4 $ \left[ \begin{array}{c}1\times 1, 16\\ \begin{array}{c}3\times 3, 16\\ 3\times 3, 64\end{array}\end{array} \right] $×4 $ \left[ \begin{array}{c}1\times 1, 16\\ \begin{array}{c}3\times 3, 16\\ 3\times 3, 64\end{array}\end{array} \right] $×8 conv4_x $ \left[ \begin{array}{c}3\times 3, 128\\ 3\times 3, 128\end{array} \right] $×2 $ \left[ \begin{array}{c}3\times 3, 64\\ 3\times 3, 64\end{array} \right] $×6 $ \left[ \begin{array}{c}1\times 1, 32\\ \begin{array}{c}3\times 3, 32\\ 3\times 3, 128\end{array}\end{array} \right] $×6 $ \left[ \begin{array}{c}1\times 1, 32\\ \begin{array}{c}3\times 3, 32\\ 3\times 3, 128\end{array}\end{array} \right] $×23 $ \left[ \begin{array}{c}1\times 1, 32\\ \begin{array}{c}3\times 3, 32\\ 3\times 3, 128\end{array}\end{array} \right] $×36 conv5_x $ \left[ \begin{array}{c}3\times 3, 256\\ 3\times 3, 256\end{array} \right] $×2 $ \left[ \begin{array}{c}3\times 3, 128\\ 3\times 3, 128\end{array} \right] $×3 $ \left[ \begin{array}{c}1\times 1, 64\\ \begin{array}{c}3\times 3, 64\\ 3\times 3, 256\end{array}\end{array} \right] $×3 $ \left[ \begin{array}{c}1\times 1, 64\\ \begin{array}{c}3\times 3, 64\\ 3\times 3, 256\end{array}\end{array} \right] $×3 $ \left[ \begin{array}{c}1\times 1, 64\\ \begin{array}{c}3\times 3, 64\\ 3\times 3, 256\end{array}\end{array} \right] $×3 Output average pool, 2d-fc, softmax
下载: 导出CSV
表 2 不同结构与像素邻域尺寸条件下的LPC-ResNet测试结果 (准确率/召回率/F1分数)
Table 2. Test results of LPC-ResNet under different numbers of layers and different pixel neighborhood sizes (Precision/Recall/F1 Score)
结构 像素邻域尺寸 $ 3\times 3 $ $ 5\times 5 $ $ 7\times 7 $ $ 9\times 9 $ 平均值 LPC-ResNet-18 0.926/0.966/0.946 0.931/0.944/0.937 0.852/0.983/0.913 0.903/0.968/0.934 0.903/0.965/0.933 LPC-ResNet-34 0.936/0.920/0.928 0.901/0.980/0.939 0.919/0.957/0.937 0.854/0.979/0.912 0.903/0.959/0.929 LPC-ResNet-50 0.918/0.922/0.920 0.859/0.949/0.901 0.926/0.892/0.909 0.896/0.973/0.933 0.900/0.934/0.916 LPC-ResNet-101 0.876/0.947/0.910 0.881/0.882/0.881 0.923/0.847/0.883 0.859/0.934/0.895 0.885/0.903/0.892 LPC-ResNet-152 0.925/0.918/0.922 0.885/0.978/0.929 0.814/0.986/0.892 0.865/0.965/0.912 0.872/0.962/0.914 平均值 0.916/0.935/0.925 0.891/0.947/0.917 0.887/0.933/0.907 0.875/0.964/0.917 ―
下载: 导出CSV
表 3 不同结构与像素邻域尺寸条件下的二阶段检测方法的测试结果 (准确率/召回率/F1分数)
Table 3. Test results of two-stage detection method under different numbers of layers and different pixel neighborhood sizes (Precision/Recall/ F1 Score)
结构 像素邻域尺寸 $ 3\times 3 $ $ 5\times 5 $ $ 7\times 7 $ $ 9\times 9 $ 平均值 窗口–边缘检测+LPC-
ResNet-180.941/0.945/0.943 0.910/0.982/0.944 0.893/0.970/0.930 0.920/0.954/0.936 0.916/0.963/0.938 窗口–边缘检测+LPC-
ResNet-340.936/0.939/0.937 0.873/0.982/0.925 0.906/0.950/0.927 0.919/0.973/0.945 0.909/0.961/0.934 窗口–边缘检测 +LPC-
ResNet-500.912/0.962/0.937 0.881/0.960/0.919 0.899/0.978/0.937 0.855/0.969/0.908 0.887/0.967/0.925 窗口–边缘检测+LPC-
ResNet-1010.904/0.936/0.920 0.881/0.963/0.920 0.905/0.960/0.932 0.890/0.966/0.926 0.895/0.956/0.925 窗口–边缘检测+LPC-
ResNet-1520.901/0.968/0.933 0.855/0.993/0.919 0.899/0.955/0.926 0.923/0.939/0.931 0.895/0.964/0.927 平均值 0.919/0.950/0.934 0.880/0.976/0.925 0.900/0.963/0.930 0.901/0.960/0.929 ―
下载: 导出CSV
表 5 窗口–边缘检测法与二阶段检测方法在$ \mathit{x} $和$ \mathit{y} $方向的 (O-C) 误差均值与标准差 (以Plu060历表为参考)
Table 5. Mean and standard deviation of (O-C) errors in $ \mathit{x} $ and $ \mathit{y} $ directions of the window-contour detection method and the two-stage detection method, using the Plu060 ephemeris as reference
测量指标 窗口–边缘检测法 窗口–边缘检测法+LPC-ResNet $ x $方向(O-C)误差均值$ /\mathrm{k}\mathrm{m} $ –25.13 –11.52 $ x $方向(O-C)误差标准差$ /\mathrm{k}\mathrm{m} $ 74.86 66.56 $ y $方向(O-C)误差均值$ /\mathrm{k}\mathrm{m} $ –16.55 –10.81 $ y $方向(O-C)误差标准差$ /\mathrm{k}\mathrm{m} $ 39.27 38.00
下载: 导出CSV
-
[1] COOPER N J, LAINEY V, MEUNIER L E, et al. The Caviar software package for the astrometric reduction of Cassini ISS images: description and examples[J]. Astronomy :Times New Roman;">& Astrophysics, 2018, 610: A2 [2] ZHANG Q F, LAINEY V, COOPER N J, et al. First astrometric reduction of Cassini Imaging Science Subsystem images using an automatic procedure: application to Enceladus images 2013-2017[J]. Monthly Notices of the Royal Astronomical Society, 2018, 481(1): 98-104 doi: 10.1093/mnras/sty2187 [3] ZHANG Q F, QIN W H, MA Y L, et al. Complementary astrometry of Cassini Imaging Science Subsystem images of phoebe[J]. Planetary and Space Science, 2022, 221: 105553 doi: 10.1016/j.pss.2022.105553 [4] 王志强, 刘梦琪, 张庆丰, 等. Cassini 图像中受散射光影响的7颗土星近环内卫星的天体测量[J]. 天文学报, 2023, 64(6): 69WANG Zhiqiang, LIU Mengqi, ZHANG Qingfeng, et al. Astrometry of Cassini ISS images of 7 near-ring inner satellites of Saturn affected by scattered light[J]. Acta Astronomica Sinica, 2023, 64(6): 69 [5] PORTER S B, CANUP R M. Orbits and masses of the small satellites of Pluto[J]. The Planetary Science Journal, 2023, 4(7): 120 doi: 10.3847/PSJ/acde77 [6] WANG L L, YU Y, YULDOSHEV Q X, et al. New reduction of old glass astronomical plates of Pallas and Vesta in 1956-1994 based on Gaia DR3 catalogue[J]. Planetary and Space Science, 2023, 227: 105637 doi: 10.1016/j.pss.2023.105637 [7] NIMMO F, UMURHAN O, LISSE C M, et al. Mean radius and shape of Pluto and Charon from New Horizons images[J]. Icarus, 2017, 287: 12-29 doi: 10.1016/j.icarus.2016.06.027 [8] GUO Y P, FARQUHAR R W. New Horizons mission design[J]. Space Science Reviews, 2008, 140(1): 49-74 [9] STERN S A, BAGENAL F, ENNICO K, et al. The Pluto system: initial results from its exploration by New Horizons[J]. Science, 2015, 350(6258): aad1815 doi: 10.1126/science.aad1815 [10] ZHARKOVA V V, IPSON S S, ZHARKOV S I, et al. A full-disk image standardisation of the synoptic solar observations at the Meudon Observatory[J]. Solar physics, 2003, 214(1): 89-105 doi: 10.1023/A:1024081931946 [11] 袁飞. 太阳耀斑实时监测与预报方法的研究[D]. 北京: 中国科学院大学, 2017YUAN Fei. Research on the Real-time Monitoring and Forecasting Method of Solar Flare[D]. Beijing: University of Chinese Academy of Sciences, 2017 [12] 张庆丰, 郑洋, 成国豪, 等. 使用深度神经网络检测Cassini ISS图像中圆盘状星体轮廓[J]. 空间科学学报, 2020, 40(2): 289-295 doi: 10.11728/cjss2020.02.289ZHANG Qingfeng, ZHENG Yang, CHENG Guohao, et al. Contour detection of disk resolved objects in Cassini ISS Image using deep neural network[J]. Chinese Journal of Space Science, 2020, 40(2): 289-295 doi: 10.11728/cjss2020.02.289 [13] YANG X Q, ZHANG Q F, LI Z. Contour detection in Cassini ISS images based on Hierarchical Extreme Learning Machine and Dense Conditional Random Field[J]. Research in Astronomy and Astrophysics, 2020, 20(1): 011 doi: 10.1088/1674-4527/20/1/11 [14] HE K M, ZHANG X Y, REN S Q, et al. Deep residual learning for image recognition[C]//Proceedings of the 2016 IEEE Conference on Computer Vision and Pattern Recognition. Las Vegas: IEEE, 2016: 770-778 [15] WEAVER H A, CHENG A F, MORGAN F, et al. In-flight performance and calibration of the LOng Range Reconnaissance Imager (LORRI) for the New Horizons mission[J]. Publications of the Astronomical Society of the Pacific, 2020, 132(1009): 035003 doi: 10.1088/1538-3873/ab67ec [16] PUKELSHEIM F. The three sigma rule[J]. The American Statistician, 1994, 48(2): 88-91 doi: 10.1080/00031305.1994.10476030 [17] XU M L, YOON S, FUENTES A, et al. A comprehensive survey of image augmentation techniques for deep learning[J]. Pattern Recognition, 2023, 137: 109347 doi: 10.1016/j.patcog.2023.109347 [18] 张伟, 张咪, 金佳齐, 等. 基于ResNet深度学习网络的隔离开关状态识别研究[J]. 高压电器, 2024, 60(6): 99-106ZHANG Wei, ZHANG Mi, JIN Jiaqi, et al. Research on status identification of disconnector based on ResNet deep learning network[J]. High Voltage Apparatus, 2024, 60(6): 99-106 [19] OPITZ J, BURST S. Macro F1 and macro F1[OL]. arXiv preprint arXiv: 1911.03347, 2019 [20] CHEN S, GAMECHI Z S, DUBOST F, et al. An end-to-end approach to segmentation in medical images with CNN and posterior-CRF[J]. Medical Image Analysis, 2022, 76: 102311 doi: 10.1016/j.media.2021.102311 [21] YU Q, SHI C. An image classification approach for painting using improved convolutional neural algorithm[J]. Soft Computing, 2024, 28(1): 847-873 doi: 10.1007/s00500-023-09420-1 [22] AL-ZEBARI A. Ensemble convolutional neural networks and transformer-based segmentation methods for achieving accurate sclera segmentation in eye images[J]. Signal, Image and Video Processing, 2024, 18(2): 1879-1891 doi: 10.1007/s11760-023-02891-7 [23] 冯伟, 刘光宇, 曹禹, 等. 典型微分算子的图像边缘检测对比研究[J]. 河南科技学院学报(自然科学版), 2022, 50(4): 54-61FENG Wei, LIU Guangyu, CAO Yu, et al. A comparative study of image edge detection with typical differential operators[J]. Journal of Henan Institute of Science and Technology (Natural Science Edition), 2022, 50(4): 54-61 [24] COOPER N J, MURRAY C D, PORCO C C, et al. Cassini ISS astrometric observations of the inner Jovian satellites, Amalthea and Thebe[J]. Icarus, 2006, 181(1): 223-234 doi: 10.1016/j.icarus.2005.11.007 [25] COOPER N J, MURRAY C D, LAINEY V, et al. Cassini ISS mutual event astrometry of the mid-sized Saturnian Satellites 2005-2012[J]. Astronomy and Astrophysics, 2014, 572: A43 [26] ACTON JR C H. Ancillary data services of NASA’s Navigation and Ancillary Information Facility[J]. Planetary and Space Science, 1996, 44(1): 65-70 doi: 10.1016/0032-0633(95)00107-7 -
-

 下载:
下载:

计量
- 文章访问数: 712
- HTML全文浏览量: 278
- PDF下载量: 118
-
被引次数:
0(来源:Crossref)
0(来源:其他)

