


基于子午工程地磁数据构建中国区域地磁指数
doi: 10.11728/cjss2026.05.2025-0200 cstr: 32142.14.cjss.2025-0200
-
 刘子谦 男, 1984年8月出生于河南省安阳市, 现为中国科学院国家空间科学中心项目高级工程师, 主要研究方向为太阳/行星际扰动和地磁扰动研究、中高层大气特征研究等. E-mail: zqliu@spaceweather.ac.cn
 -
 李晖 男, 1985年2月出生于安徽省铜陵市, 现为中国科学院国家空间科学中心研究员, 博士生导师, 主要研究方向为行星际扰动传播及演化、地球空间暴动力学、空间天气影响全球变化等. E-mail: hli@spaceweather.ac.cn
作者简介:
通讯作者:
Chinese Geomagnetic Index Based on Chinese Meridian Project Geomagnetic Data
-
摘要: 地球磁层环电流所造成的中低纬度地区地表磁场水平分量的剧烈扰动, 可以通过暴时扰动(Dst)指数和对称H分量(SYM-H)指数来表征. Dst指数和SYM-H指数作为衡量地磁活动的重要指标, 能够清楚反映磁暴的发生时间和强度. 由于磁暴期间环电流的不对称性, 不同地方时的地磁扰动水平存在显著差异, 而Dst指数和SYM-H指数作为全球地磁指数, 不一定能准确描述中国区域的地磁扰动情况. 本文利用子午工程拉萨、成都、武汉、杭州4个台站2010-2024年的地磁数据, 计算得到了中国区域地磁指数(cDst指数、cSYM-H指数), 并与全球地磁指数(Dst指数和SYM-H指数)开展对比分析. 结果表明, 两类中国区域地磁指数能更准确地描述中国区域地磁扰动特征, 其与全球地磁指数的差异呈现晨昏侧依赖性: 中国位于昏侧时, 中国区域地磁指数绝对值大于全球地磁指数; 而位于晨侧时, 则小于全球地磁指数. 相应地, 中国位于昏侧时, 中国区域磁扰数量多于磁暴数量; 而位于晨侧时, 则少于磁暴数量. 这些现象的物理机制与环电流的晨昏不对称性密切相关. 同时, 基于中国区域地磁指数可有效反演全球地磁指数, 反演结果符合良好, 所以在全球地磁指数无法获取时, 可以提供高质量补充数据.
-
关键词:
- 子午工程 /
- Dst指数 /
- SYM-H指数 /
- 中国区域Dst指数 /
- 中国区域SYM-H指数
Abstract: The great disturbances of the horizontal component of the geomagnetic field in mid-low latitudes caused by the ring current in the Earth’s magnetosphere can be characterized by the Disturbance Storm Time (Dst) index and the symmetric H component (SYM-H) index. The Dst index and SYM-H index are important indicators for measuring geomagnetic activity, which can clearly reflect the commencement and intensity of geomagnetic storms. Due to the asymmetry of ring current during geomagnetic storms, there are significant differences in the geomagnetic disturbance intensity in different regions. As global geomagnetic index, Dst index and SYM-H index may not accurately describe the geomagnetic disturbance situation in China. We uses geomagnetic data from four stations in Lhasa, Chengdu, Wuhan, and Hangzhou of the Chinese Meridian Project from 2010 to 2024 to calculate the Chinese geomagnetic index (cDst index, cSYM-H index), and compares and analyzes them with the global geomagnetic index (Dst index, SYM-H index). The results indicate that the two types of Chinese geomagnetic index can more accurately describe the characteristics of geomagnetic disturbances in China, and their differences from the global geomagnetic index show a dawn-dusk dependence: The absolute value of the Chinese geomagnetic index is greater than the global geomagnetic index when China is located on the dusk side, and is less when China is on the dawn side. Correspondingly, the number of Chinese geomagnetic disturbances is more than geomagnetic storms when China is located on the dusk side, and is less when China is on the dawn side. The physical mechanism of these phenomena is closely related to the dawn-dusk asymmetry of the ring current. Meanwhile, based on the Chinese geomagnetic index, the global geomagnetic index can be effectively obtained, and the results are in good agreement. Therefore, when the global geomagnetic index cannot be obtained, high-quality supplementary data can be provided.-
Key words:
- Chinese Meridian Project /
- Dst index /
- SYM-H index /
- Chinese Dst index /
- Chinese SYM-H index
-
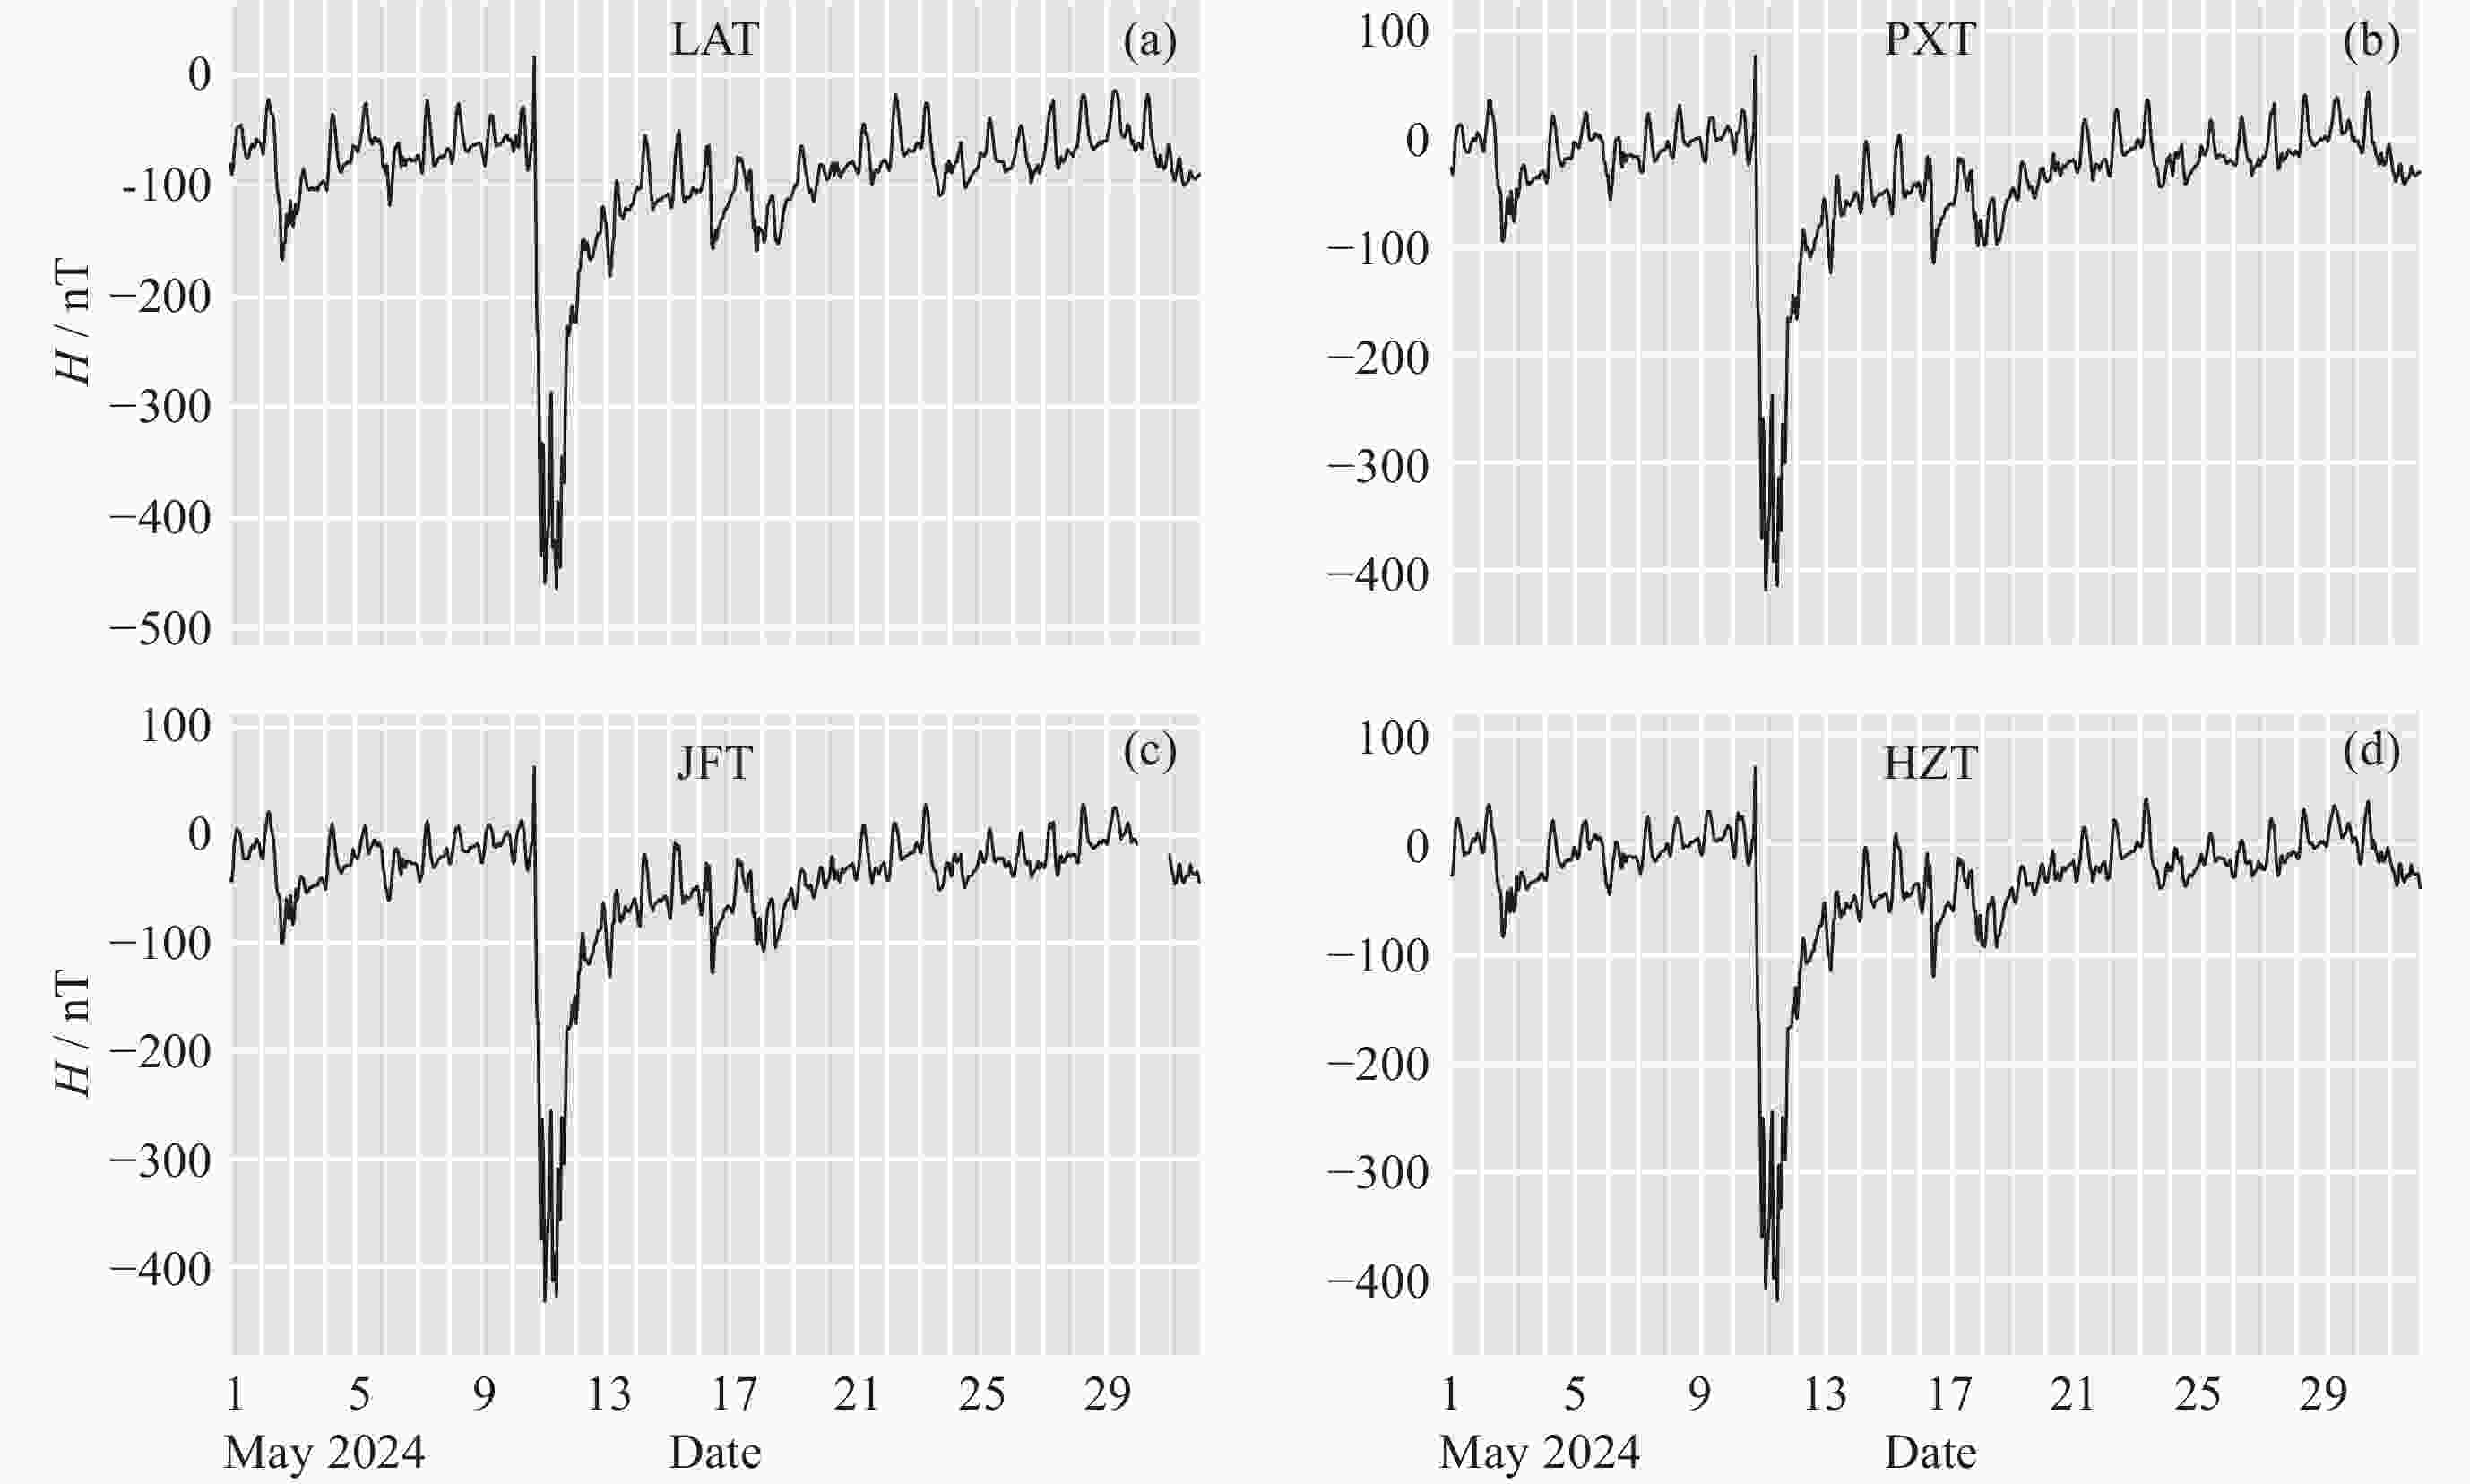
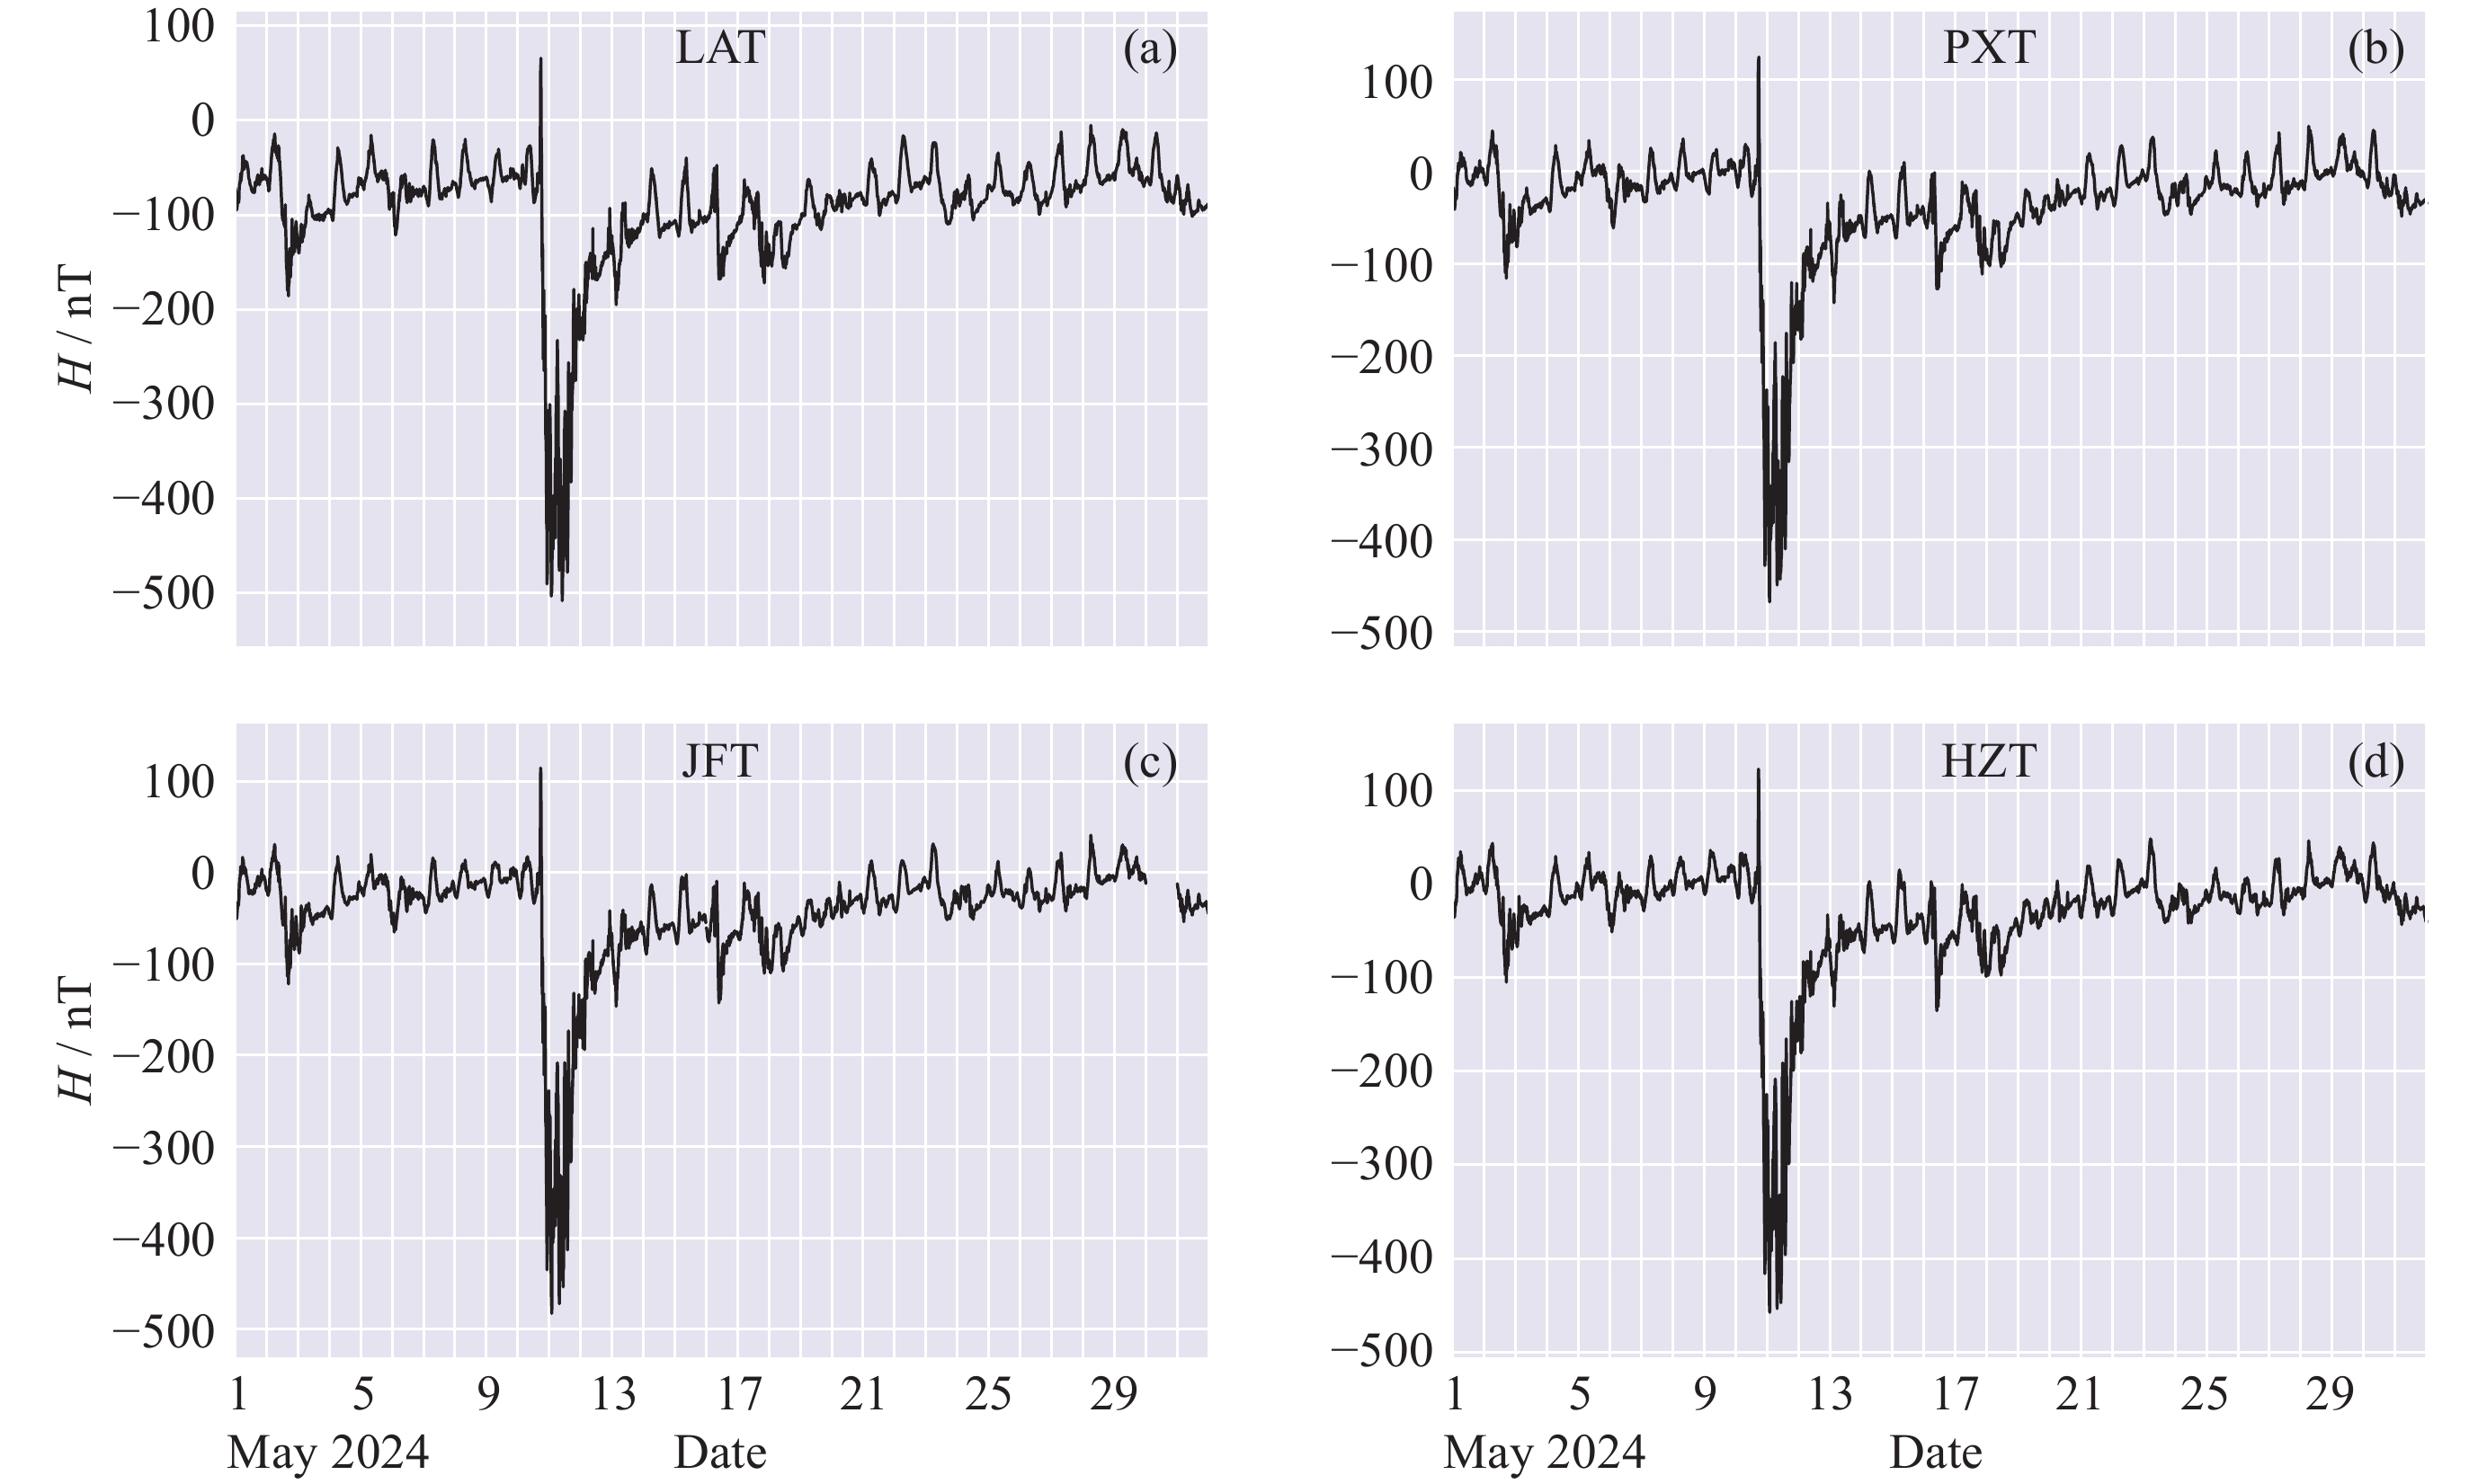
图 1 2024年5月4个站点的地磁H分量
Figure 1. Geomagnetic H component of 4 observatories in May 2024
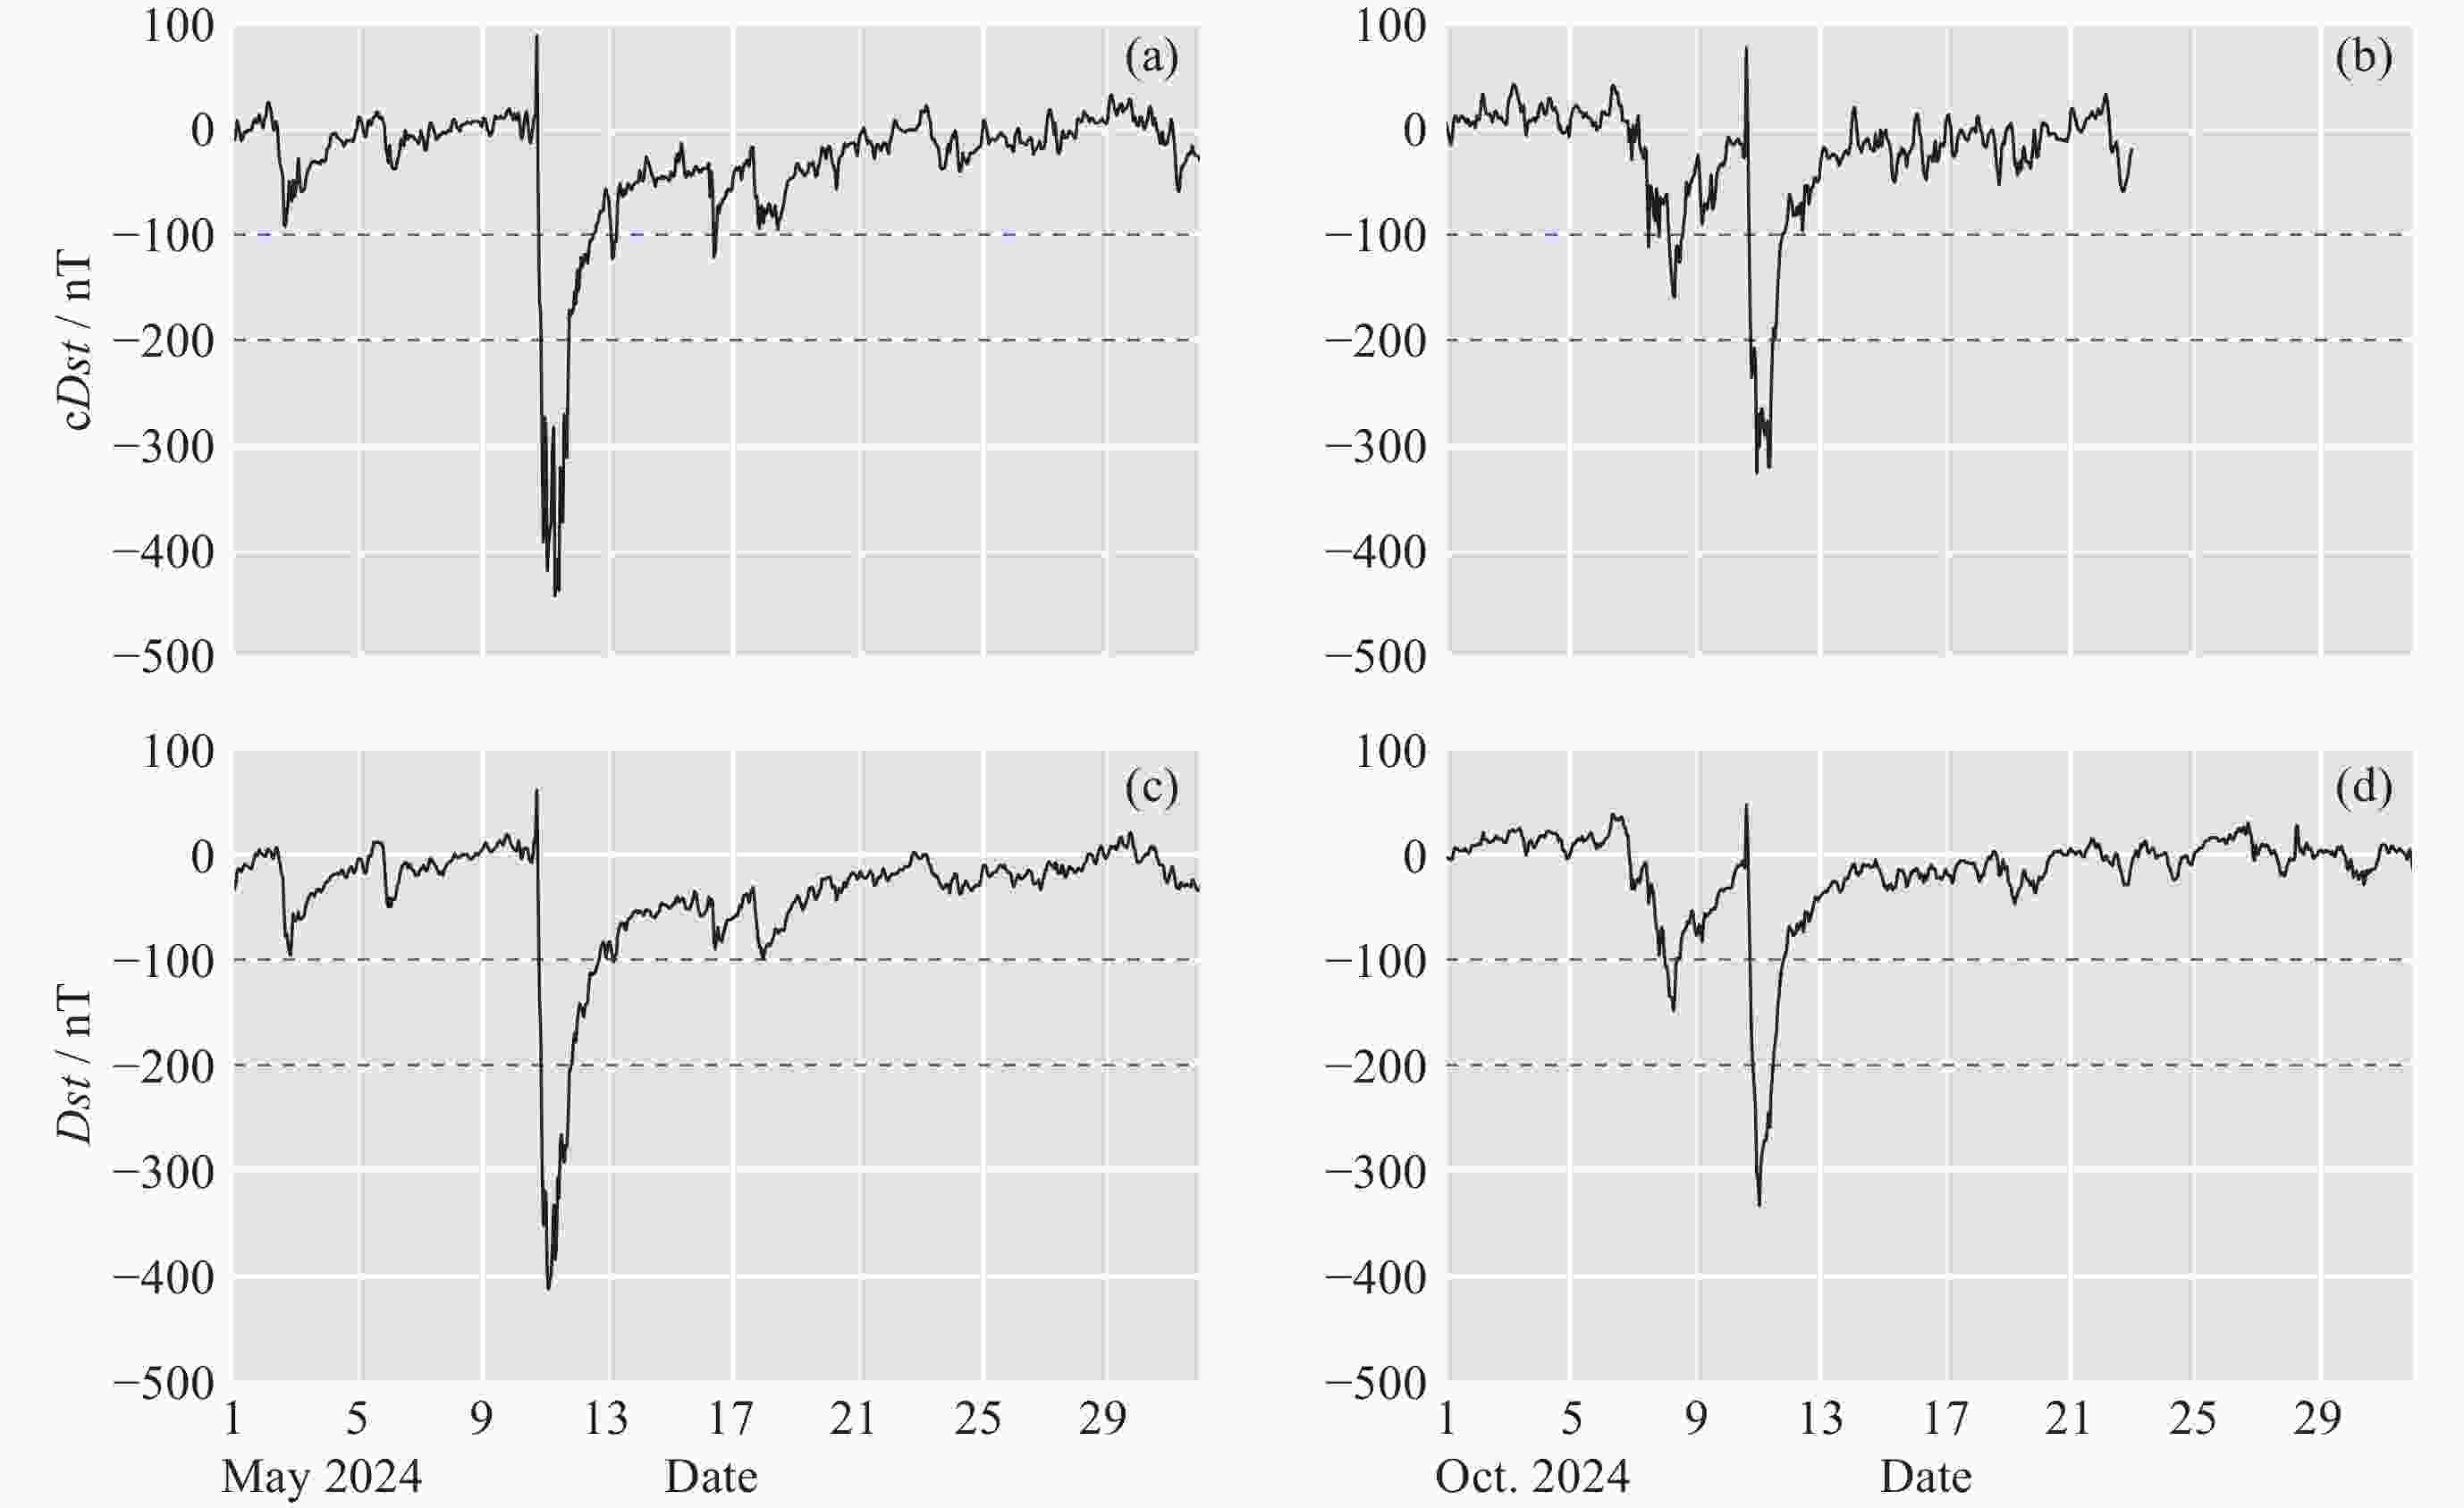
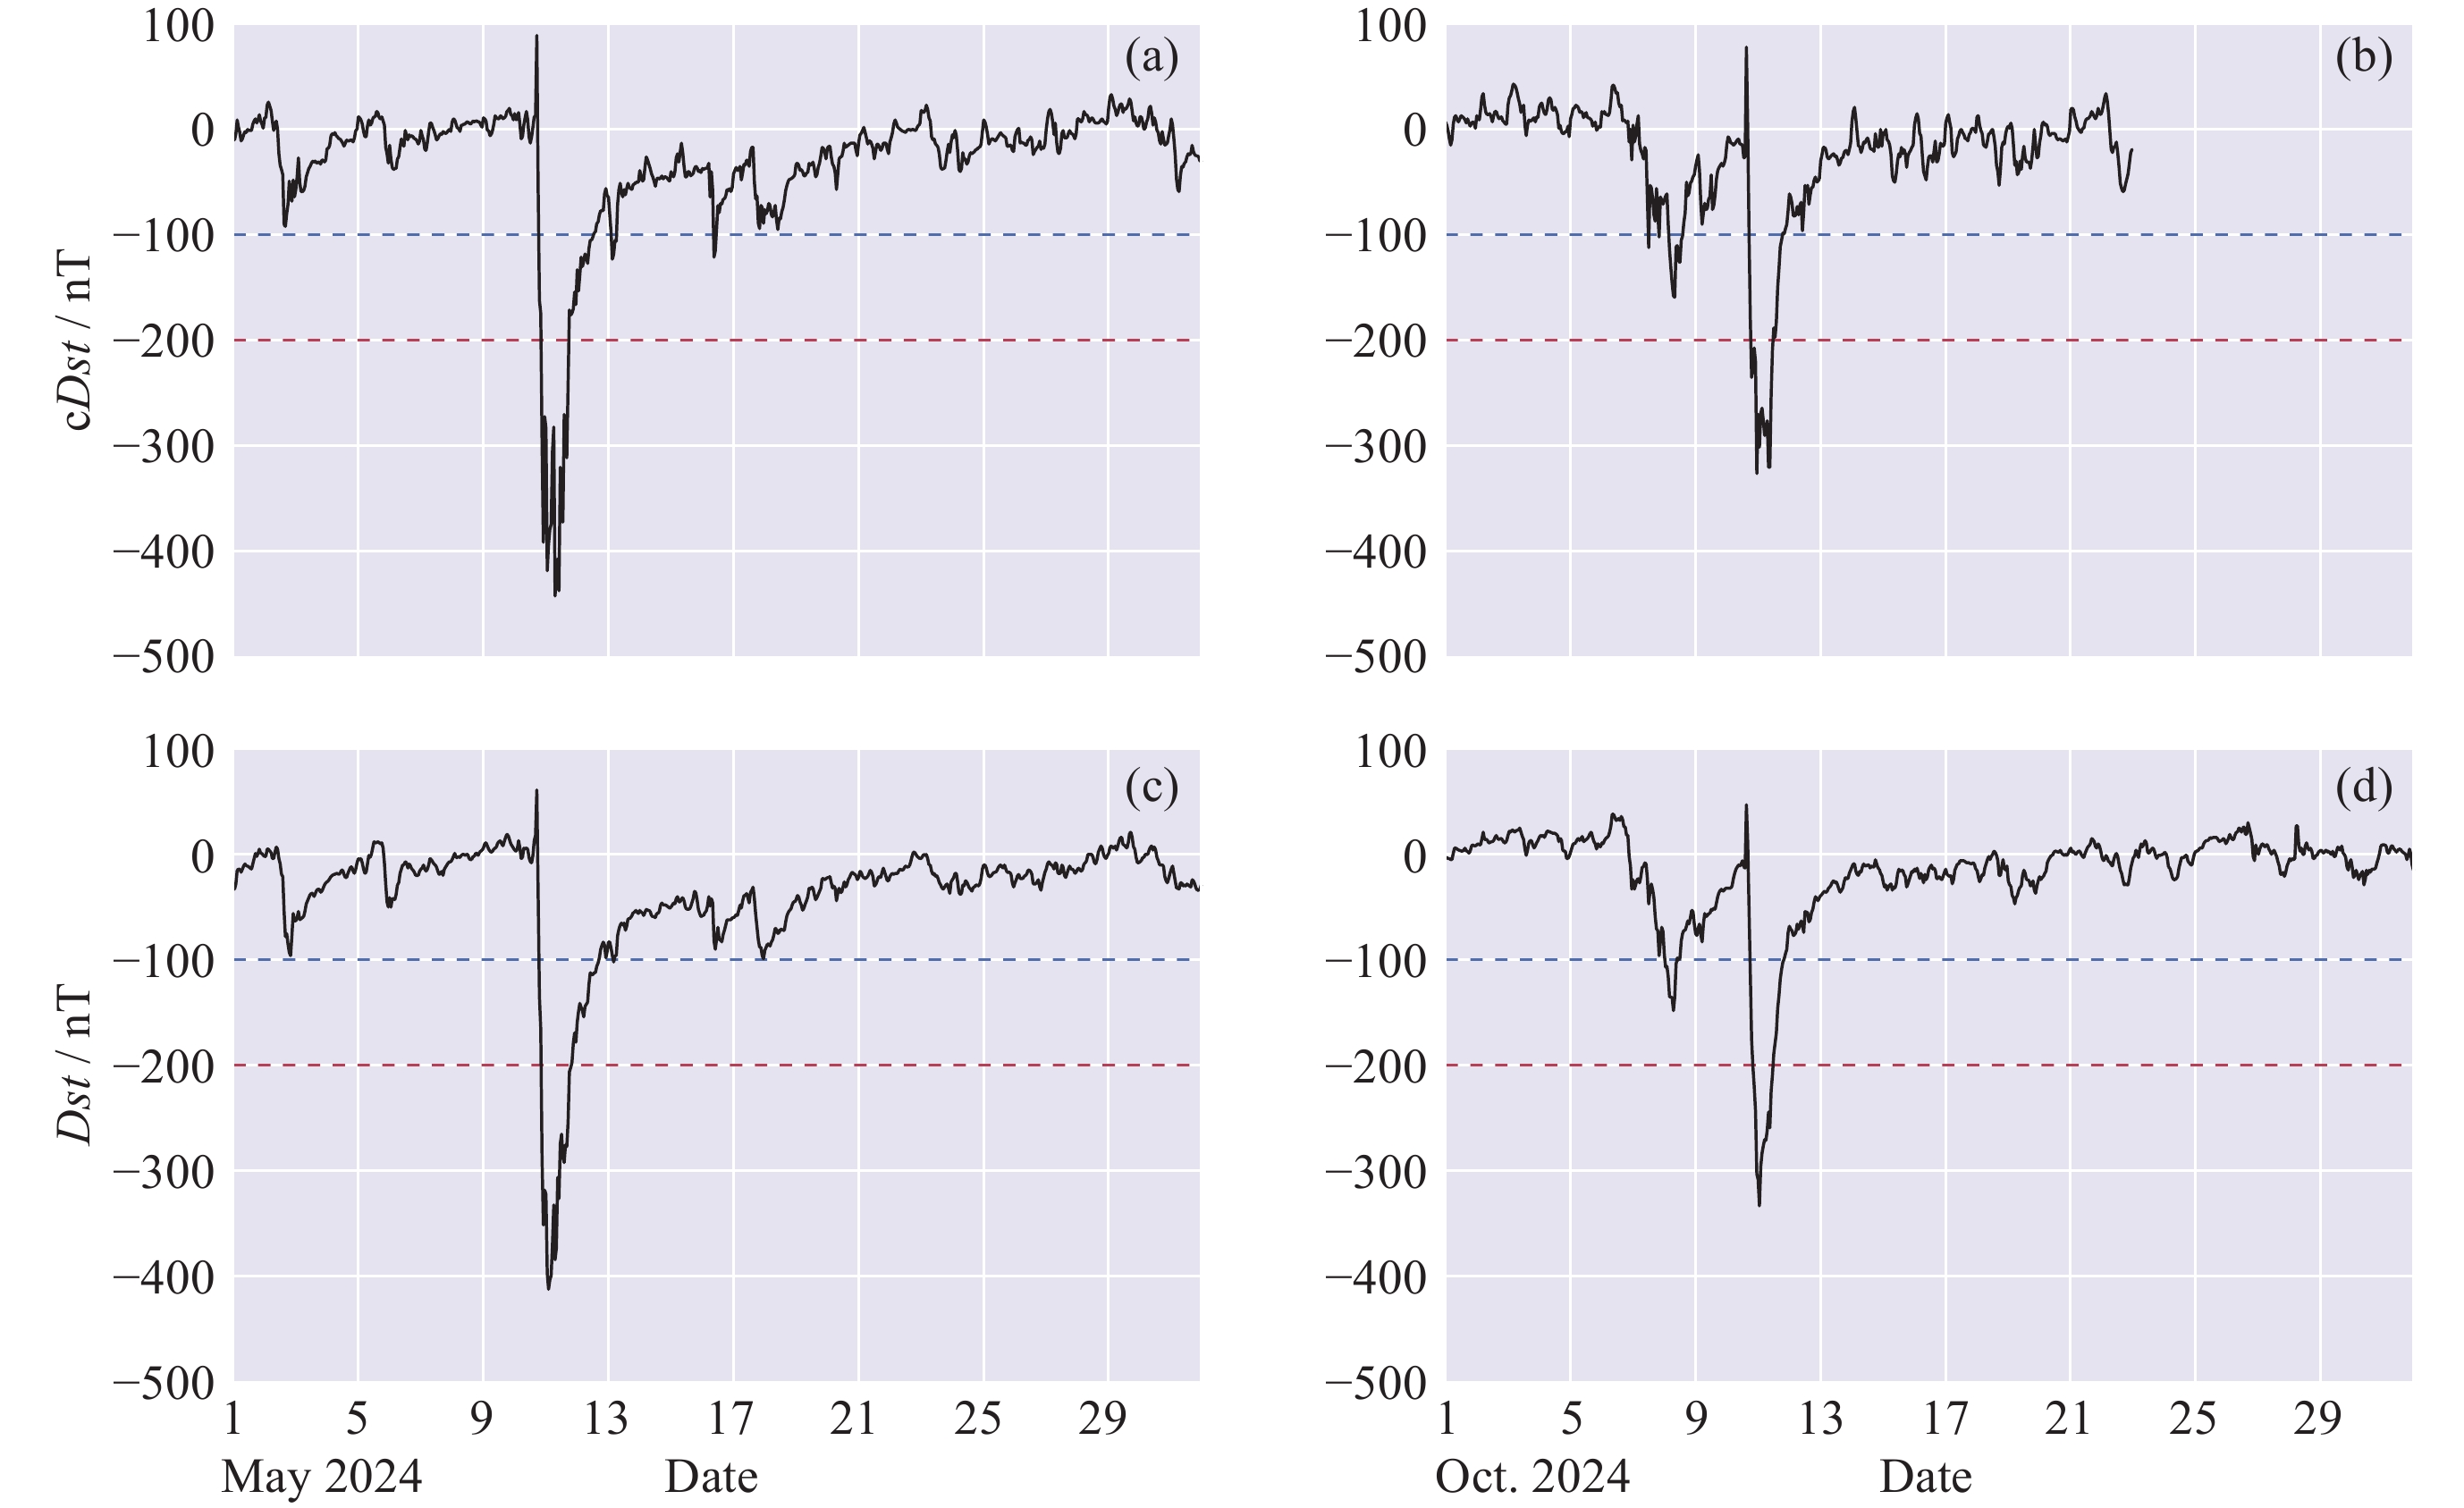
图 2 2024年5月和10月磁暴期间cDst指数和Dst指数的对比
Figure 2. Comparison of cDst index and Dst index during storms in May (a) and October (b) of 2024
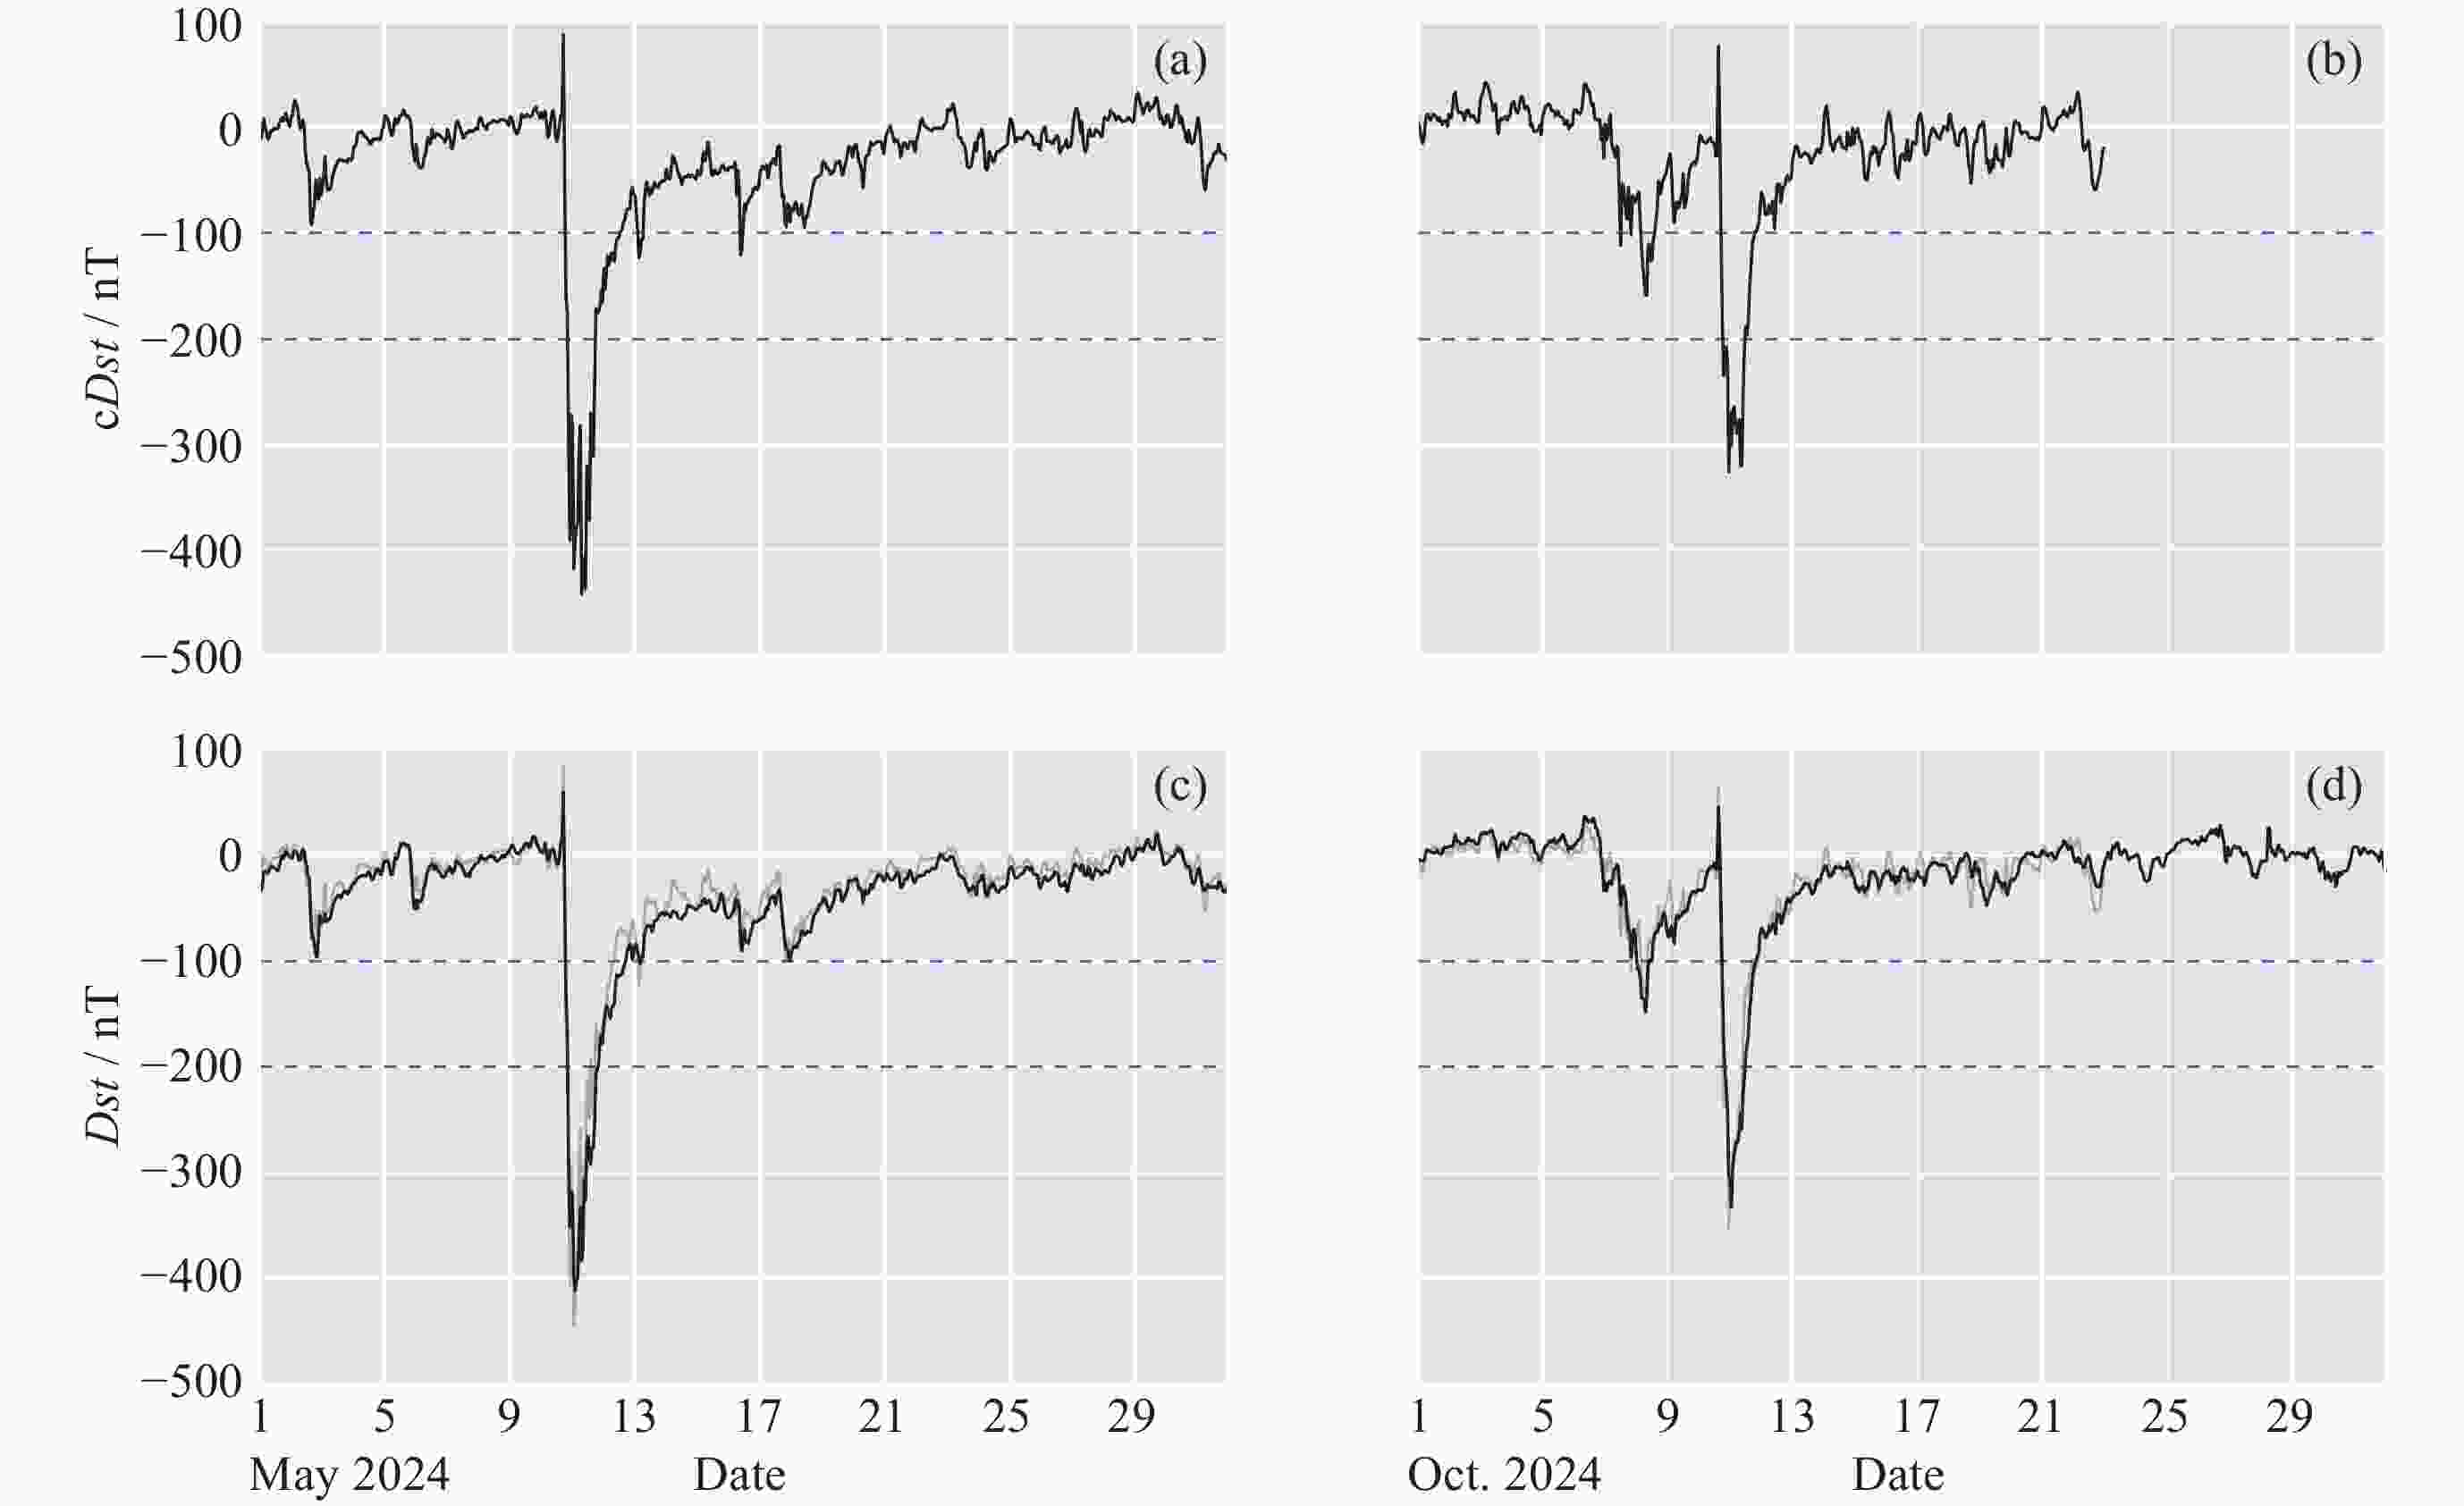
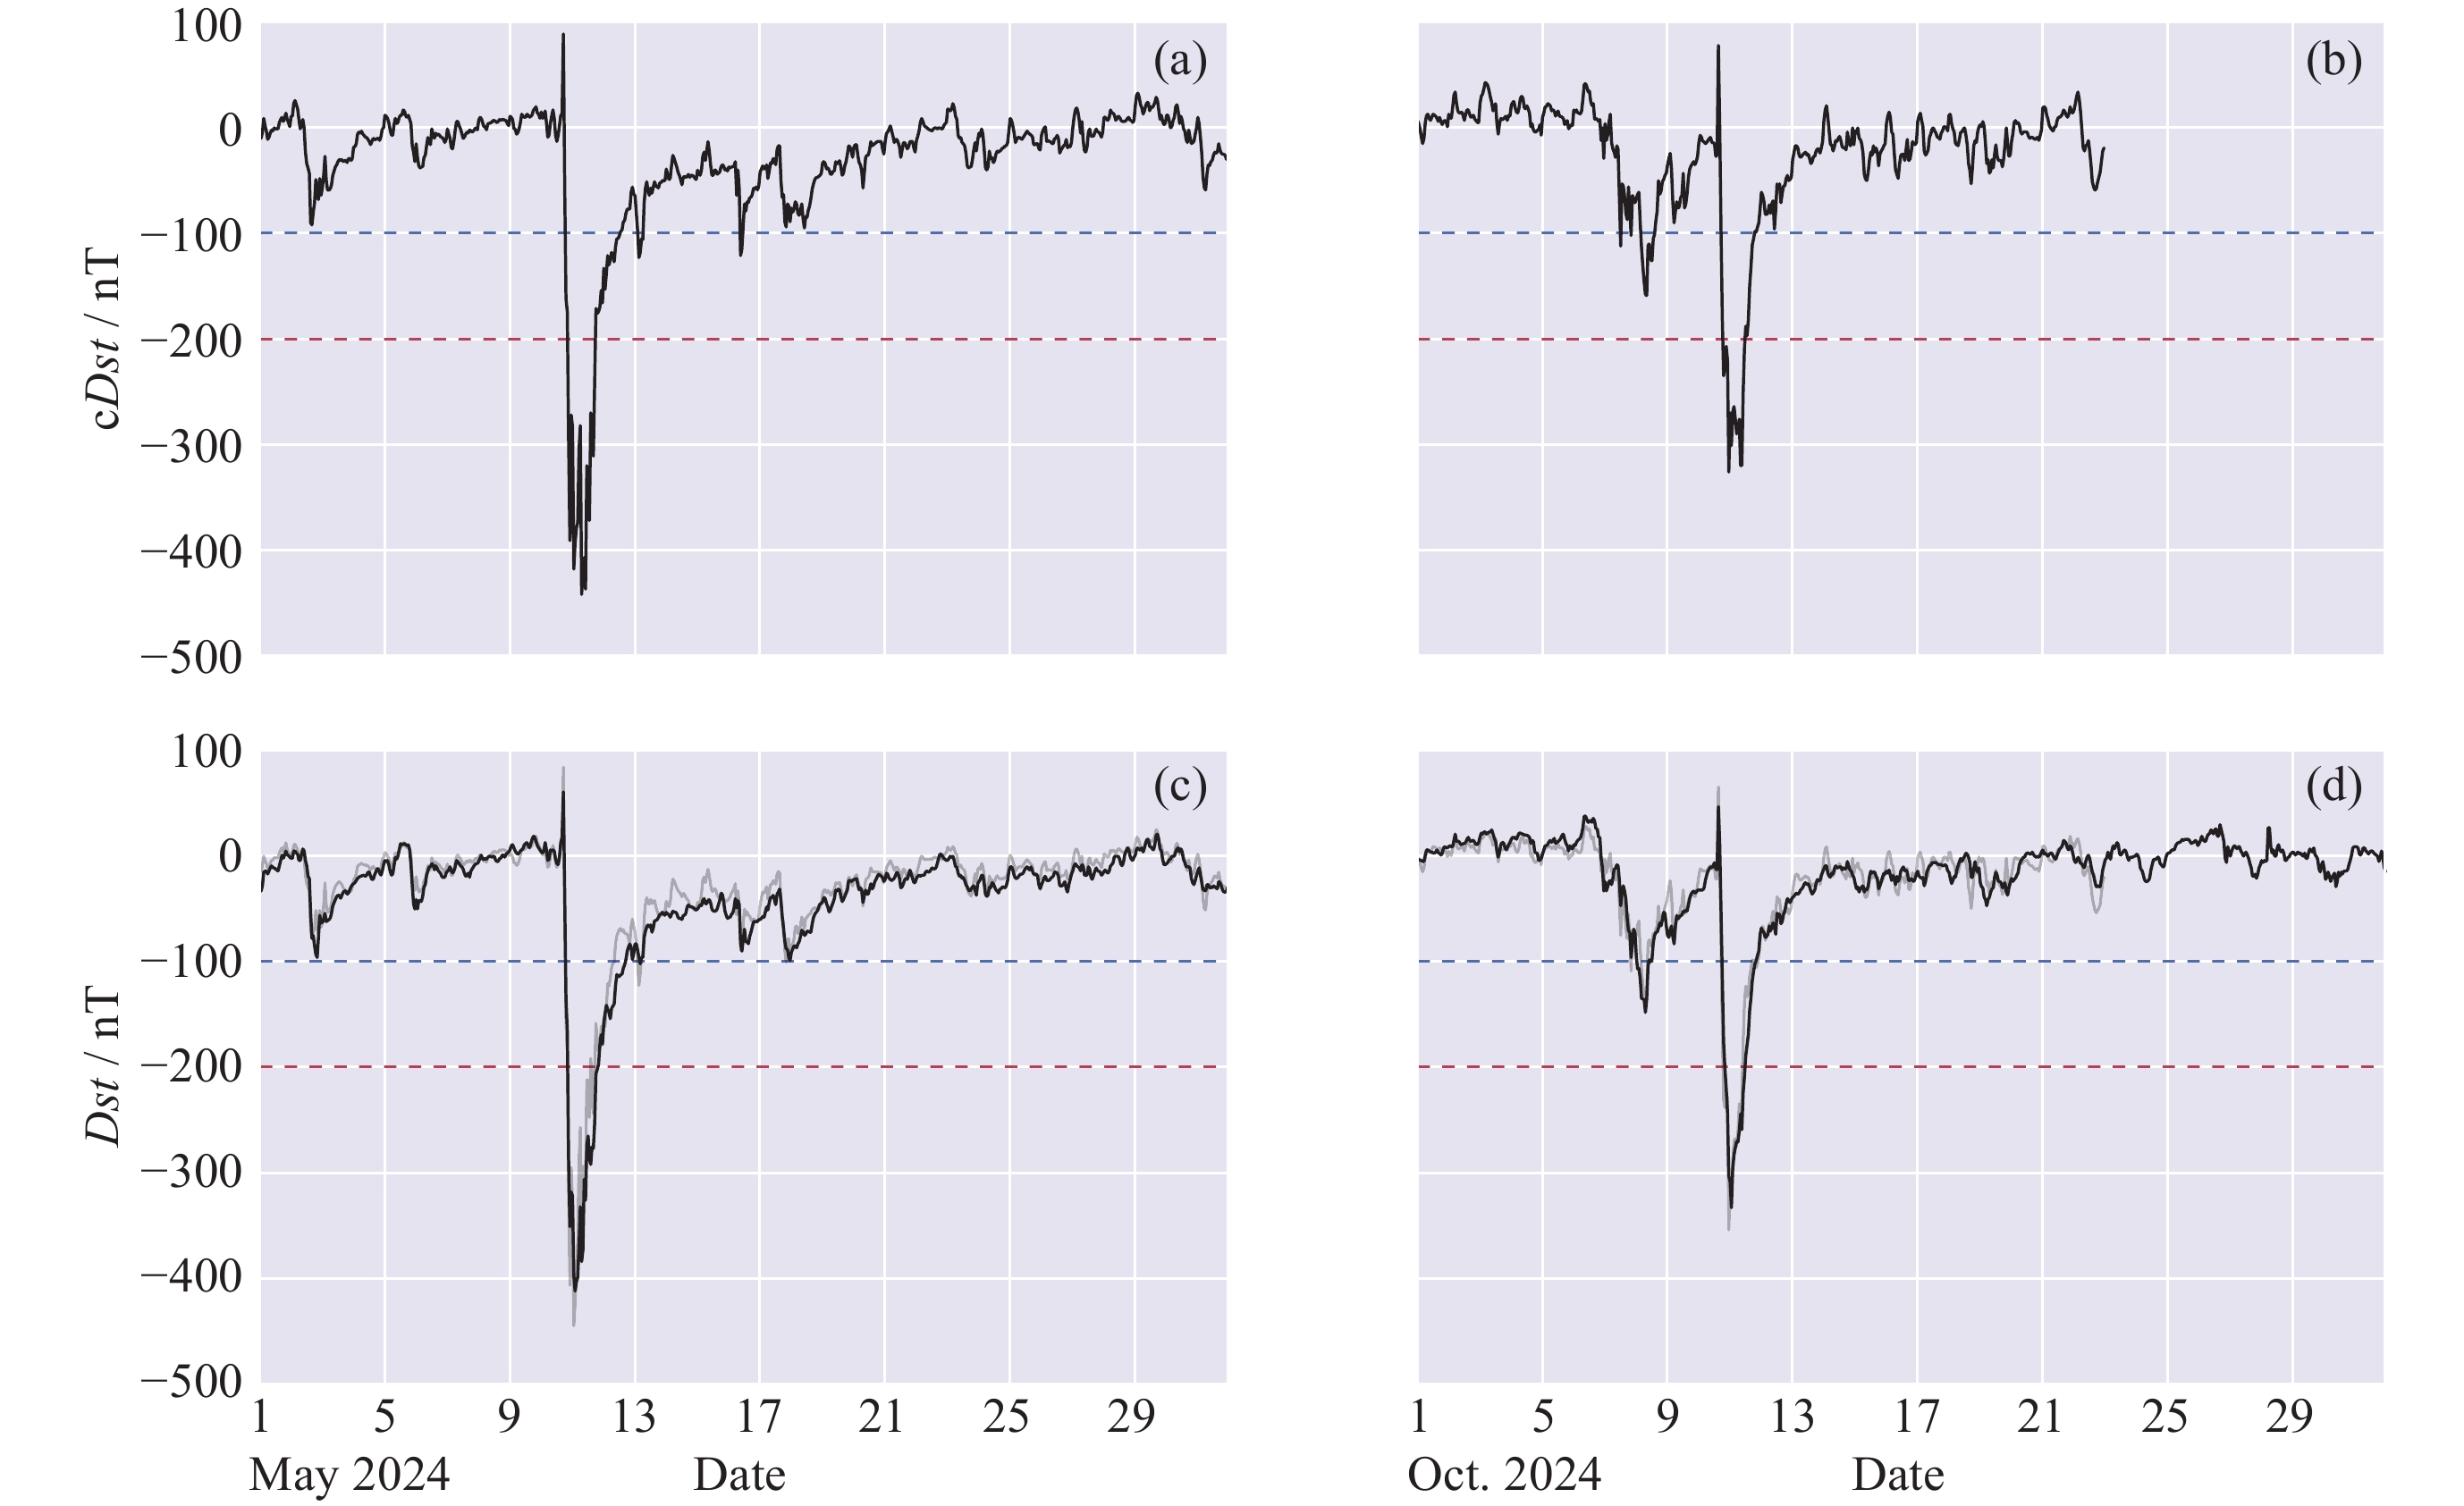
图 5 2024年5月和10月磁暴期间cDst指数和Dst指数与fDst值的对比
Figure 5. Comparison of cDst index, Dst index, and fDst values during storms in May and October of 2024
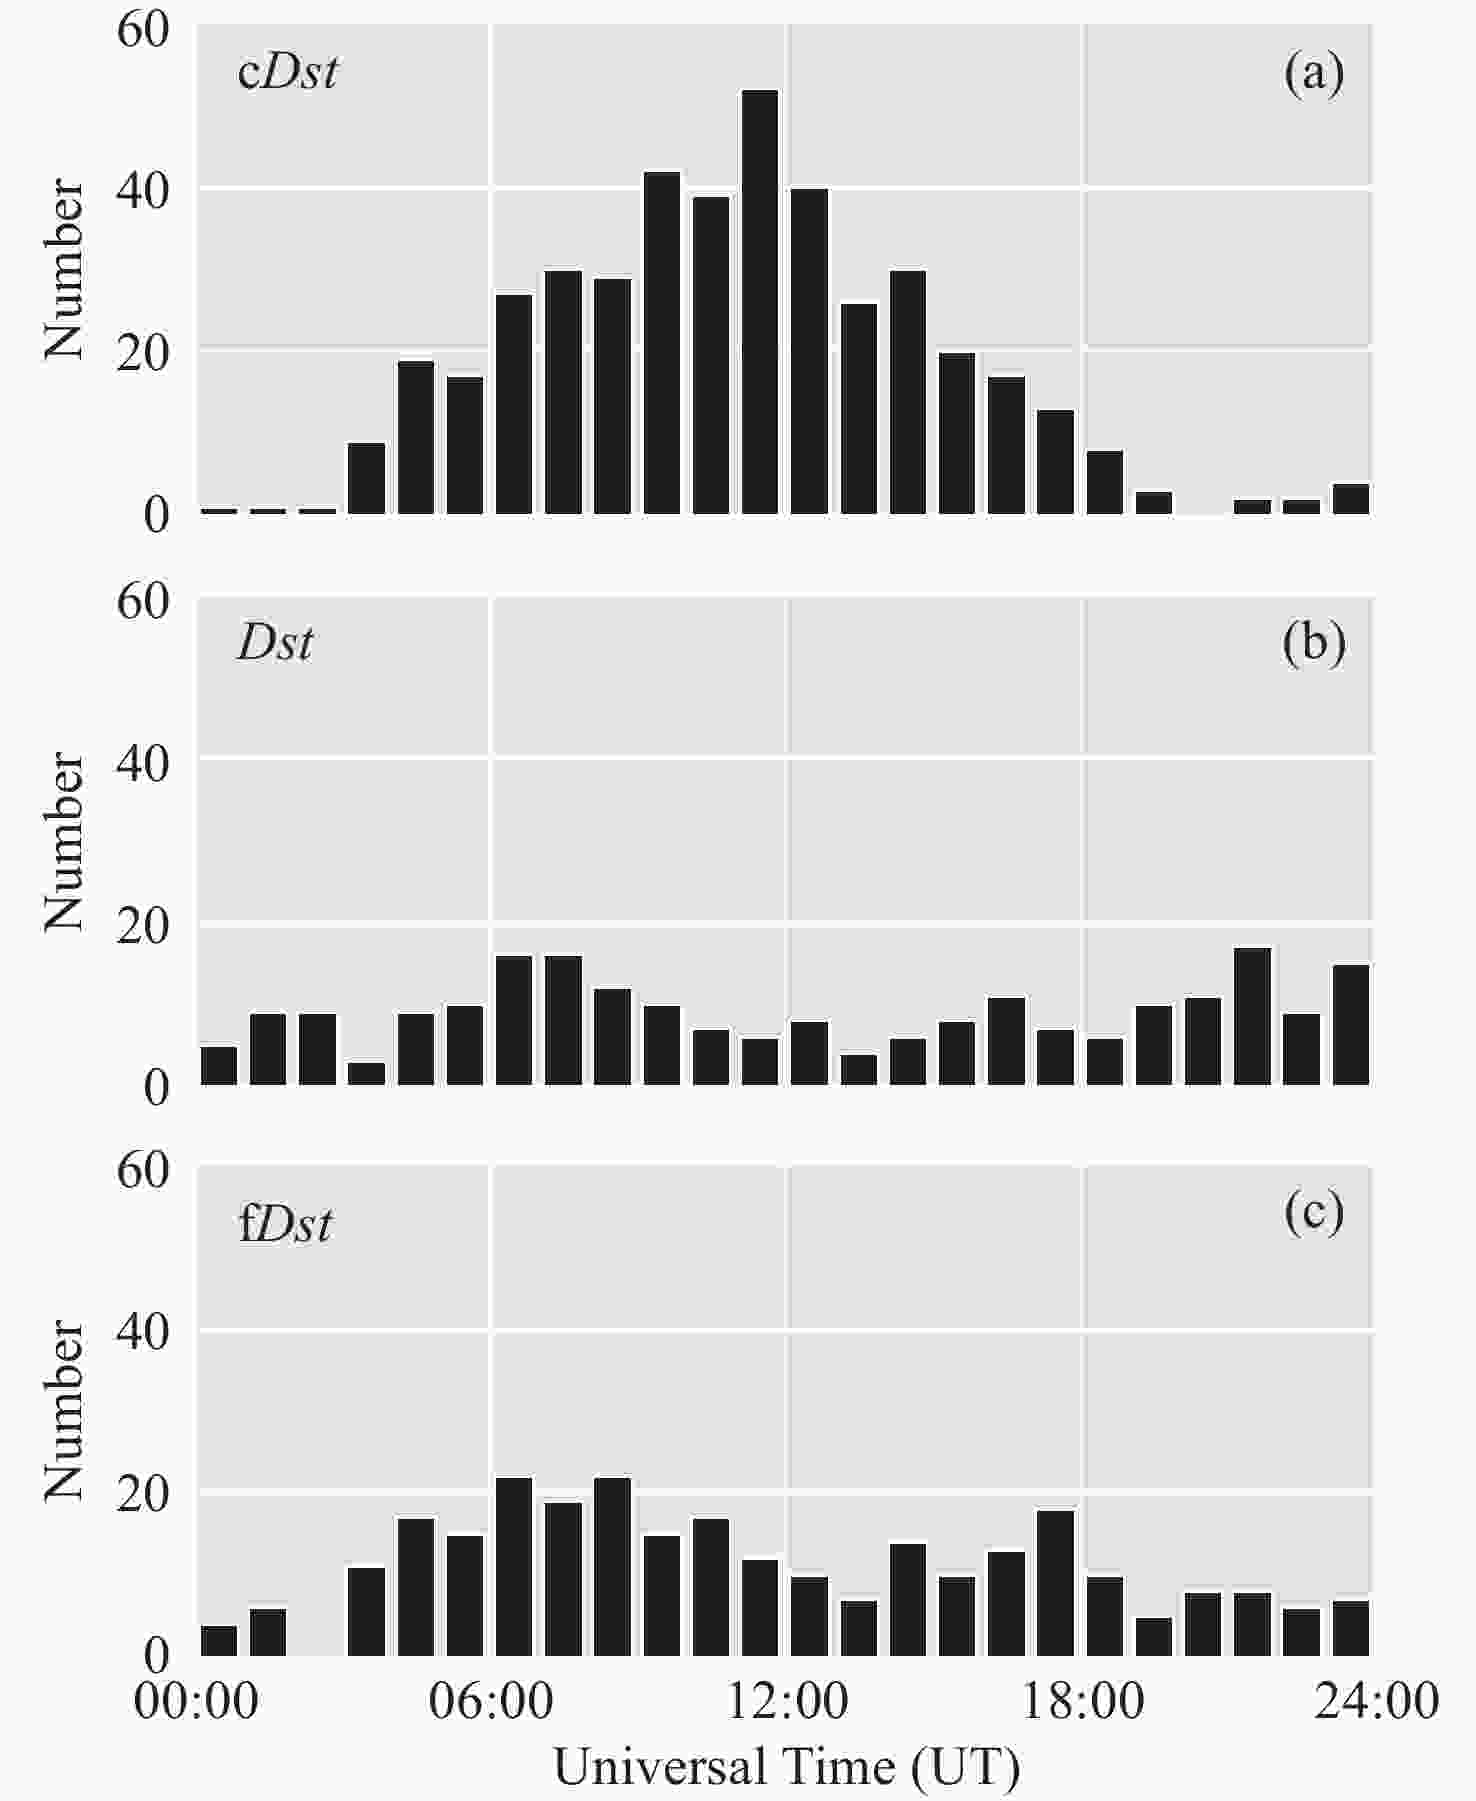
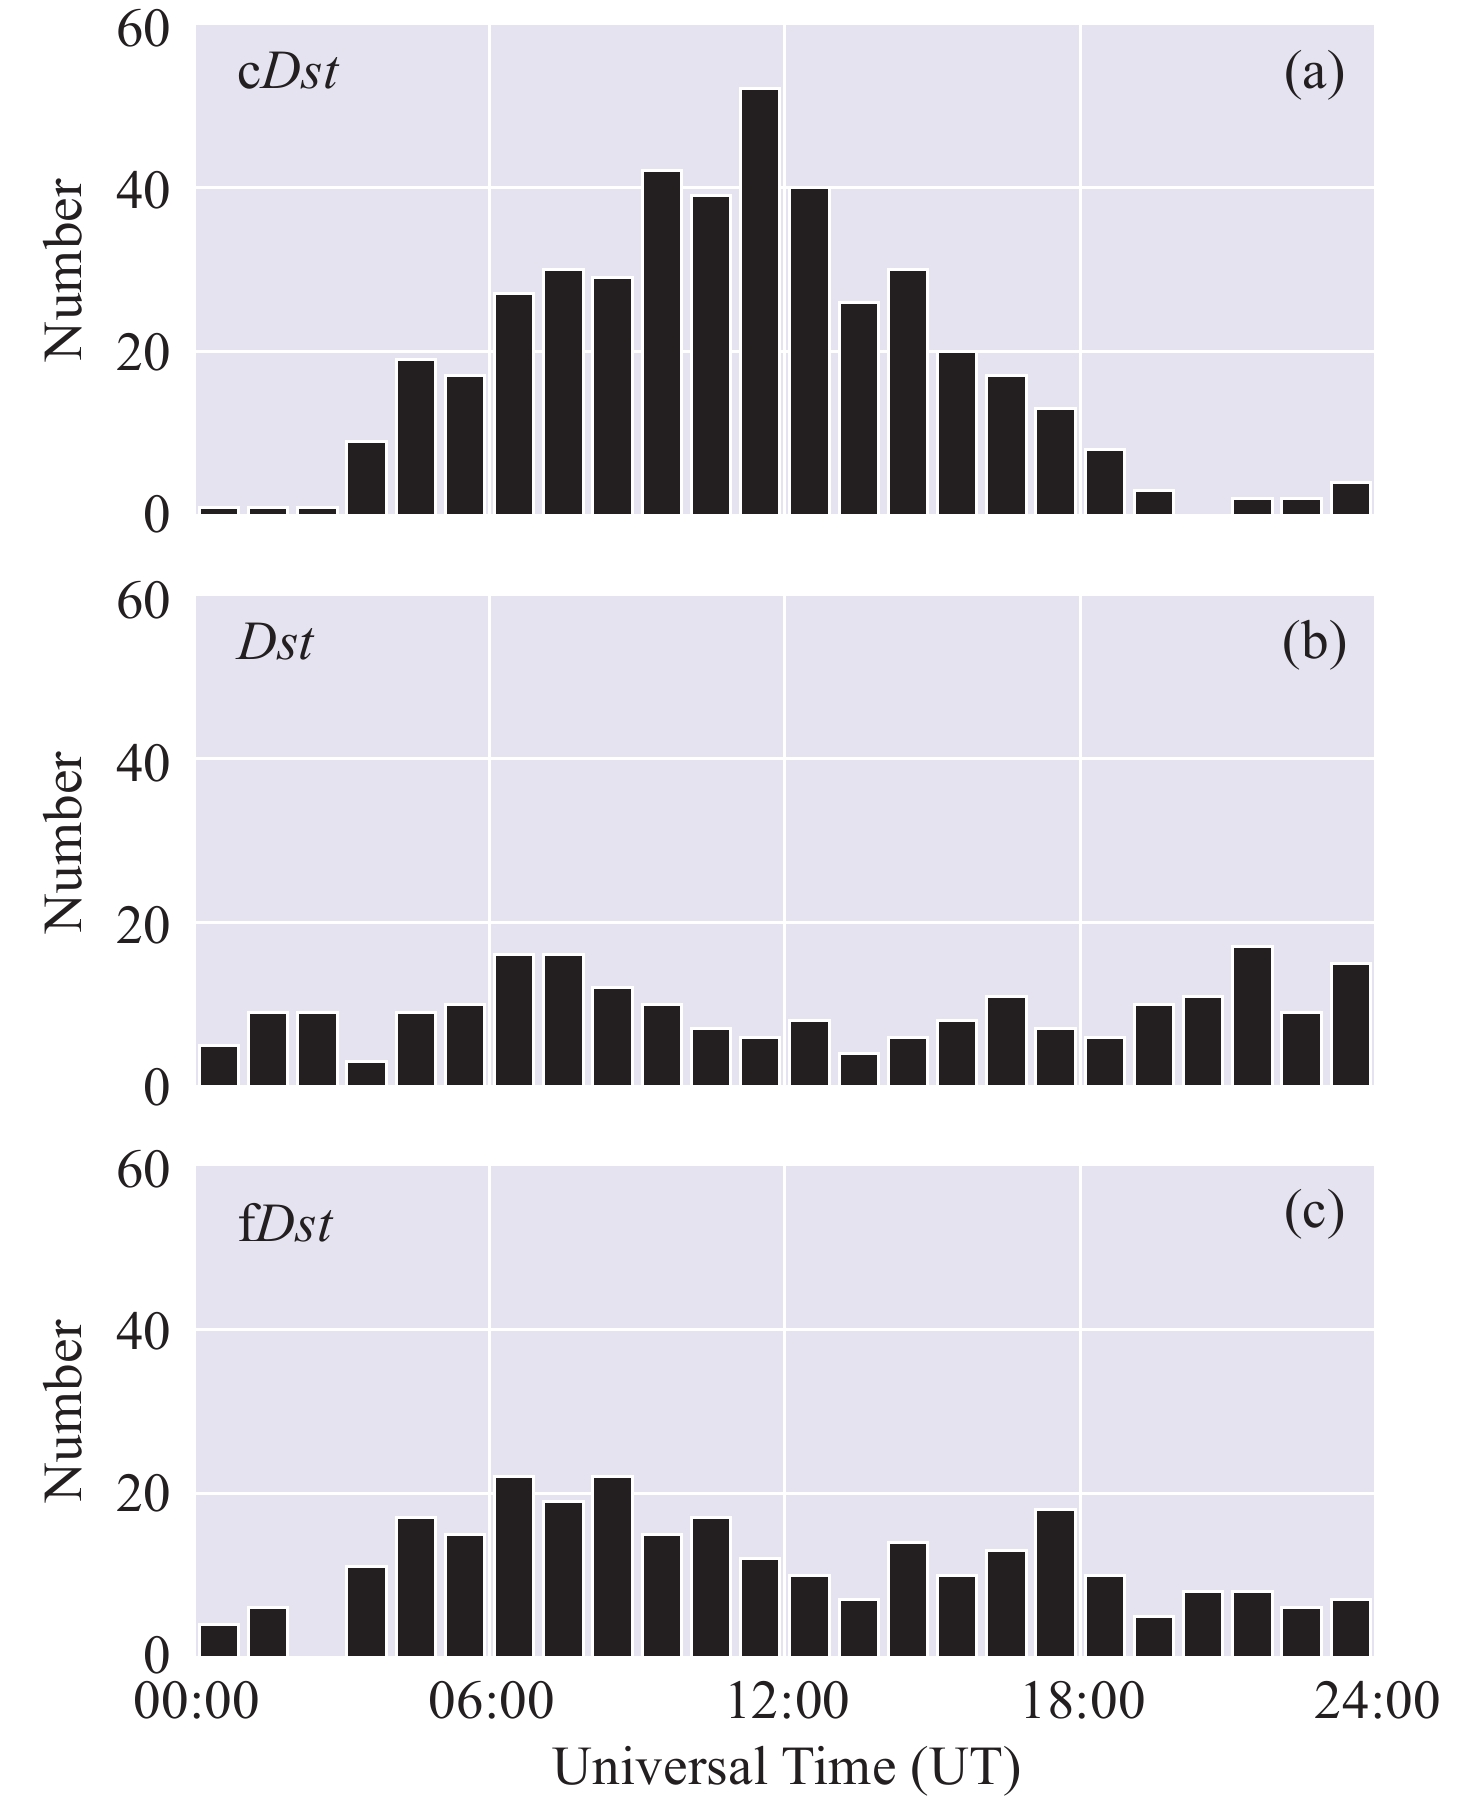
图 6 中国区域磁扰数量(a)、磁暴数量(b)和fDst值判断得到的磁暴数量(c)随世界时的分布
Figure 6. Distribution of the number of Chinese geomagnetic disturbances (a), storms (b), and storms determined by fDst values (c) with UT
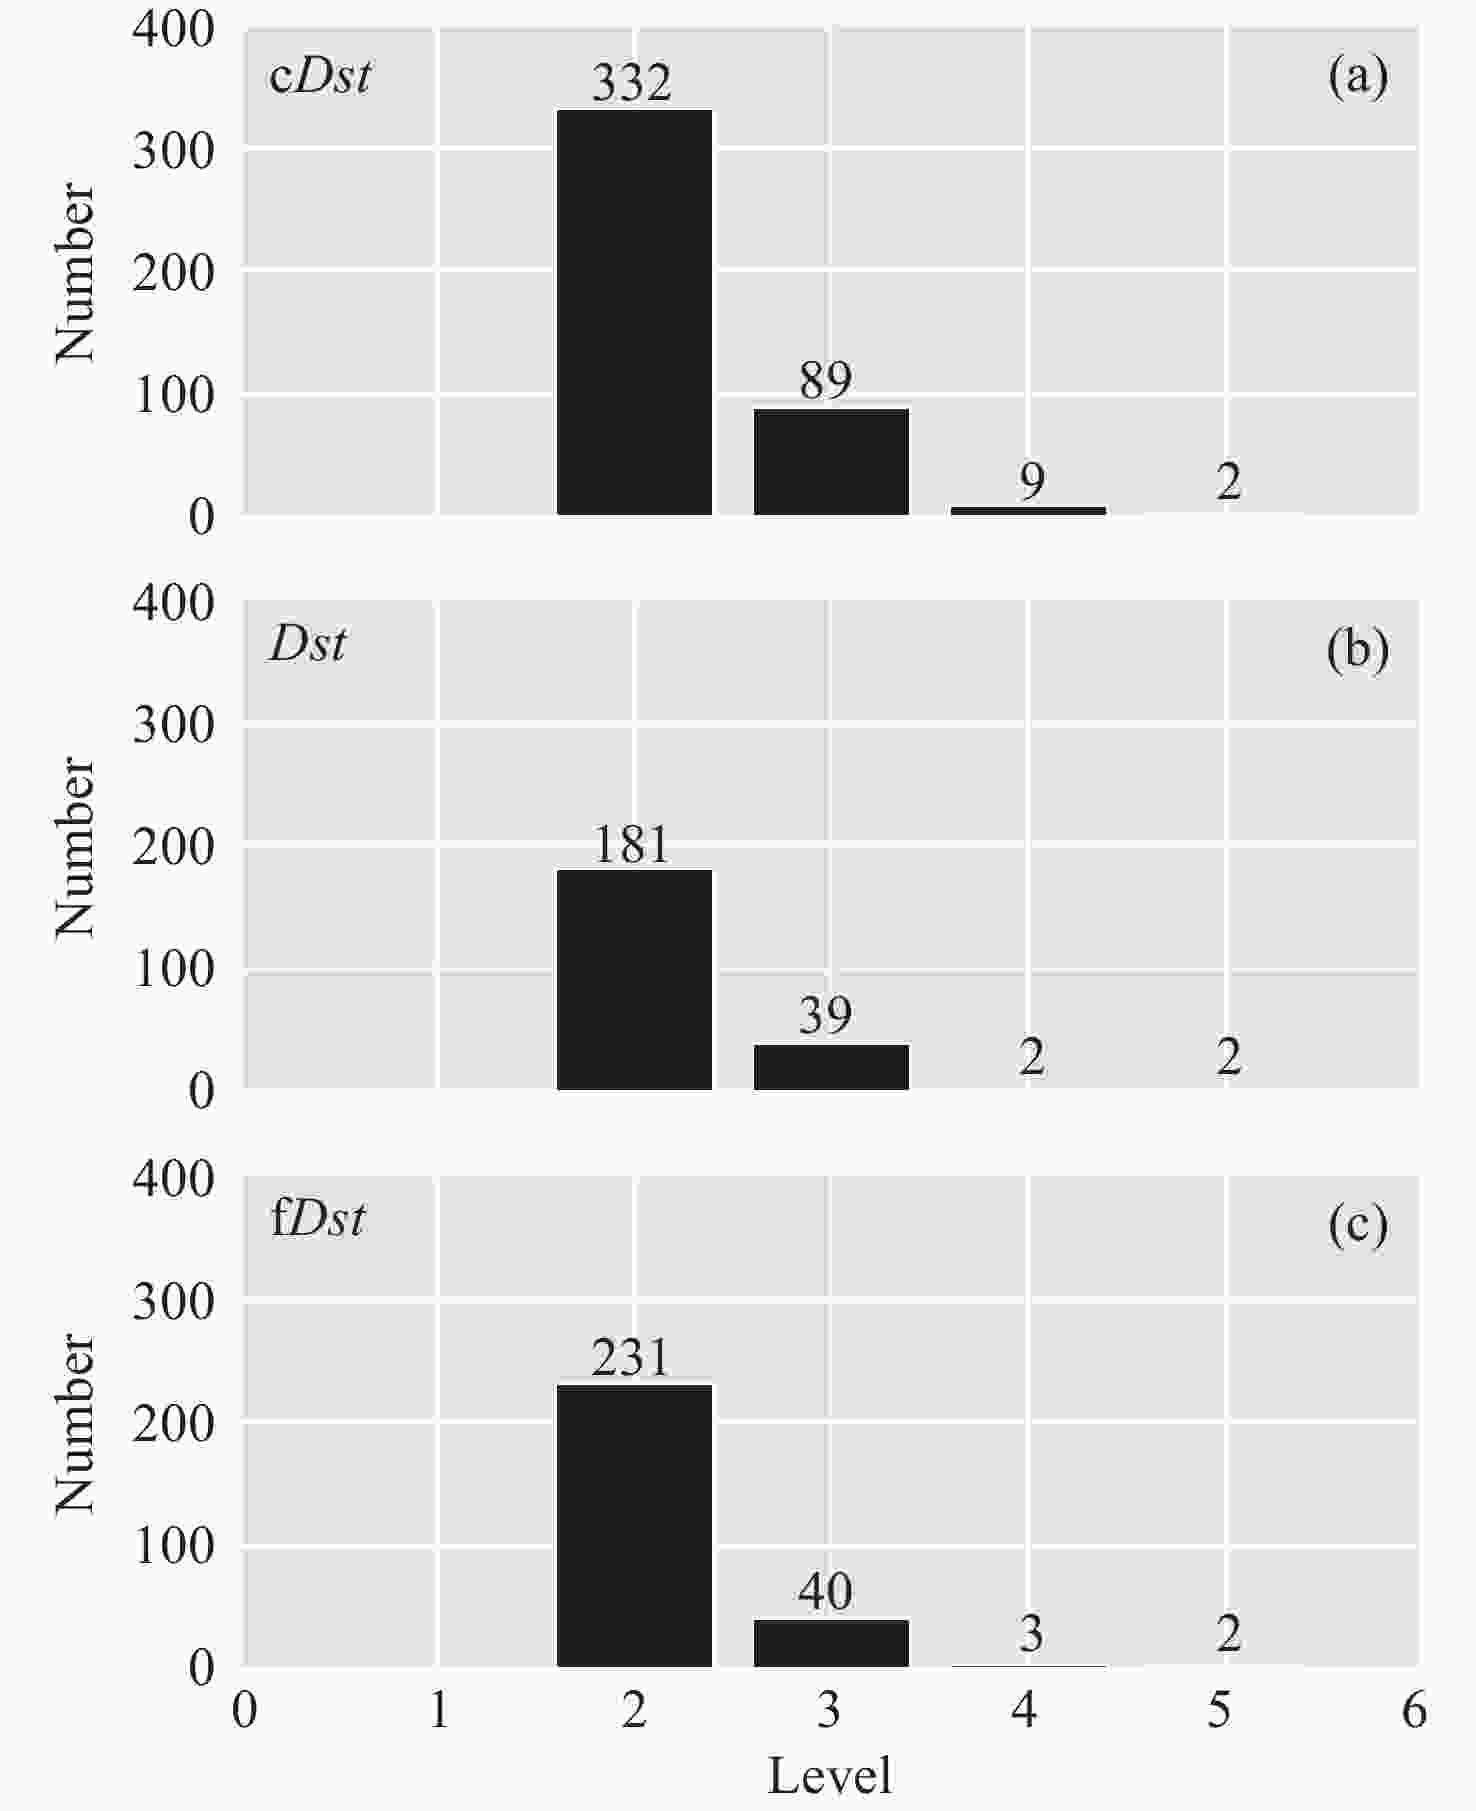
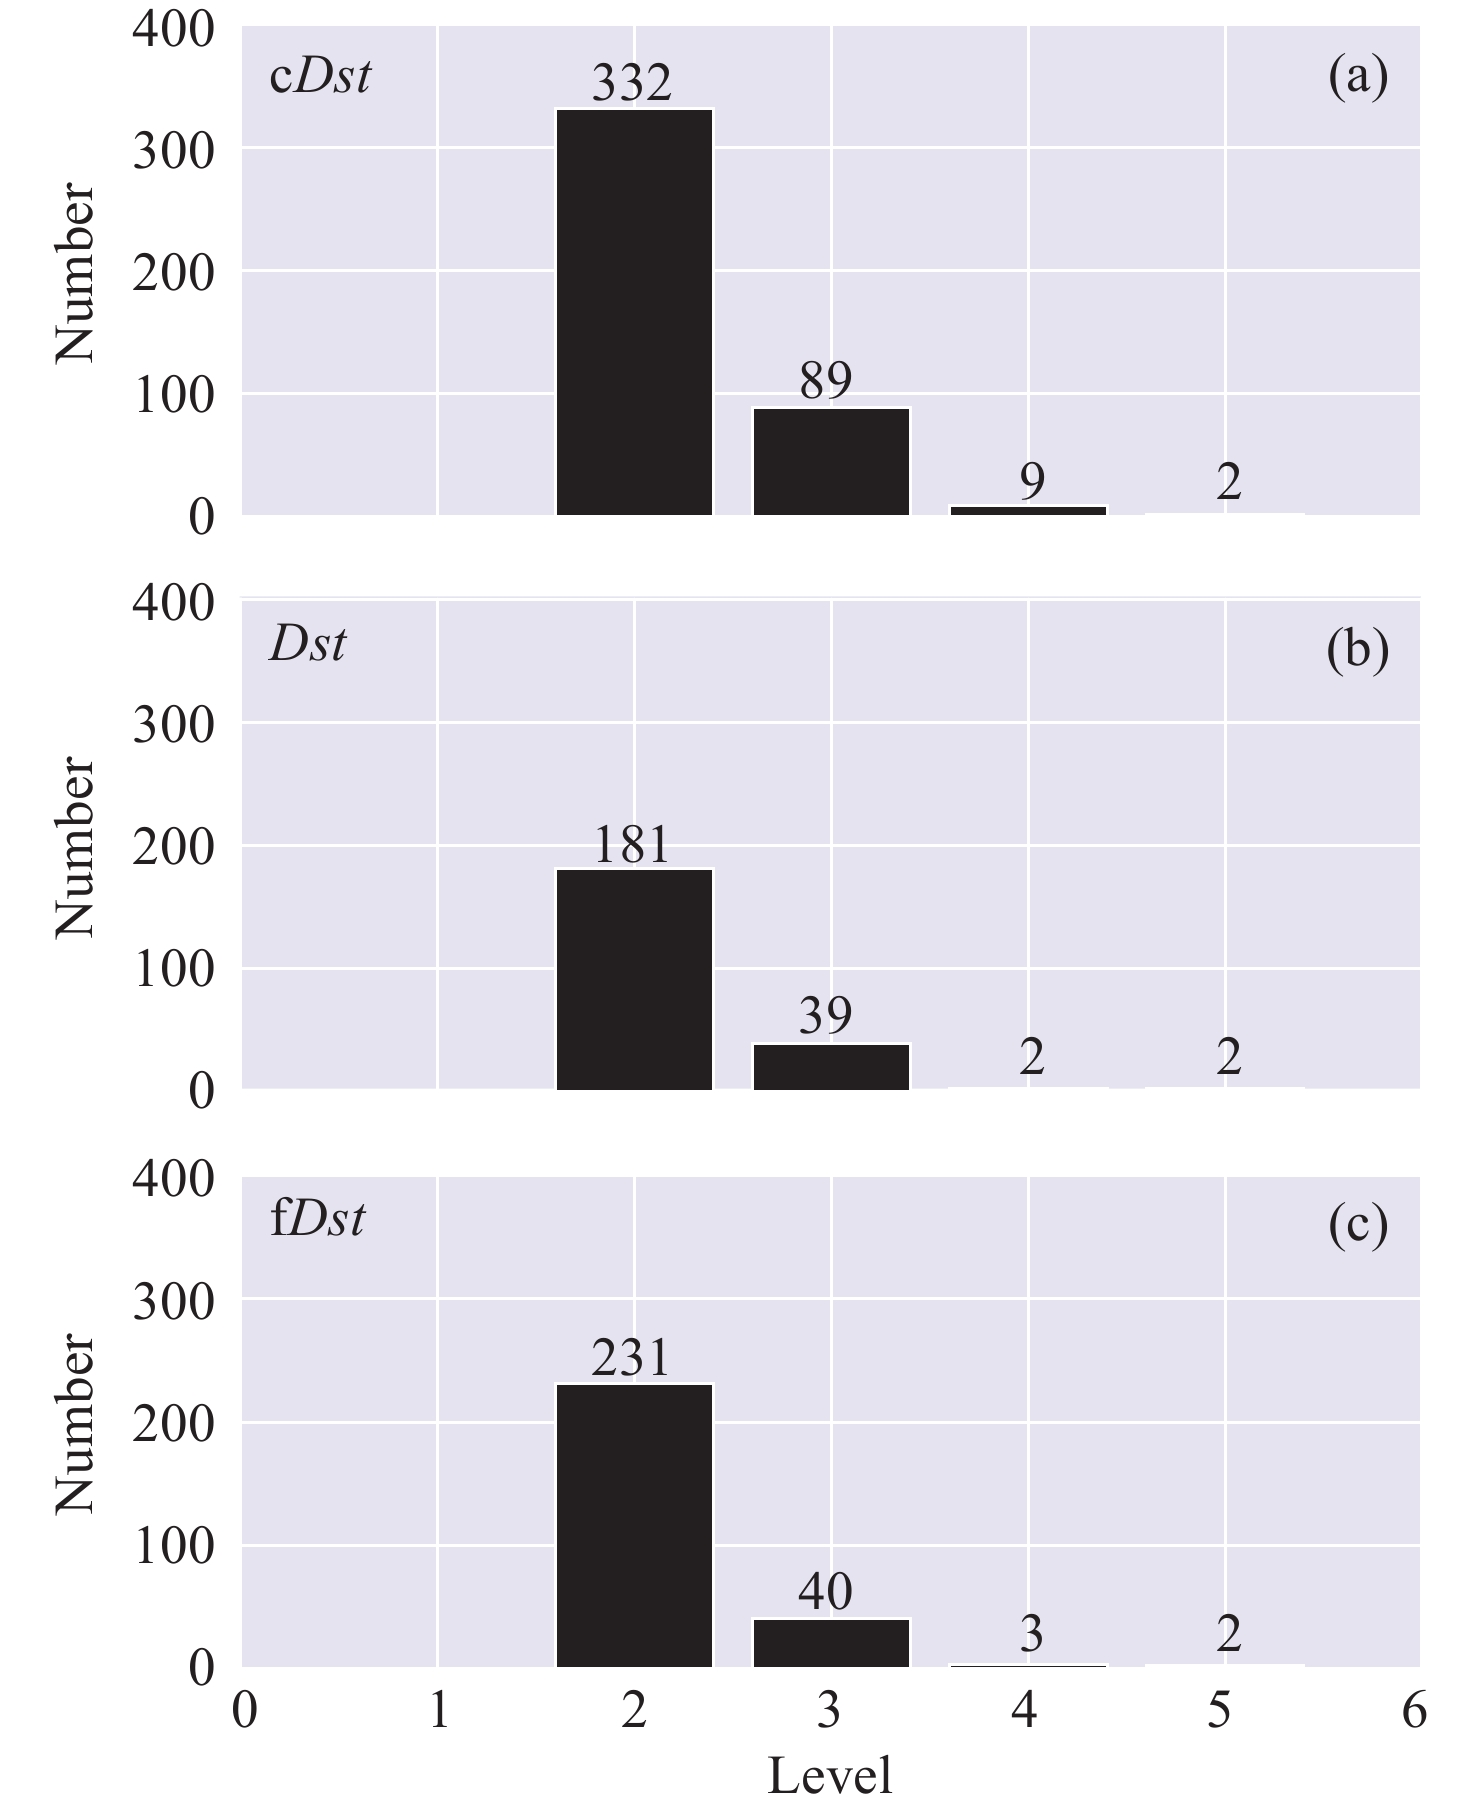
图 7 中国区域磁扰数量(a)、磁暴数量(b)和fDst值判断得到的磁暴数量(c)随等级的分布
Figure 7. Distribution of the number of Chinese geomagnetic disturbances (a), storms (b), and storms determined by fDst values (c) with level
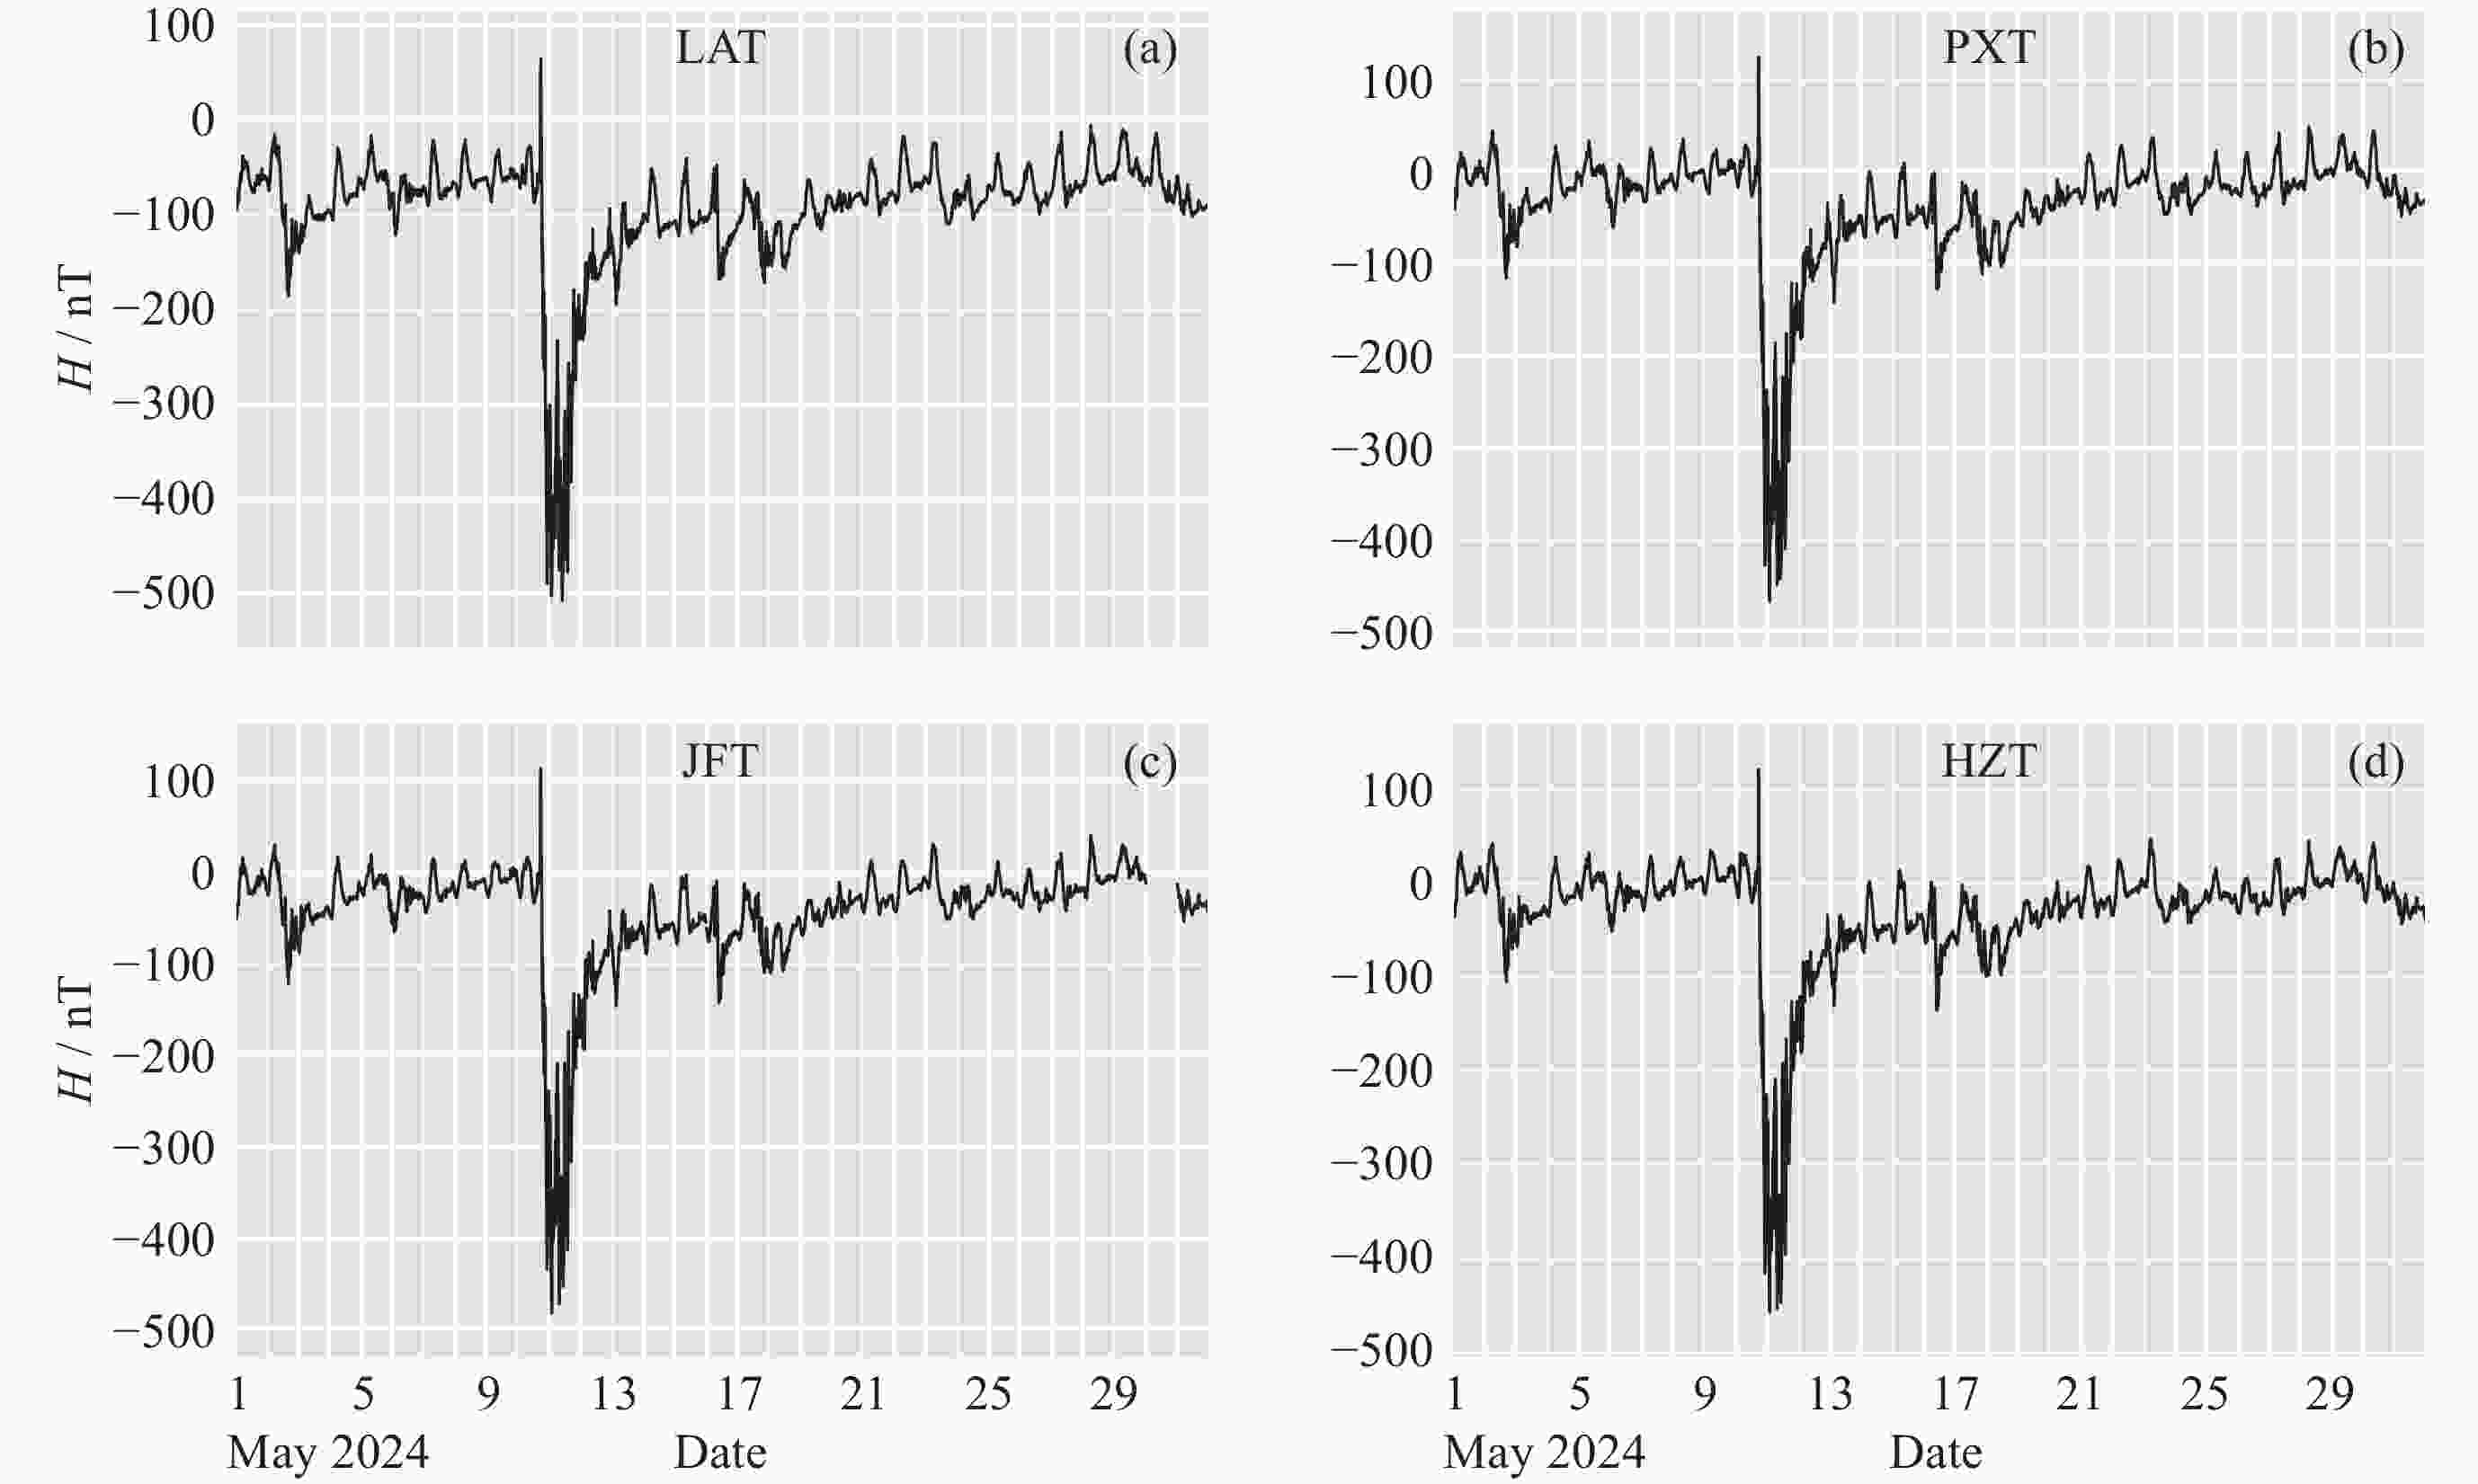
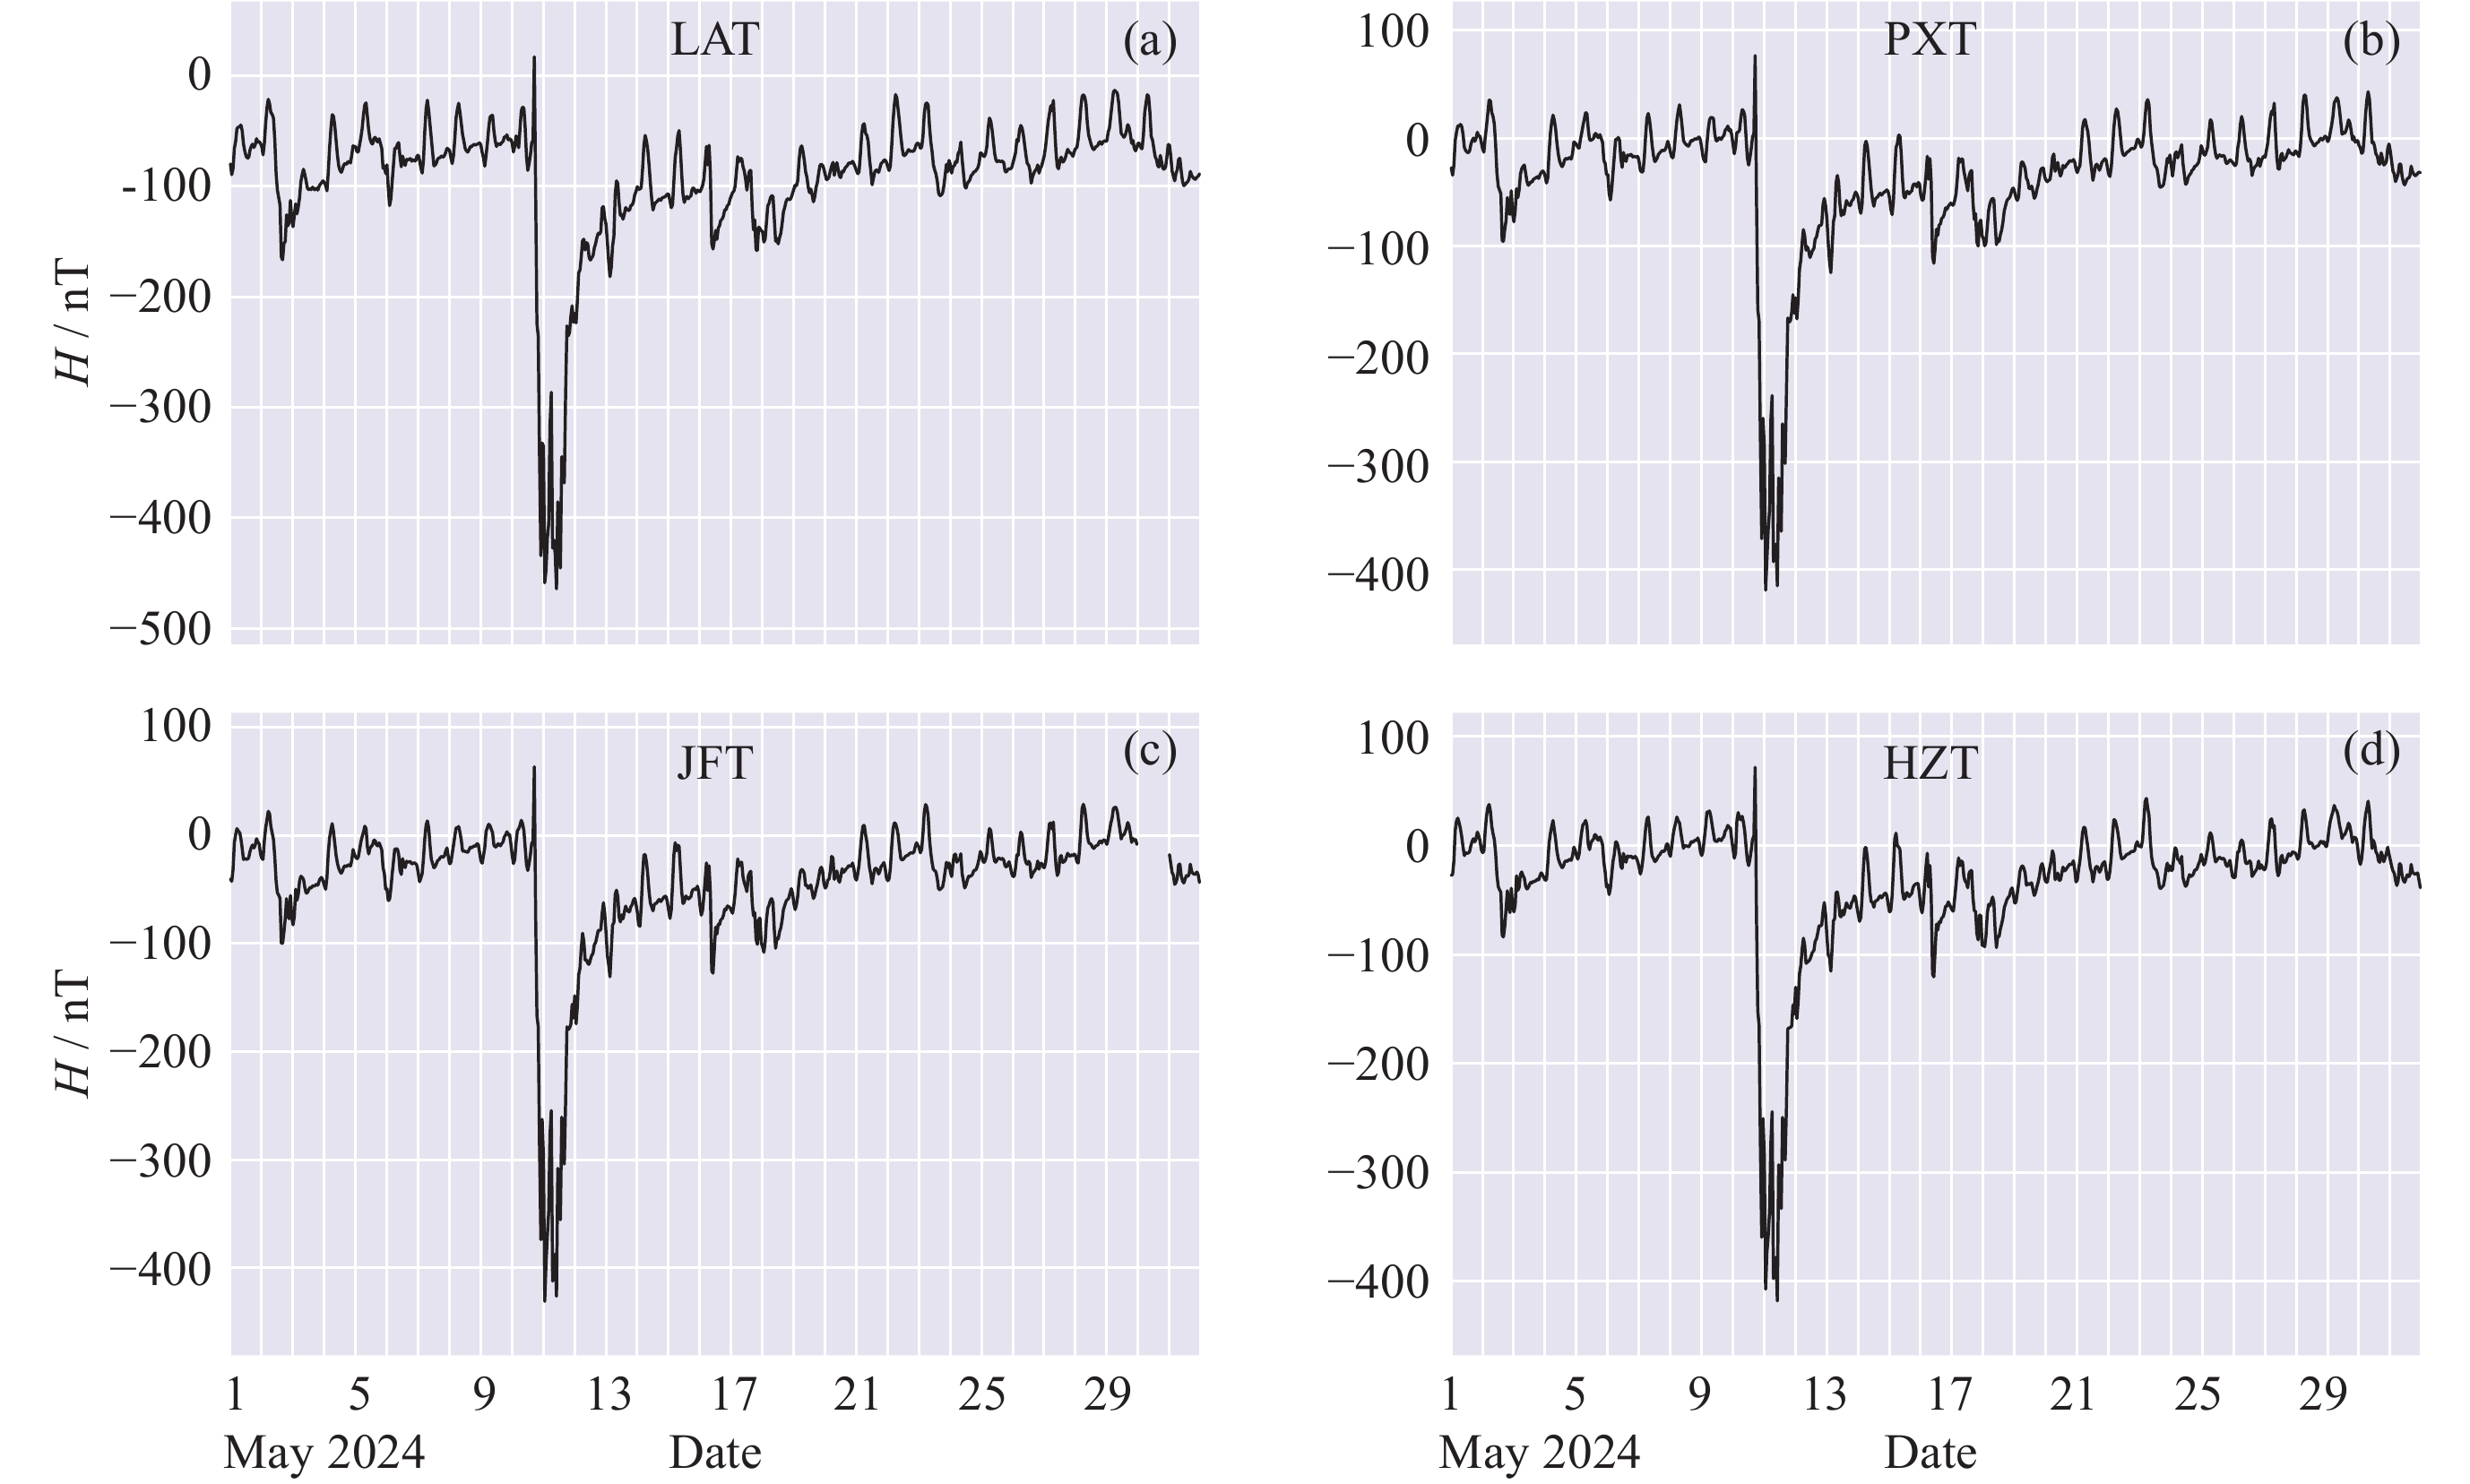
图 8 2024年5月4个站点的地磁H分量
Figure 8. Geomagnetic H component of 4 observatories in May 2024
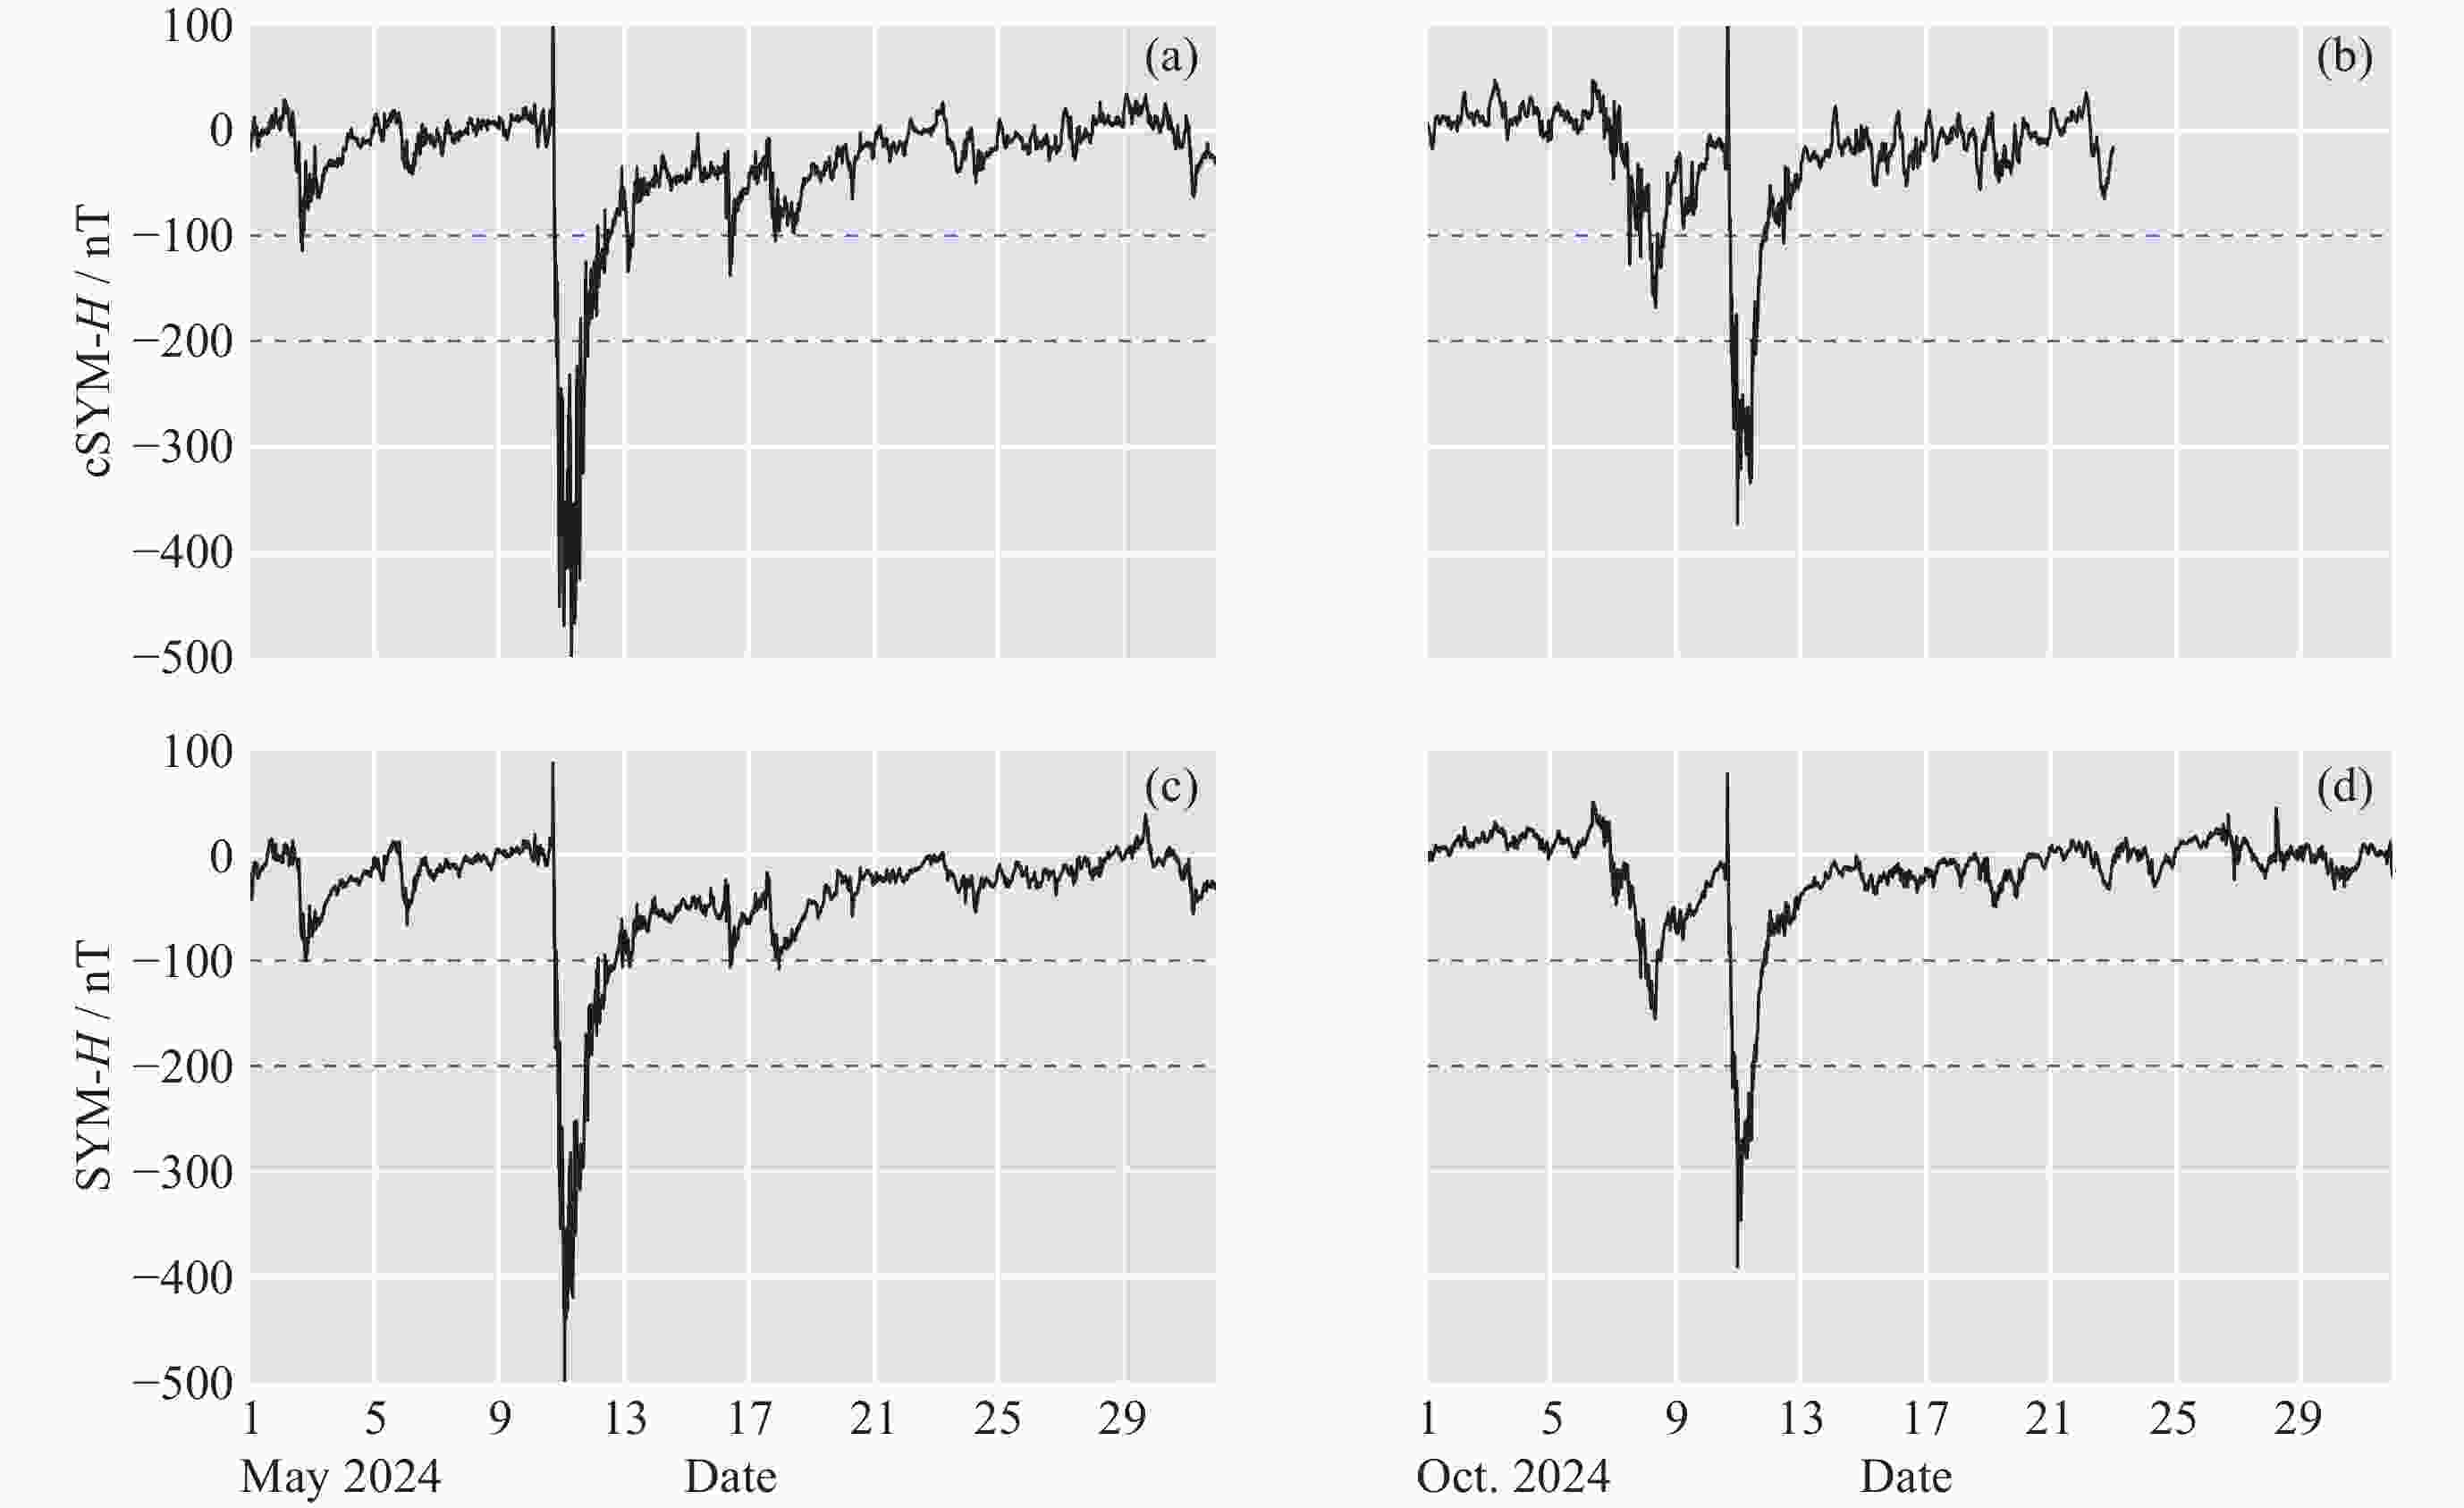
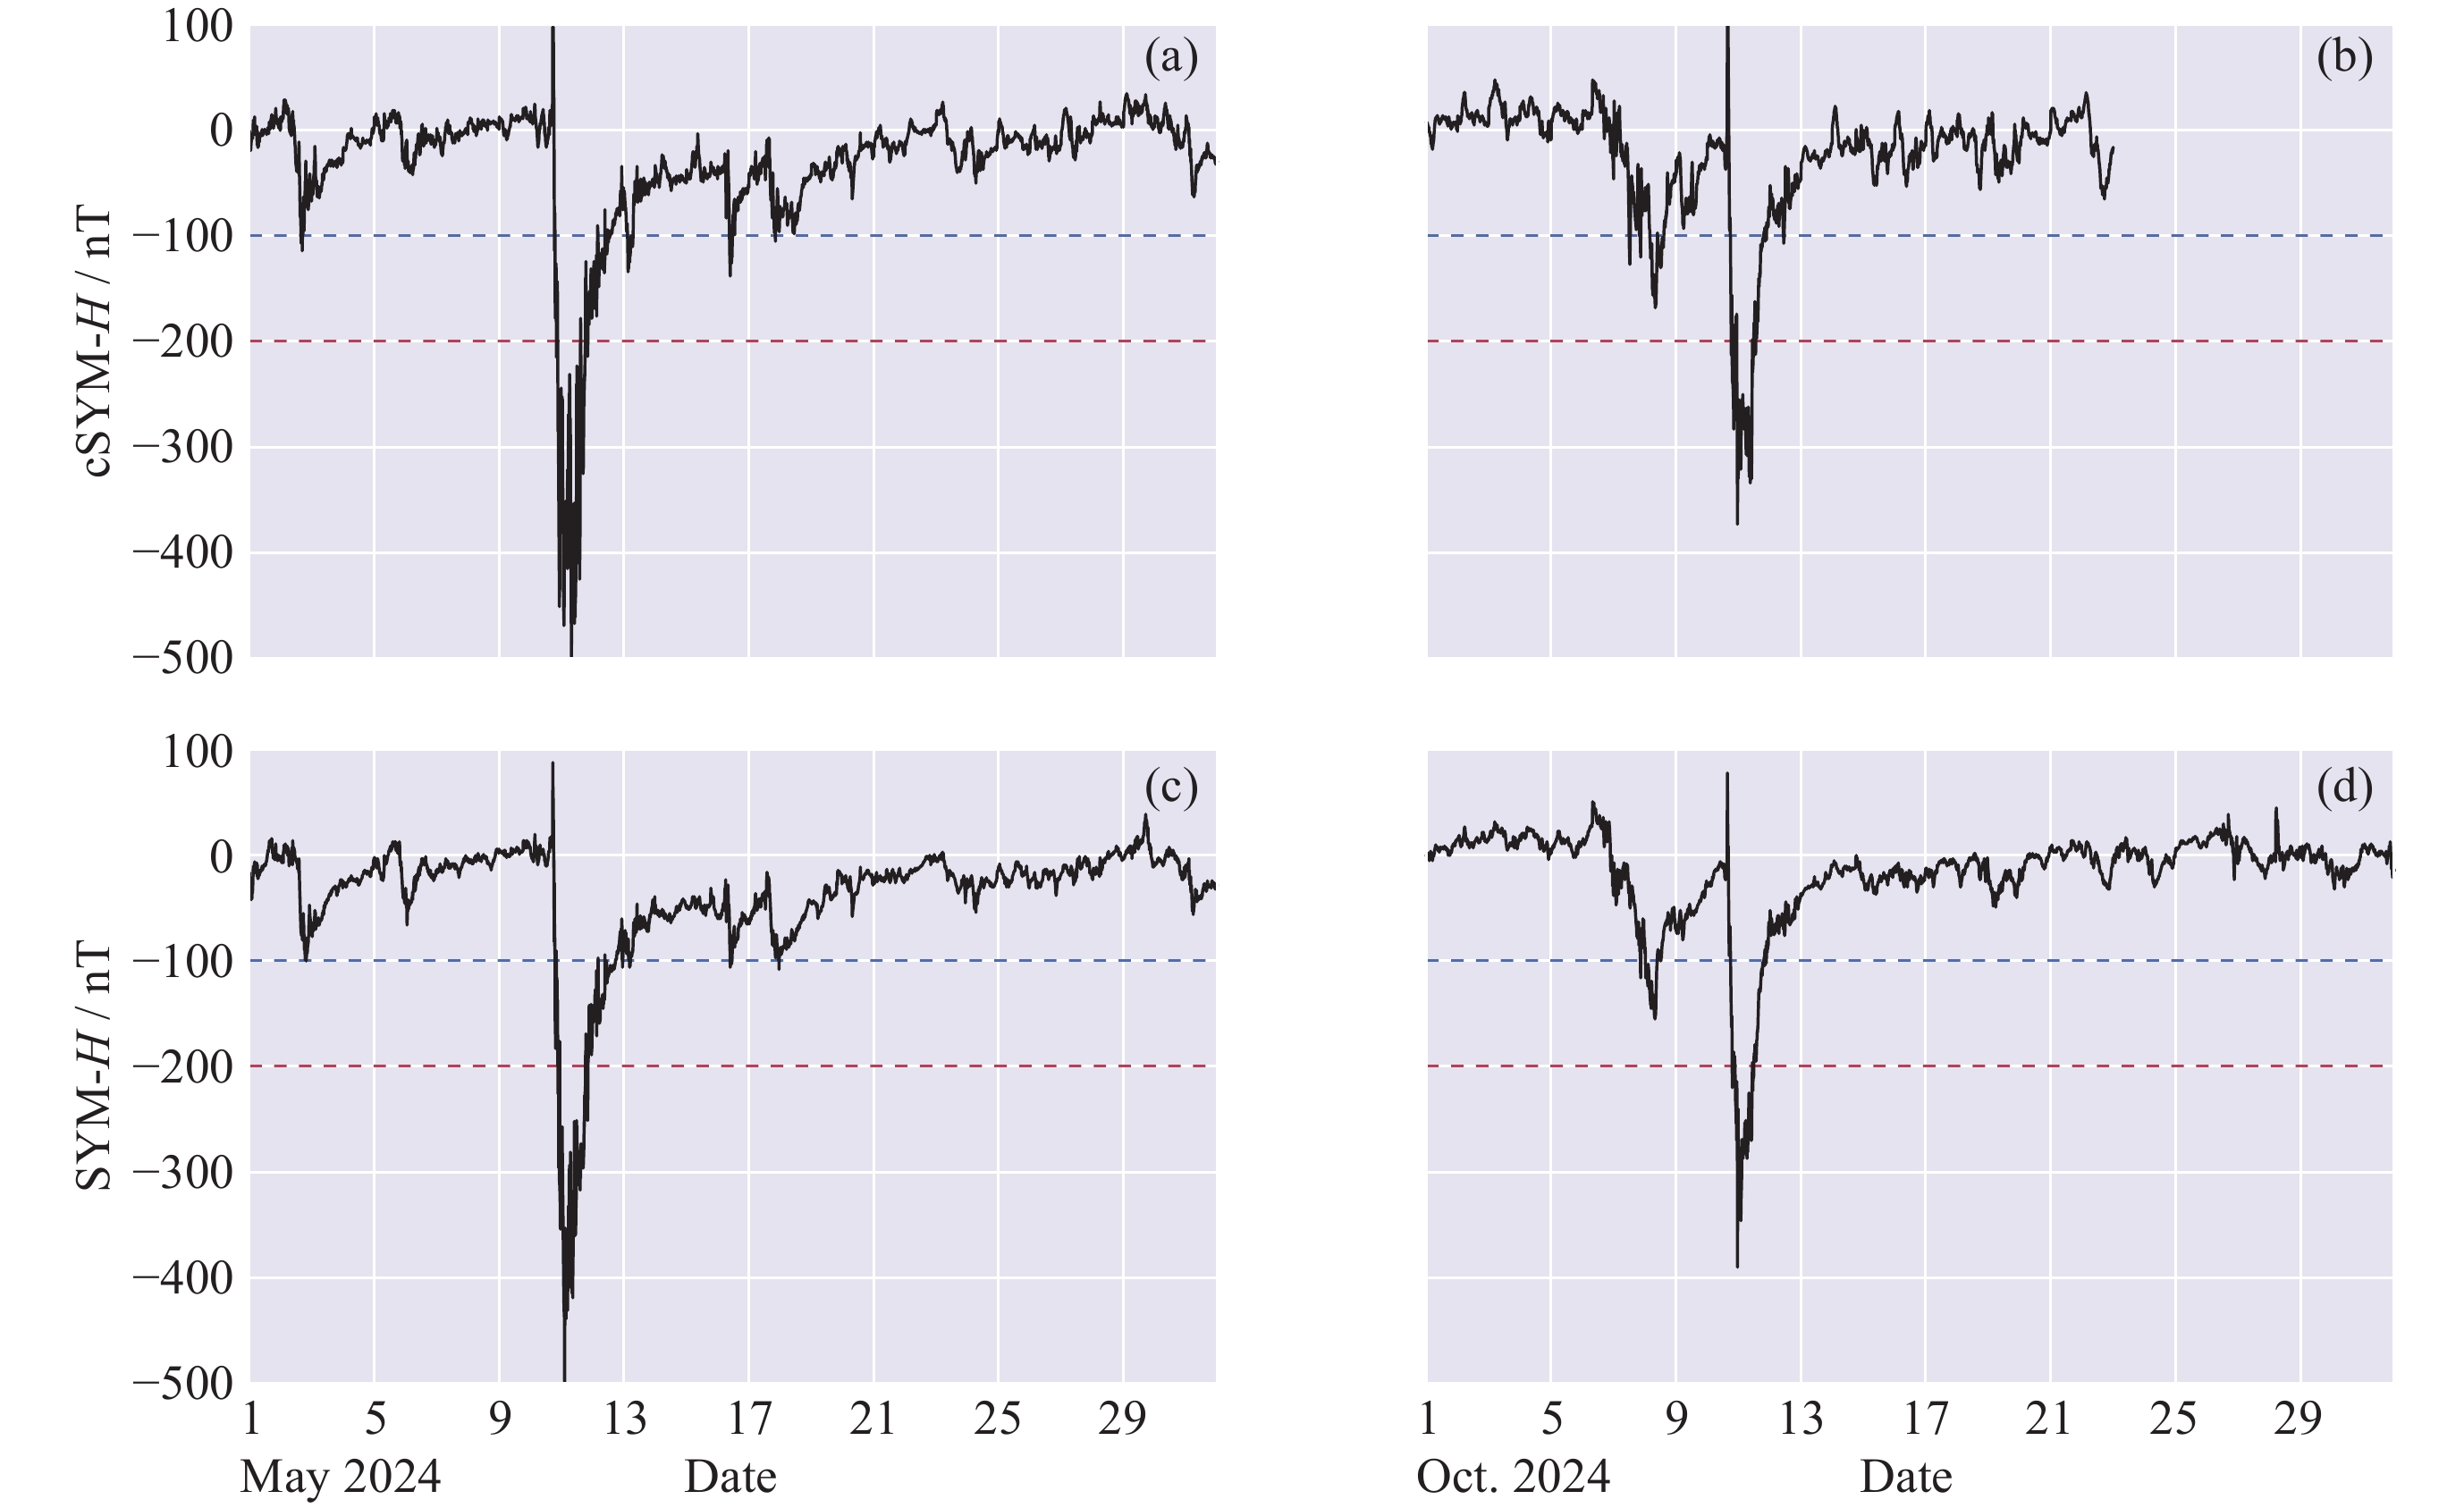
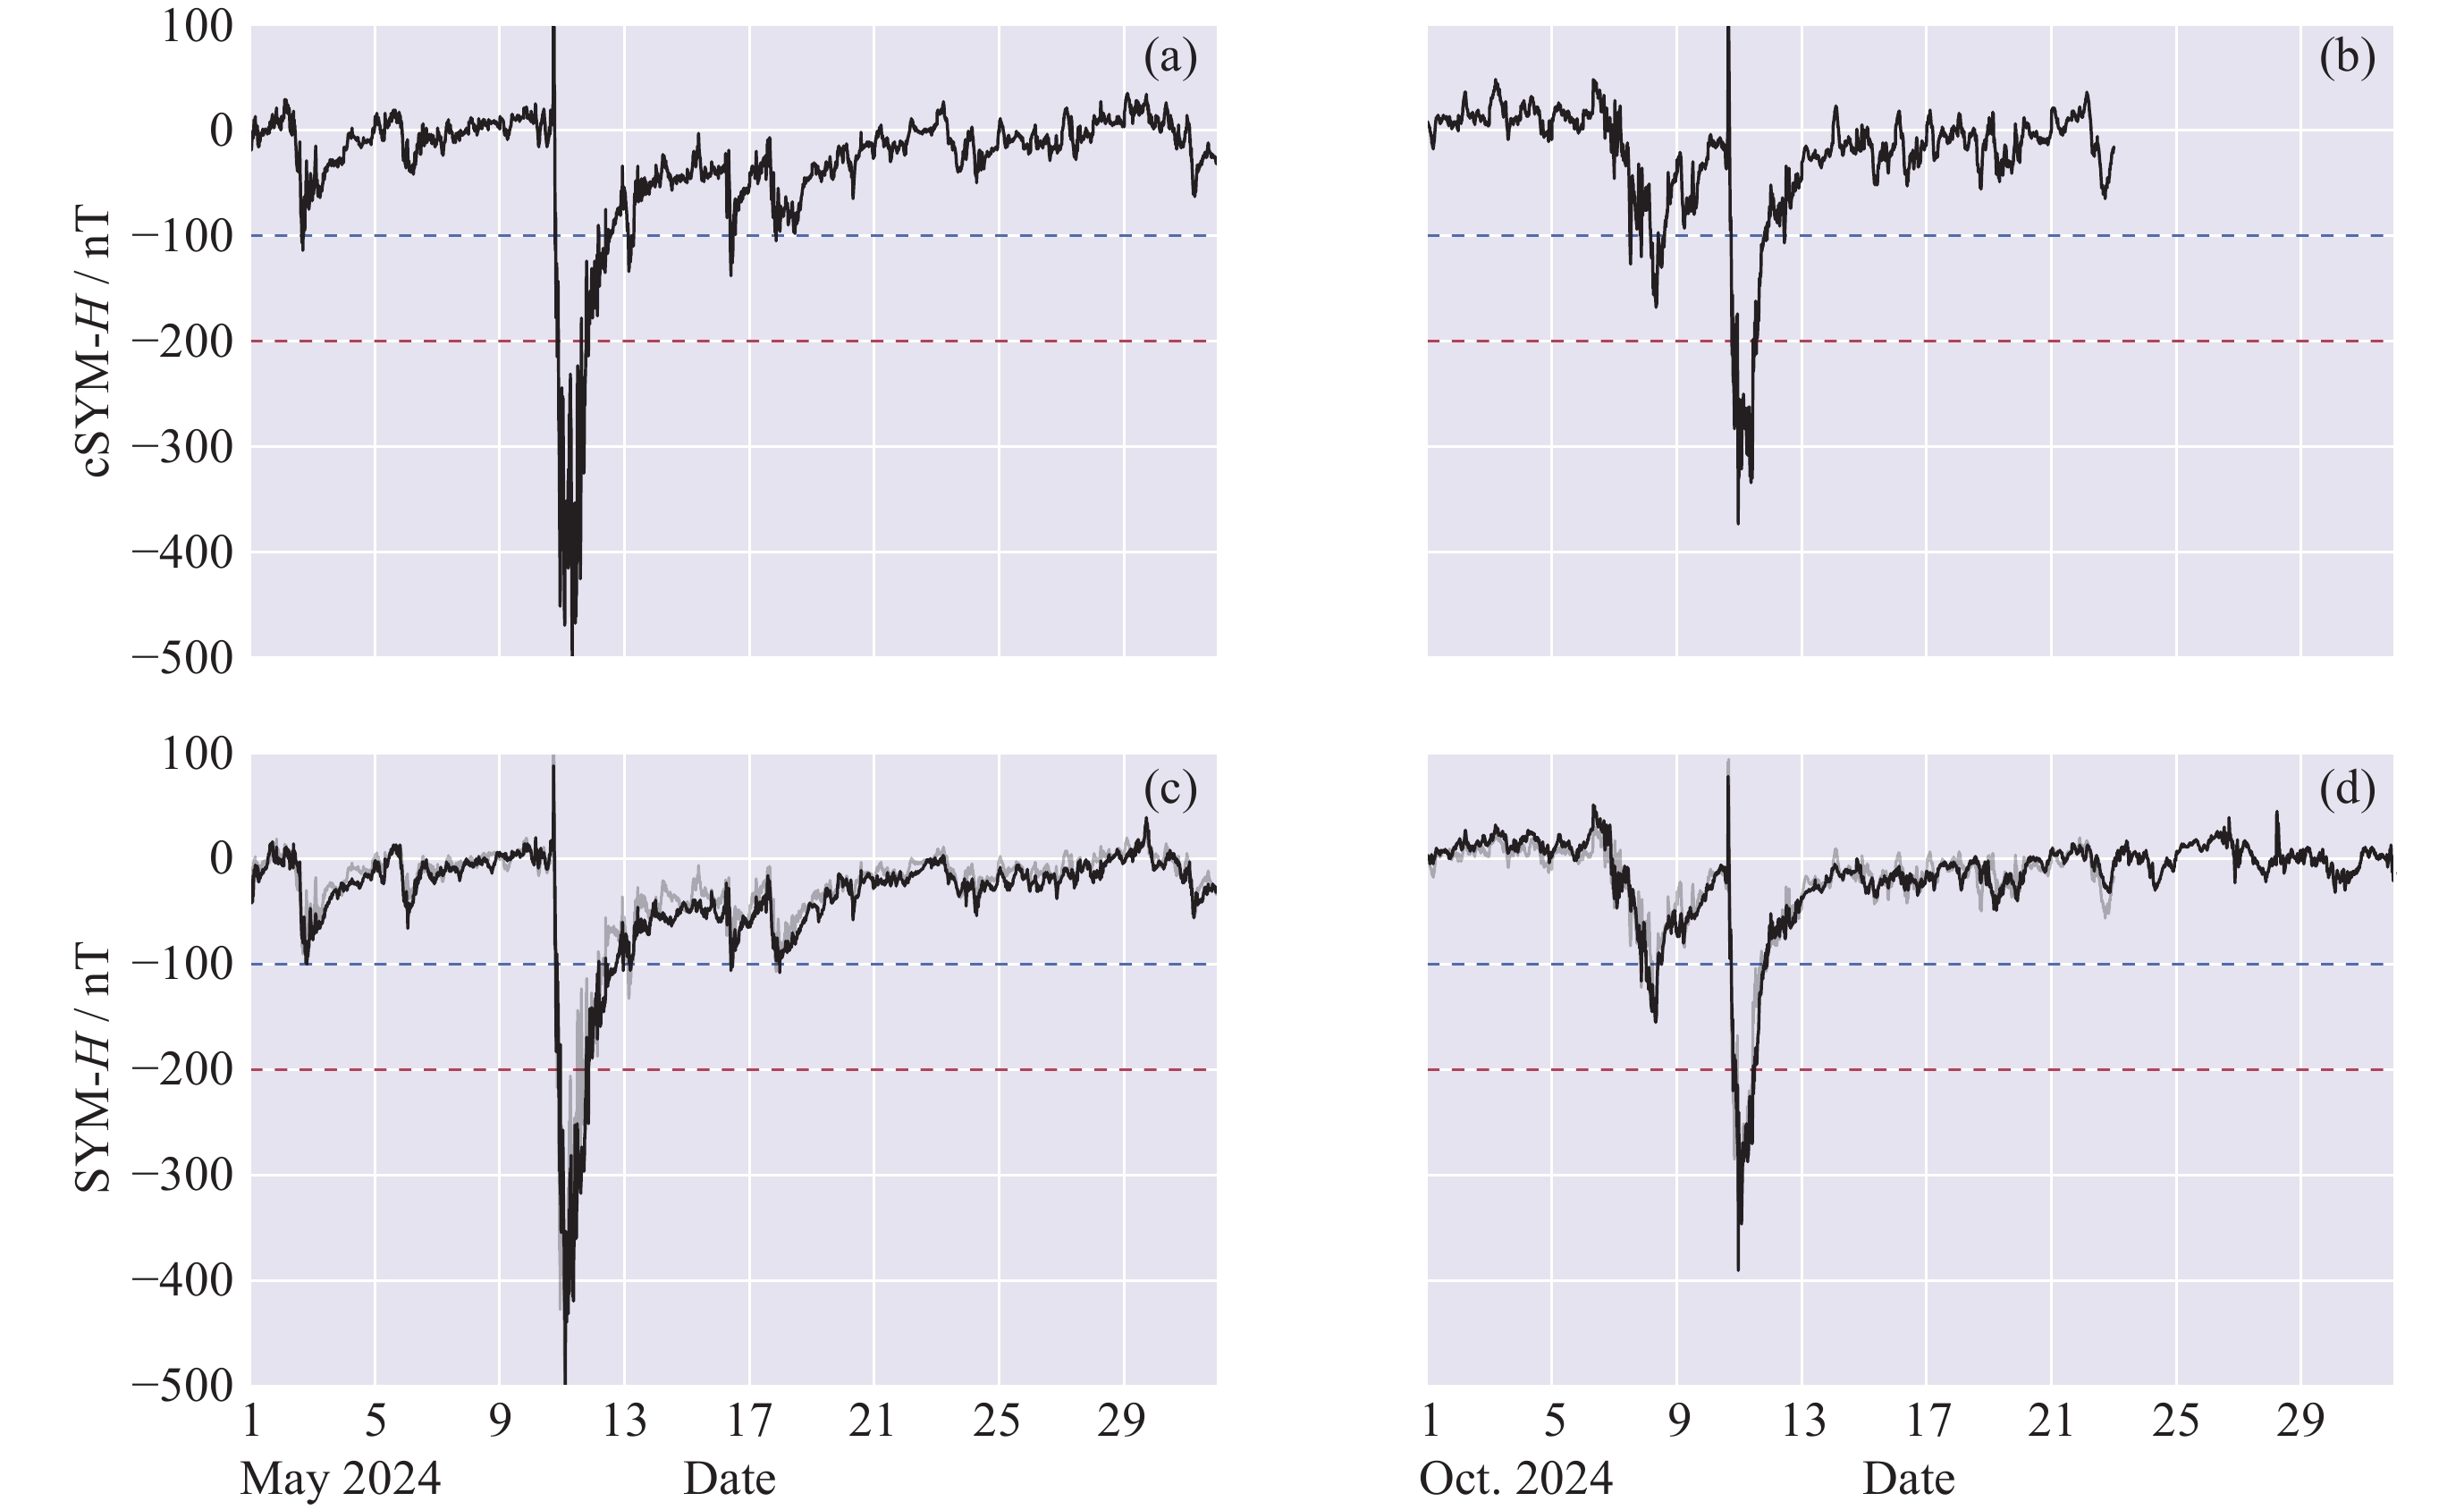
图 9 2024年5月和10月磁暴期间cSYM-H指数和SYM-H指数的对比
Figure 9. Comparison of cSYM-H index and SYM-H index during storms in May and October of 2024
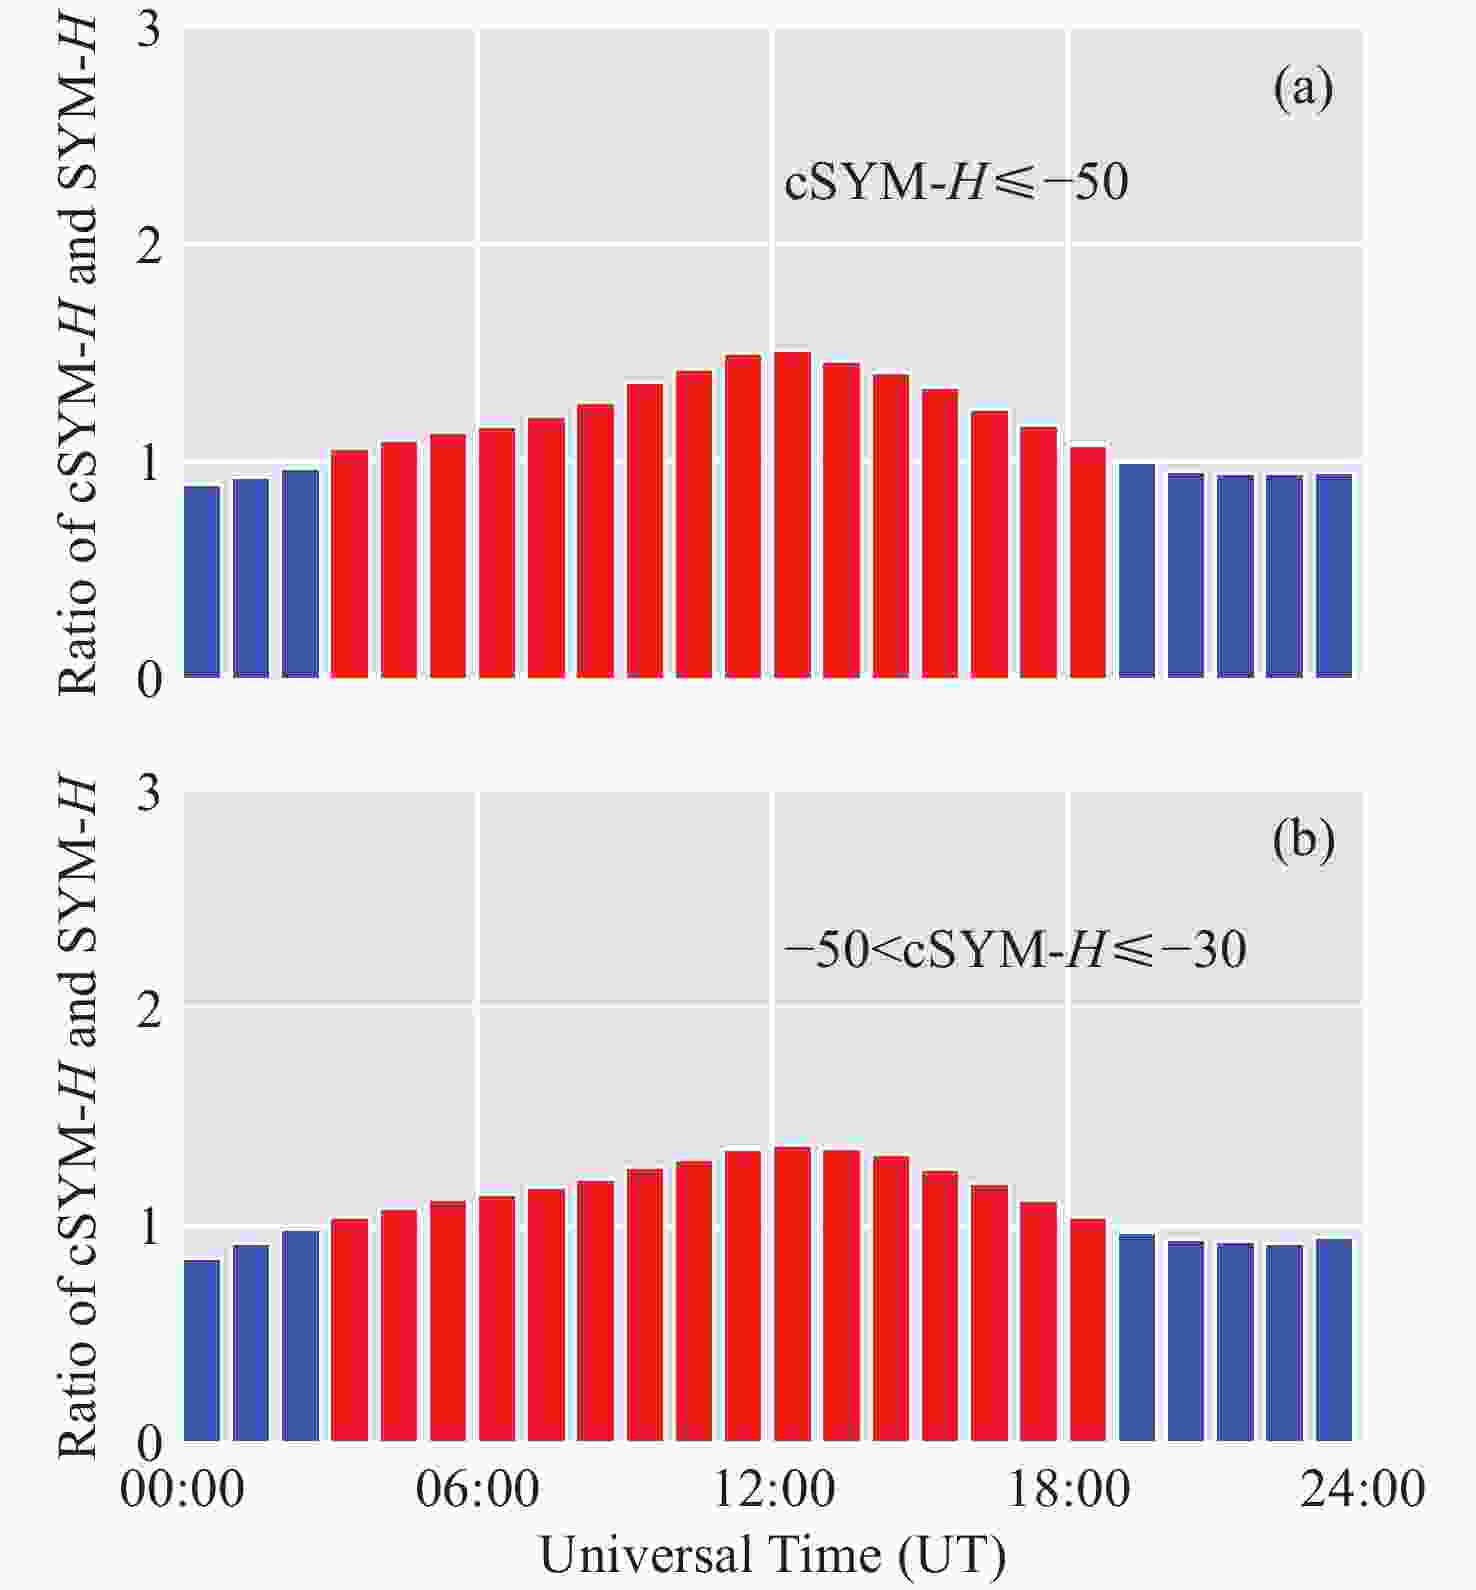
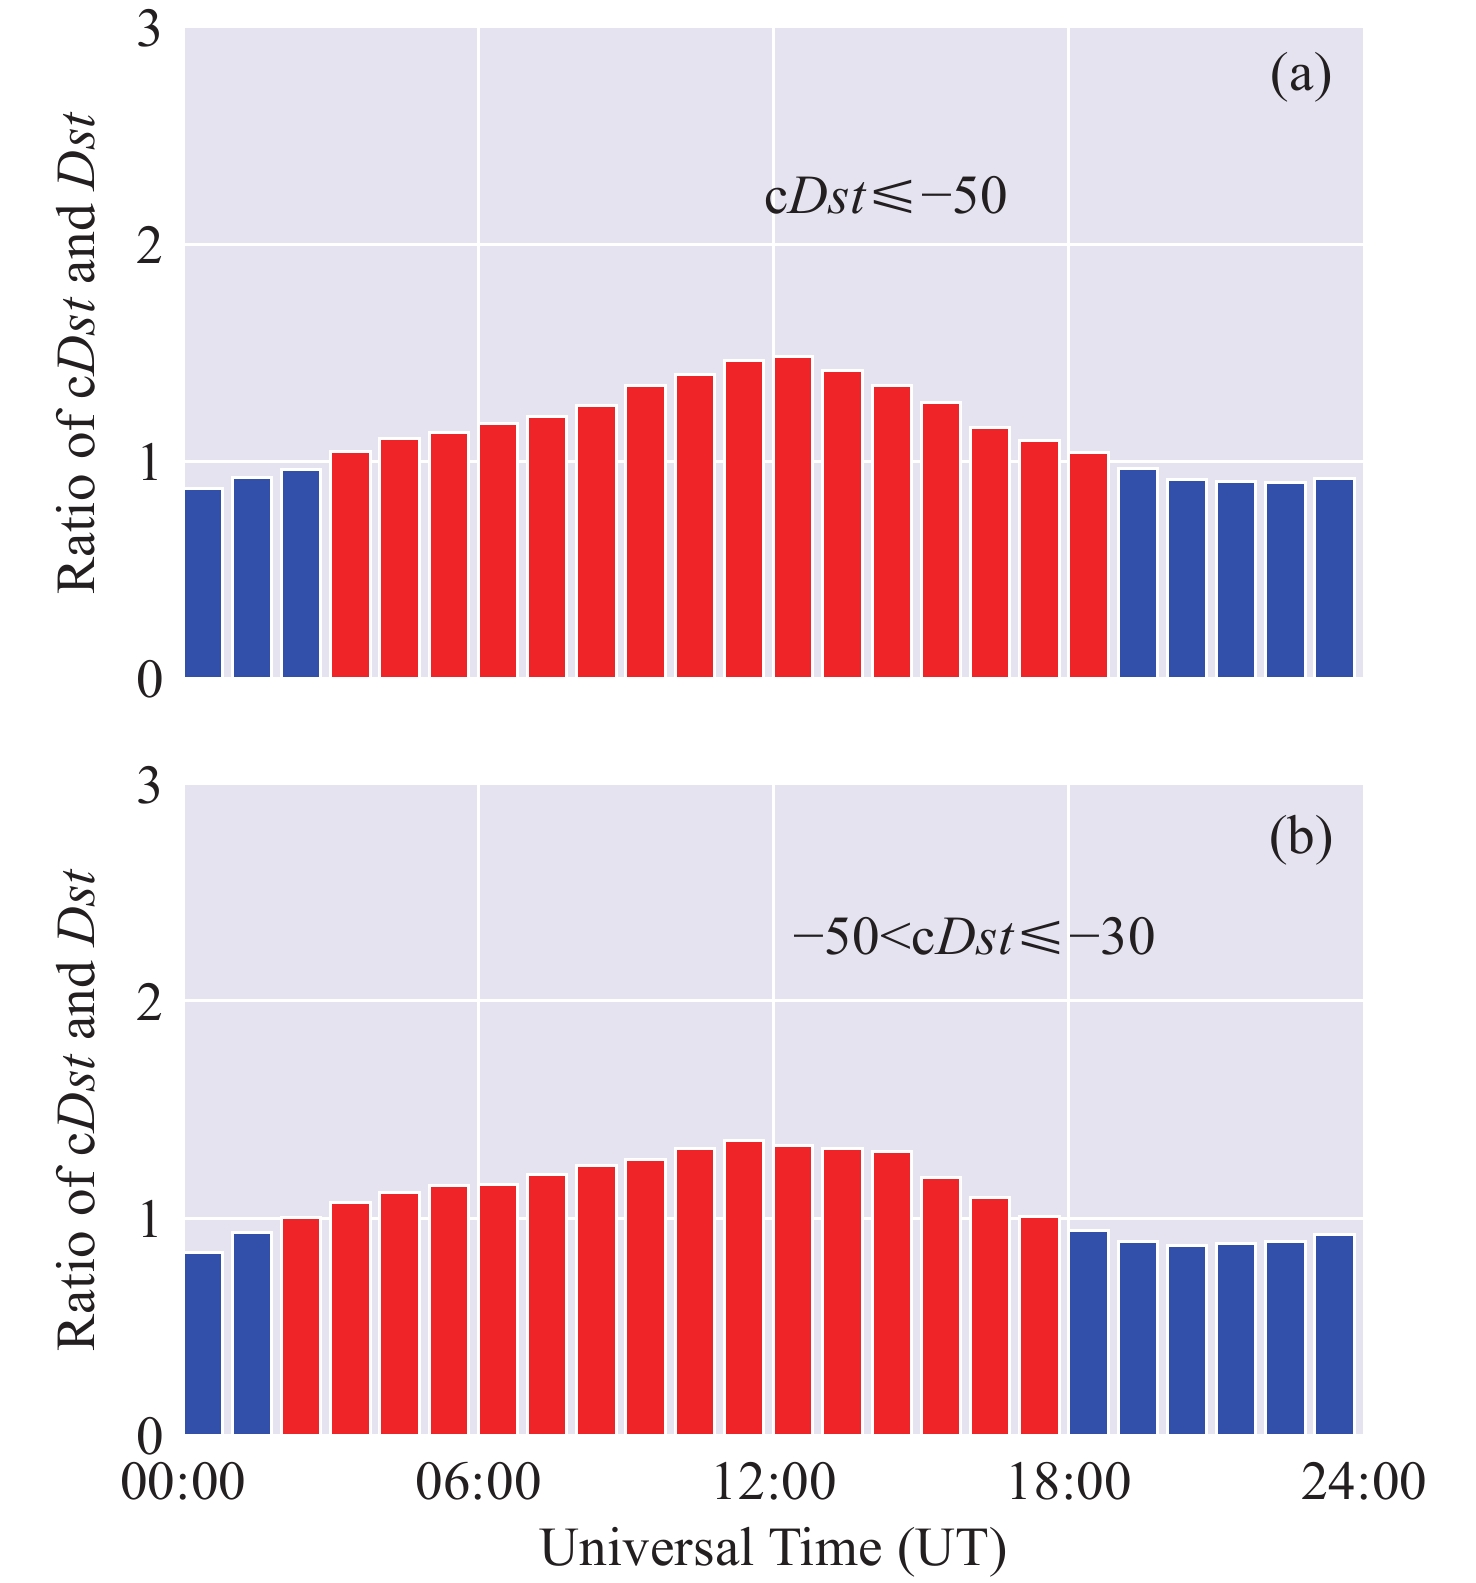
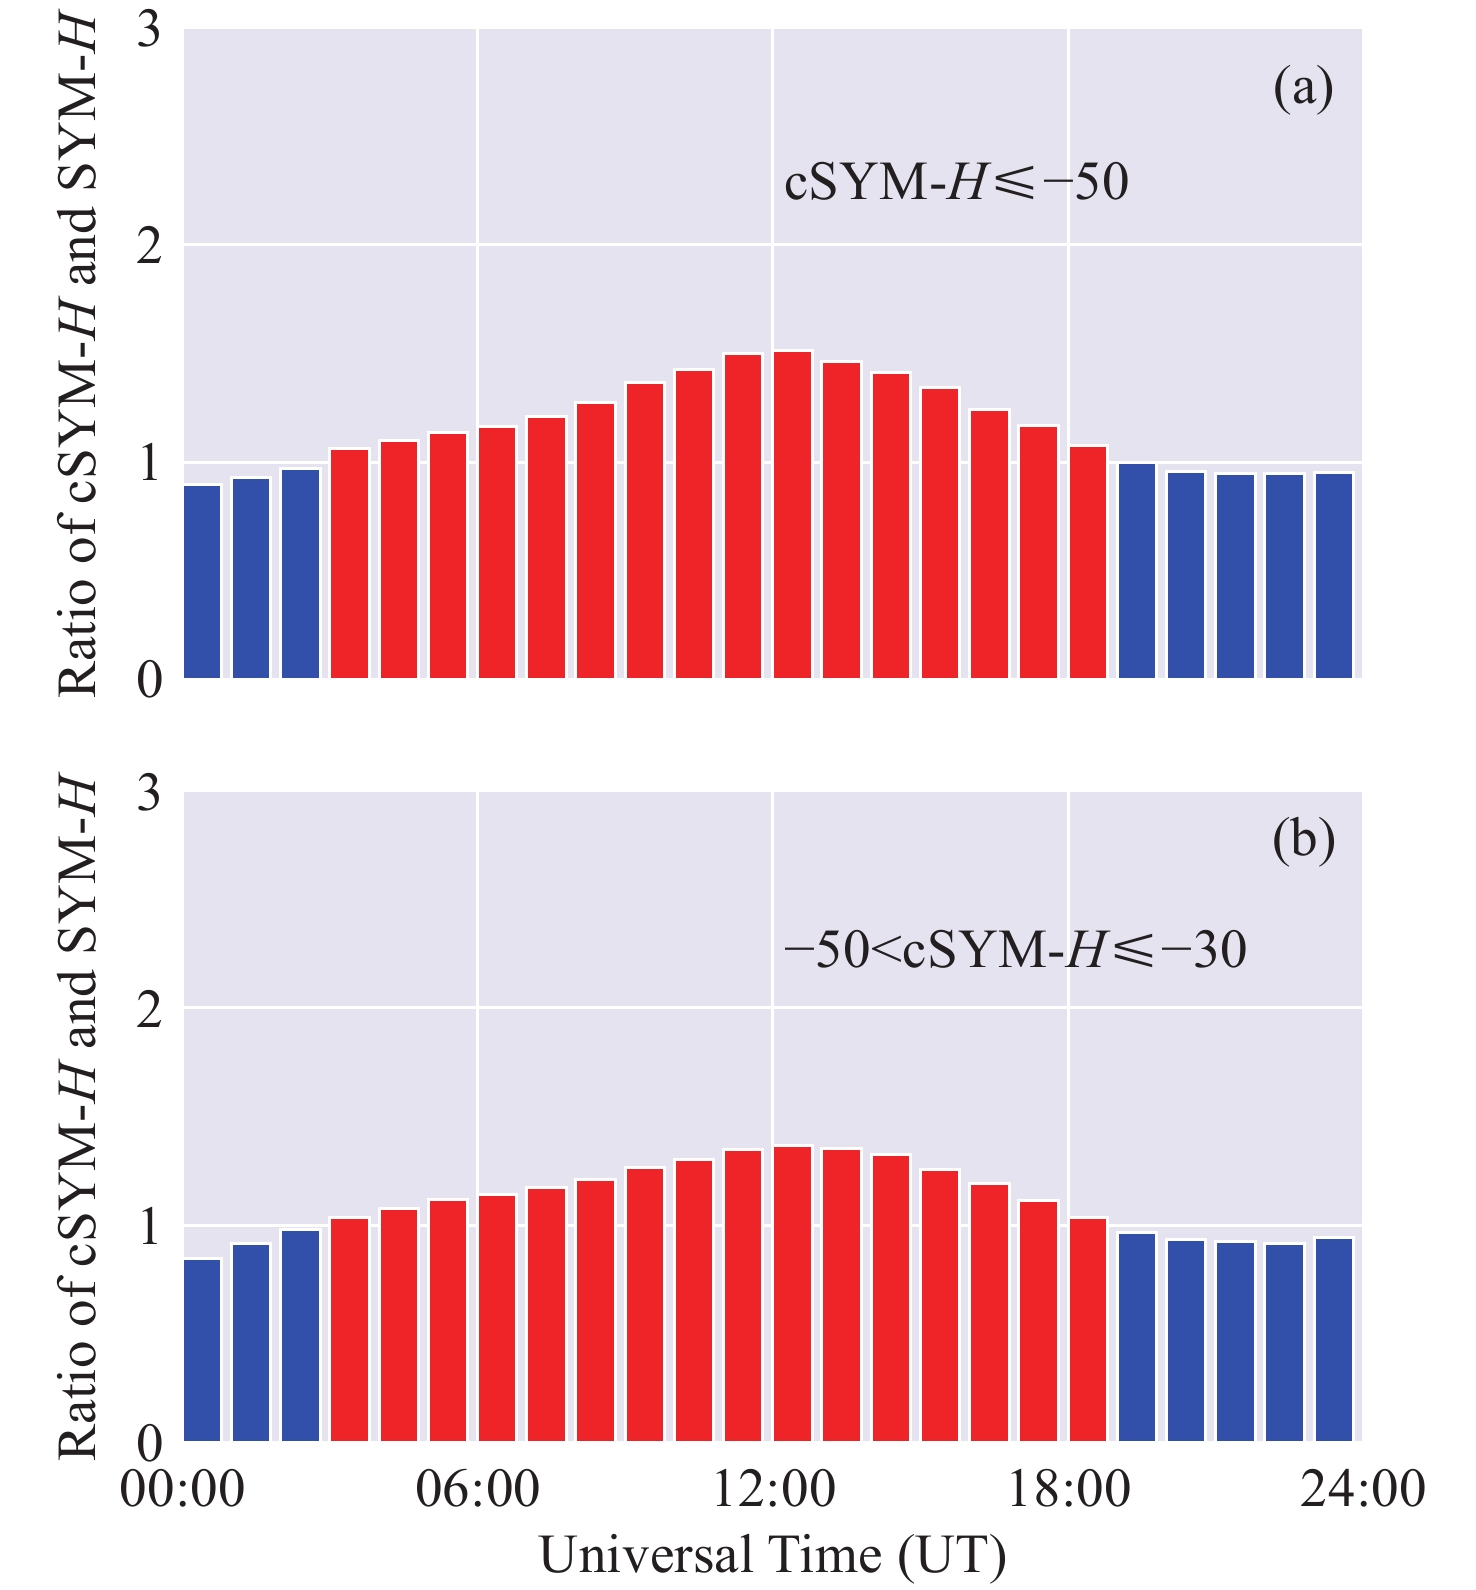
图 10 cSYM-H和SYM-H的比值随UT的分布
Figure 10. Distribution of the ratio of cSYM-H to SYM-H with UT
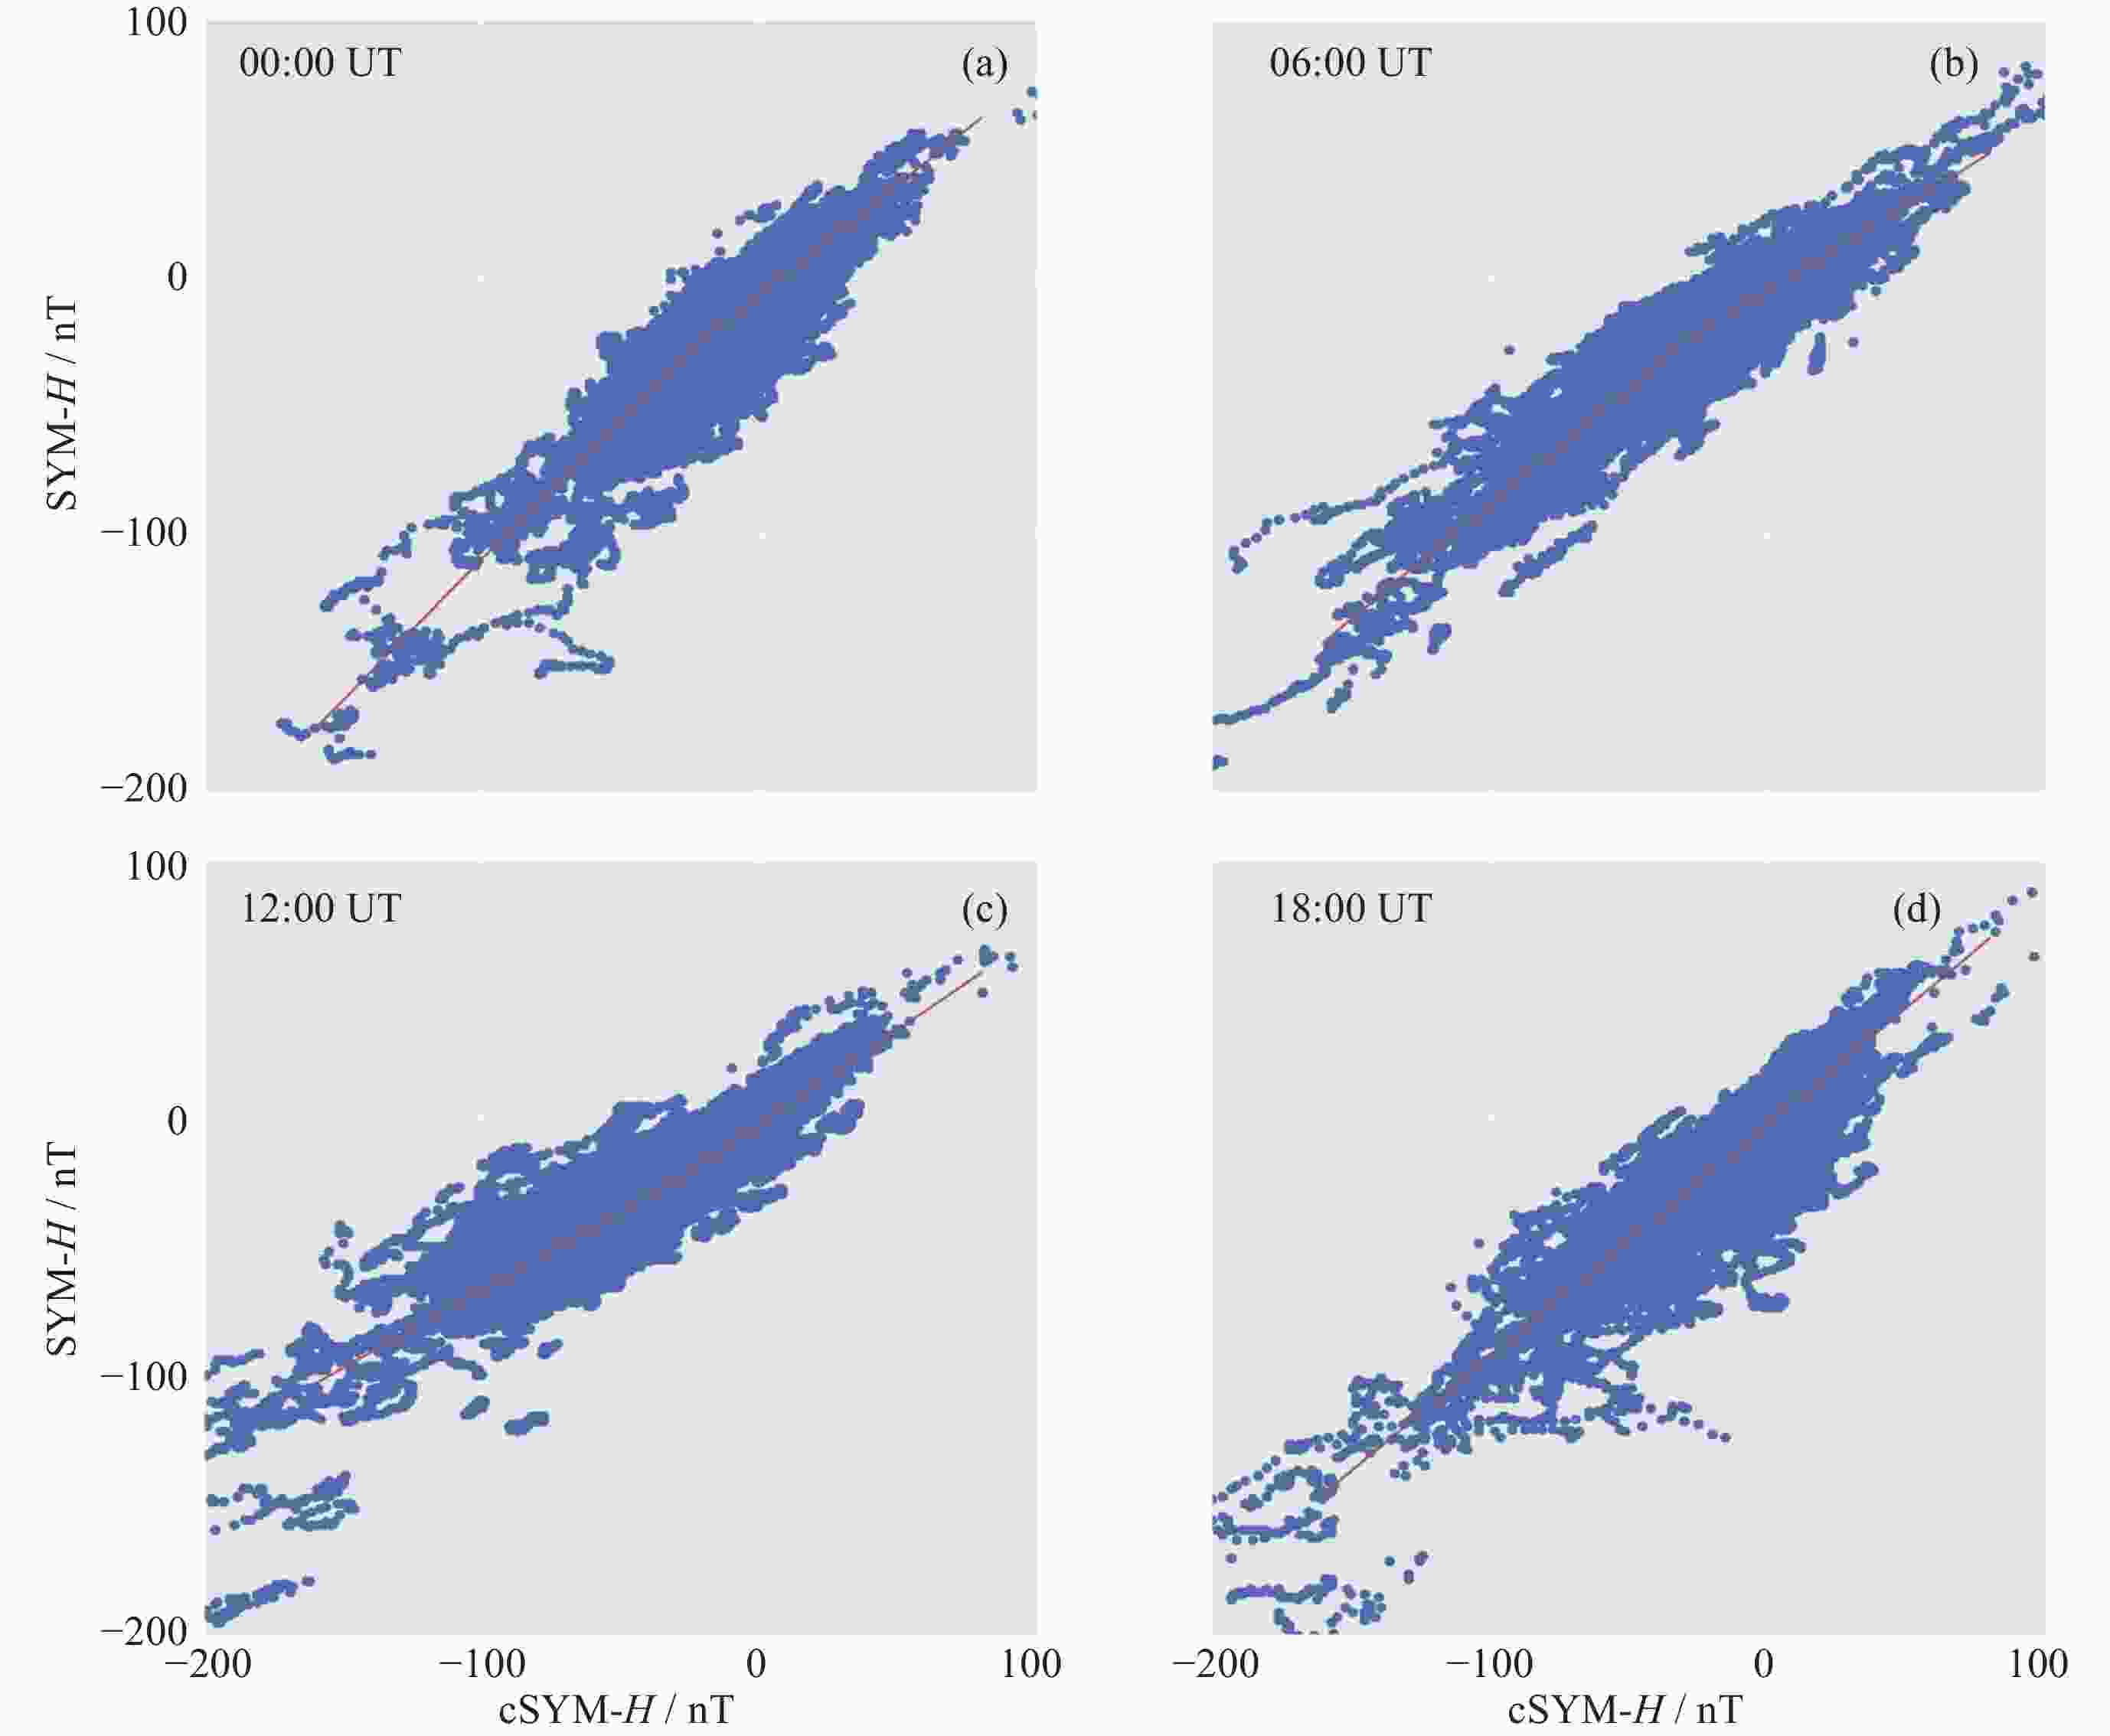
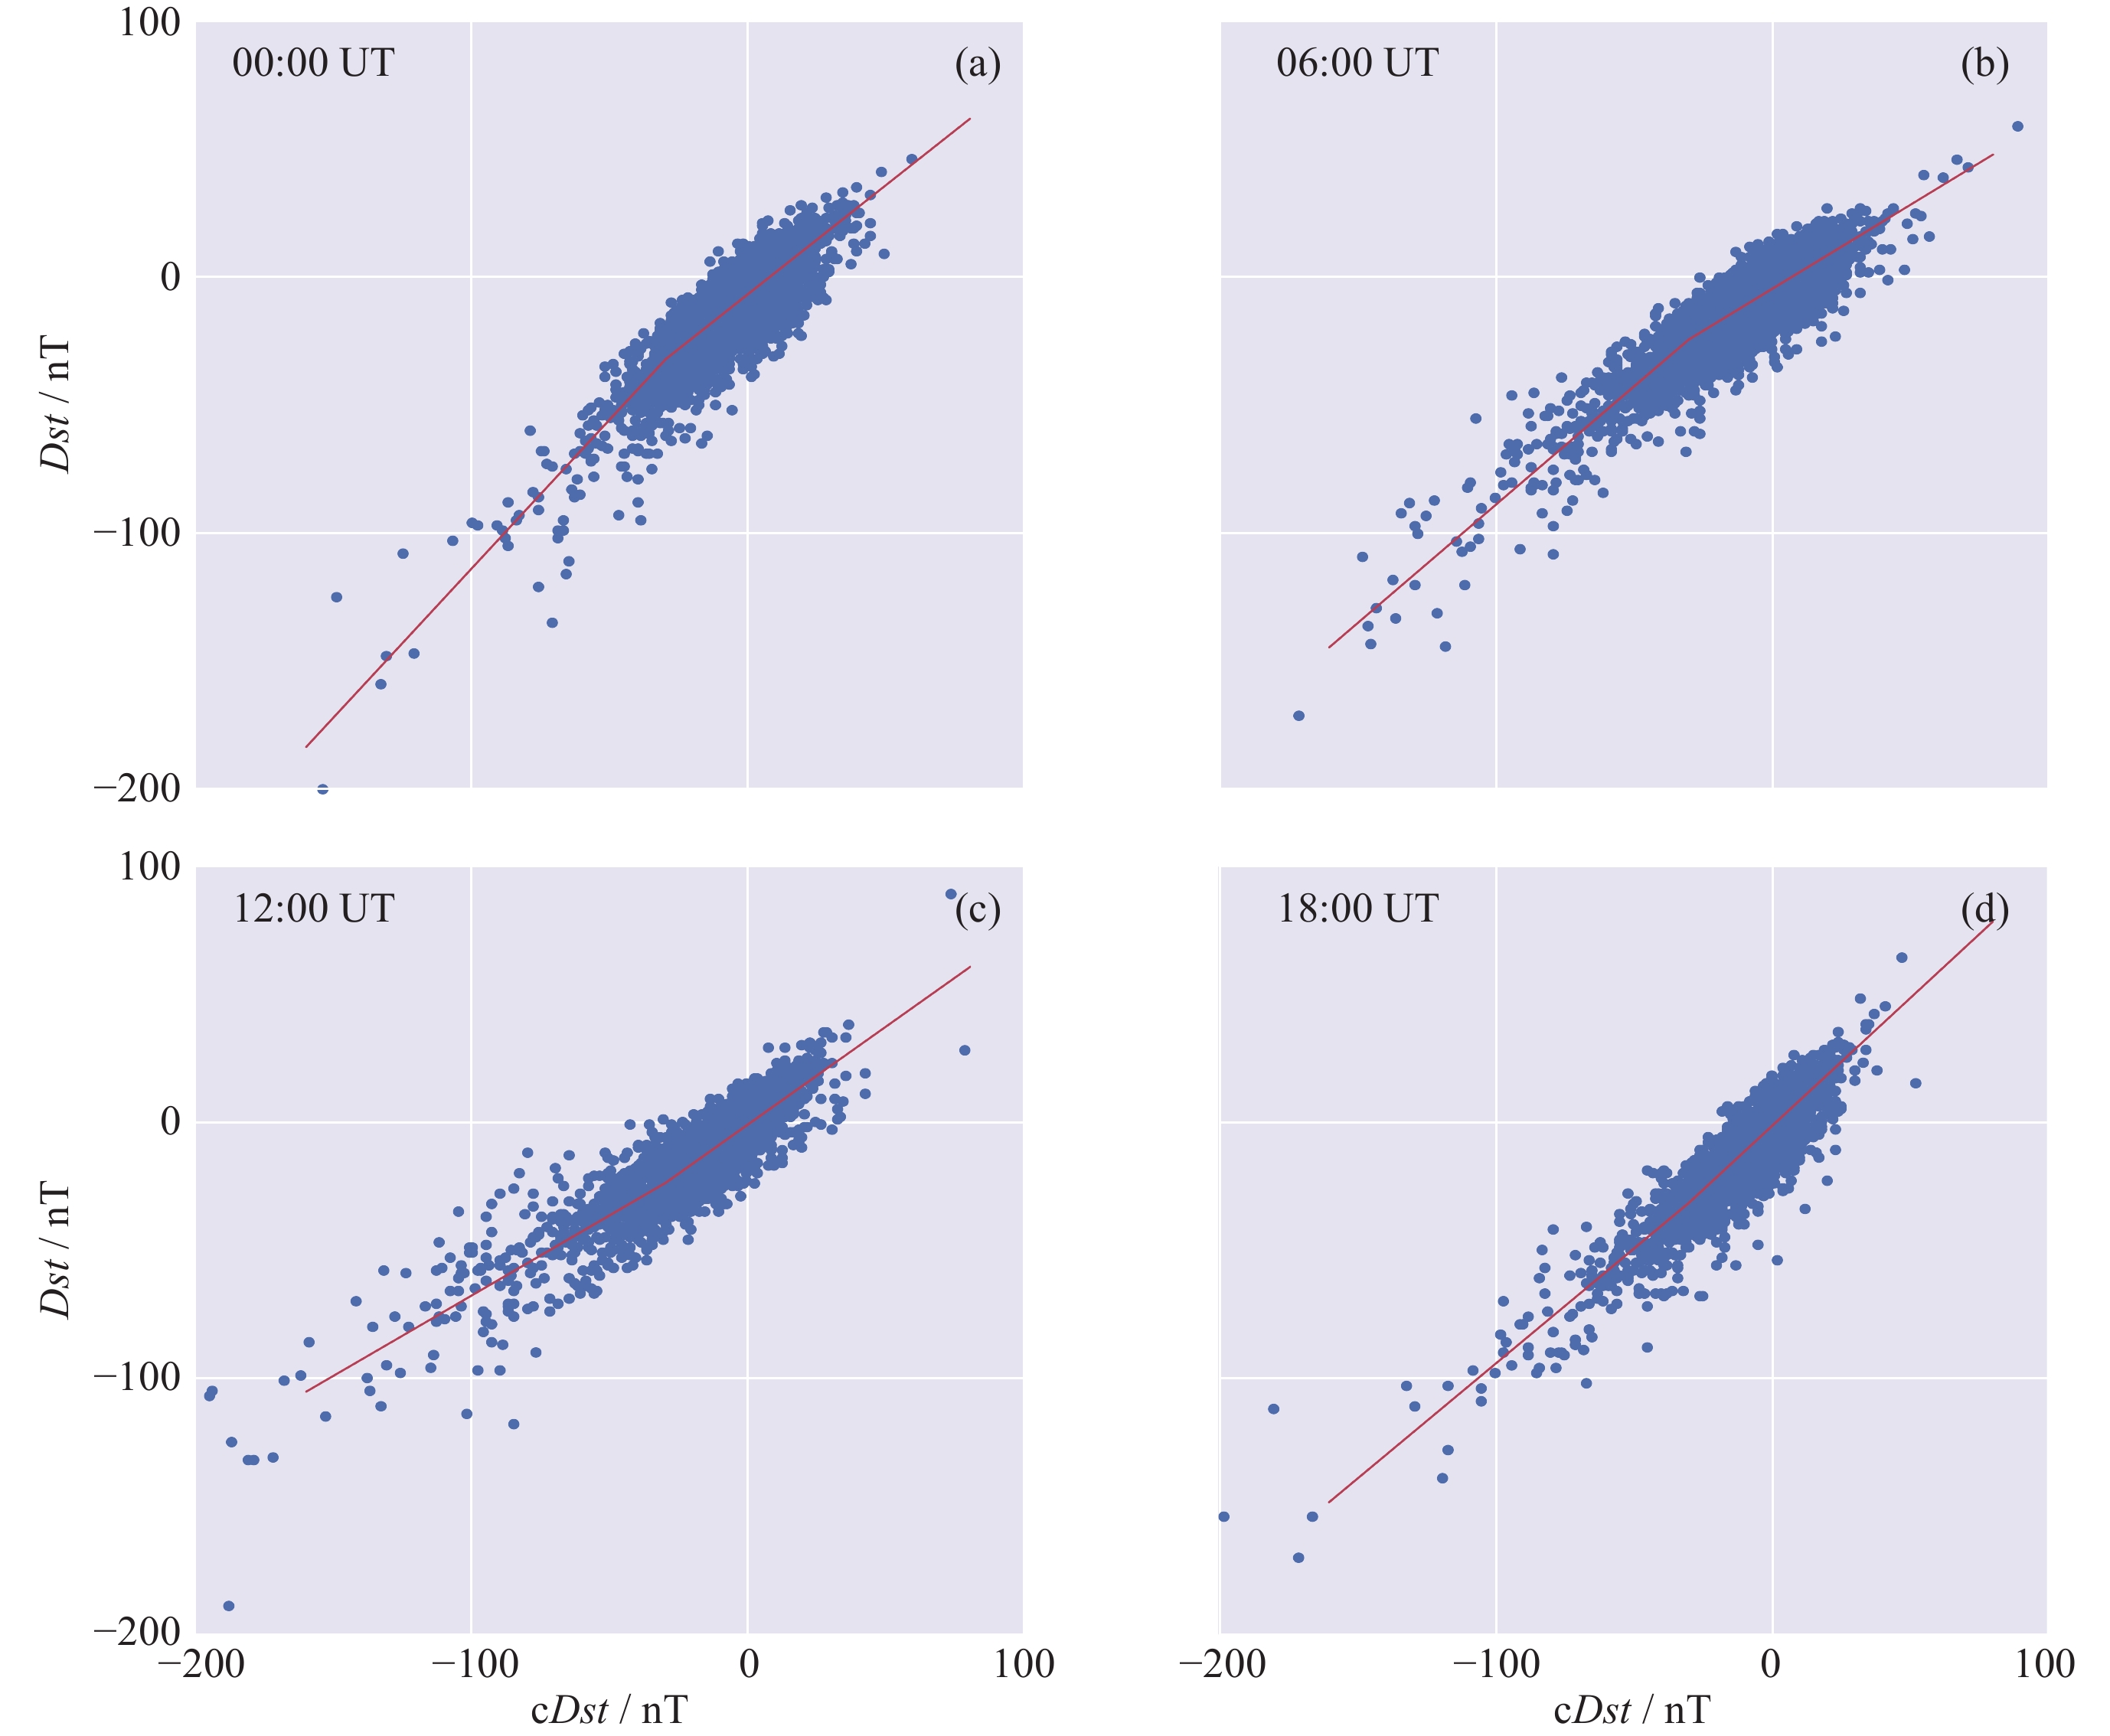
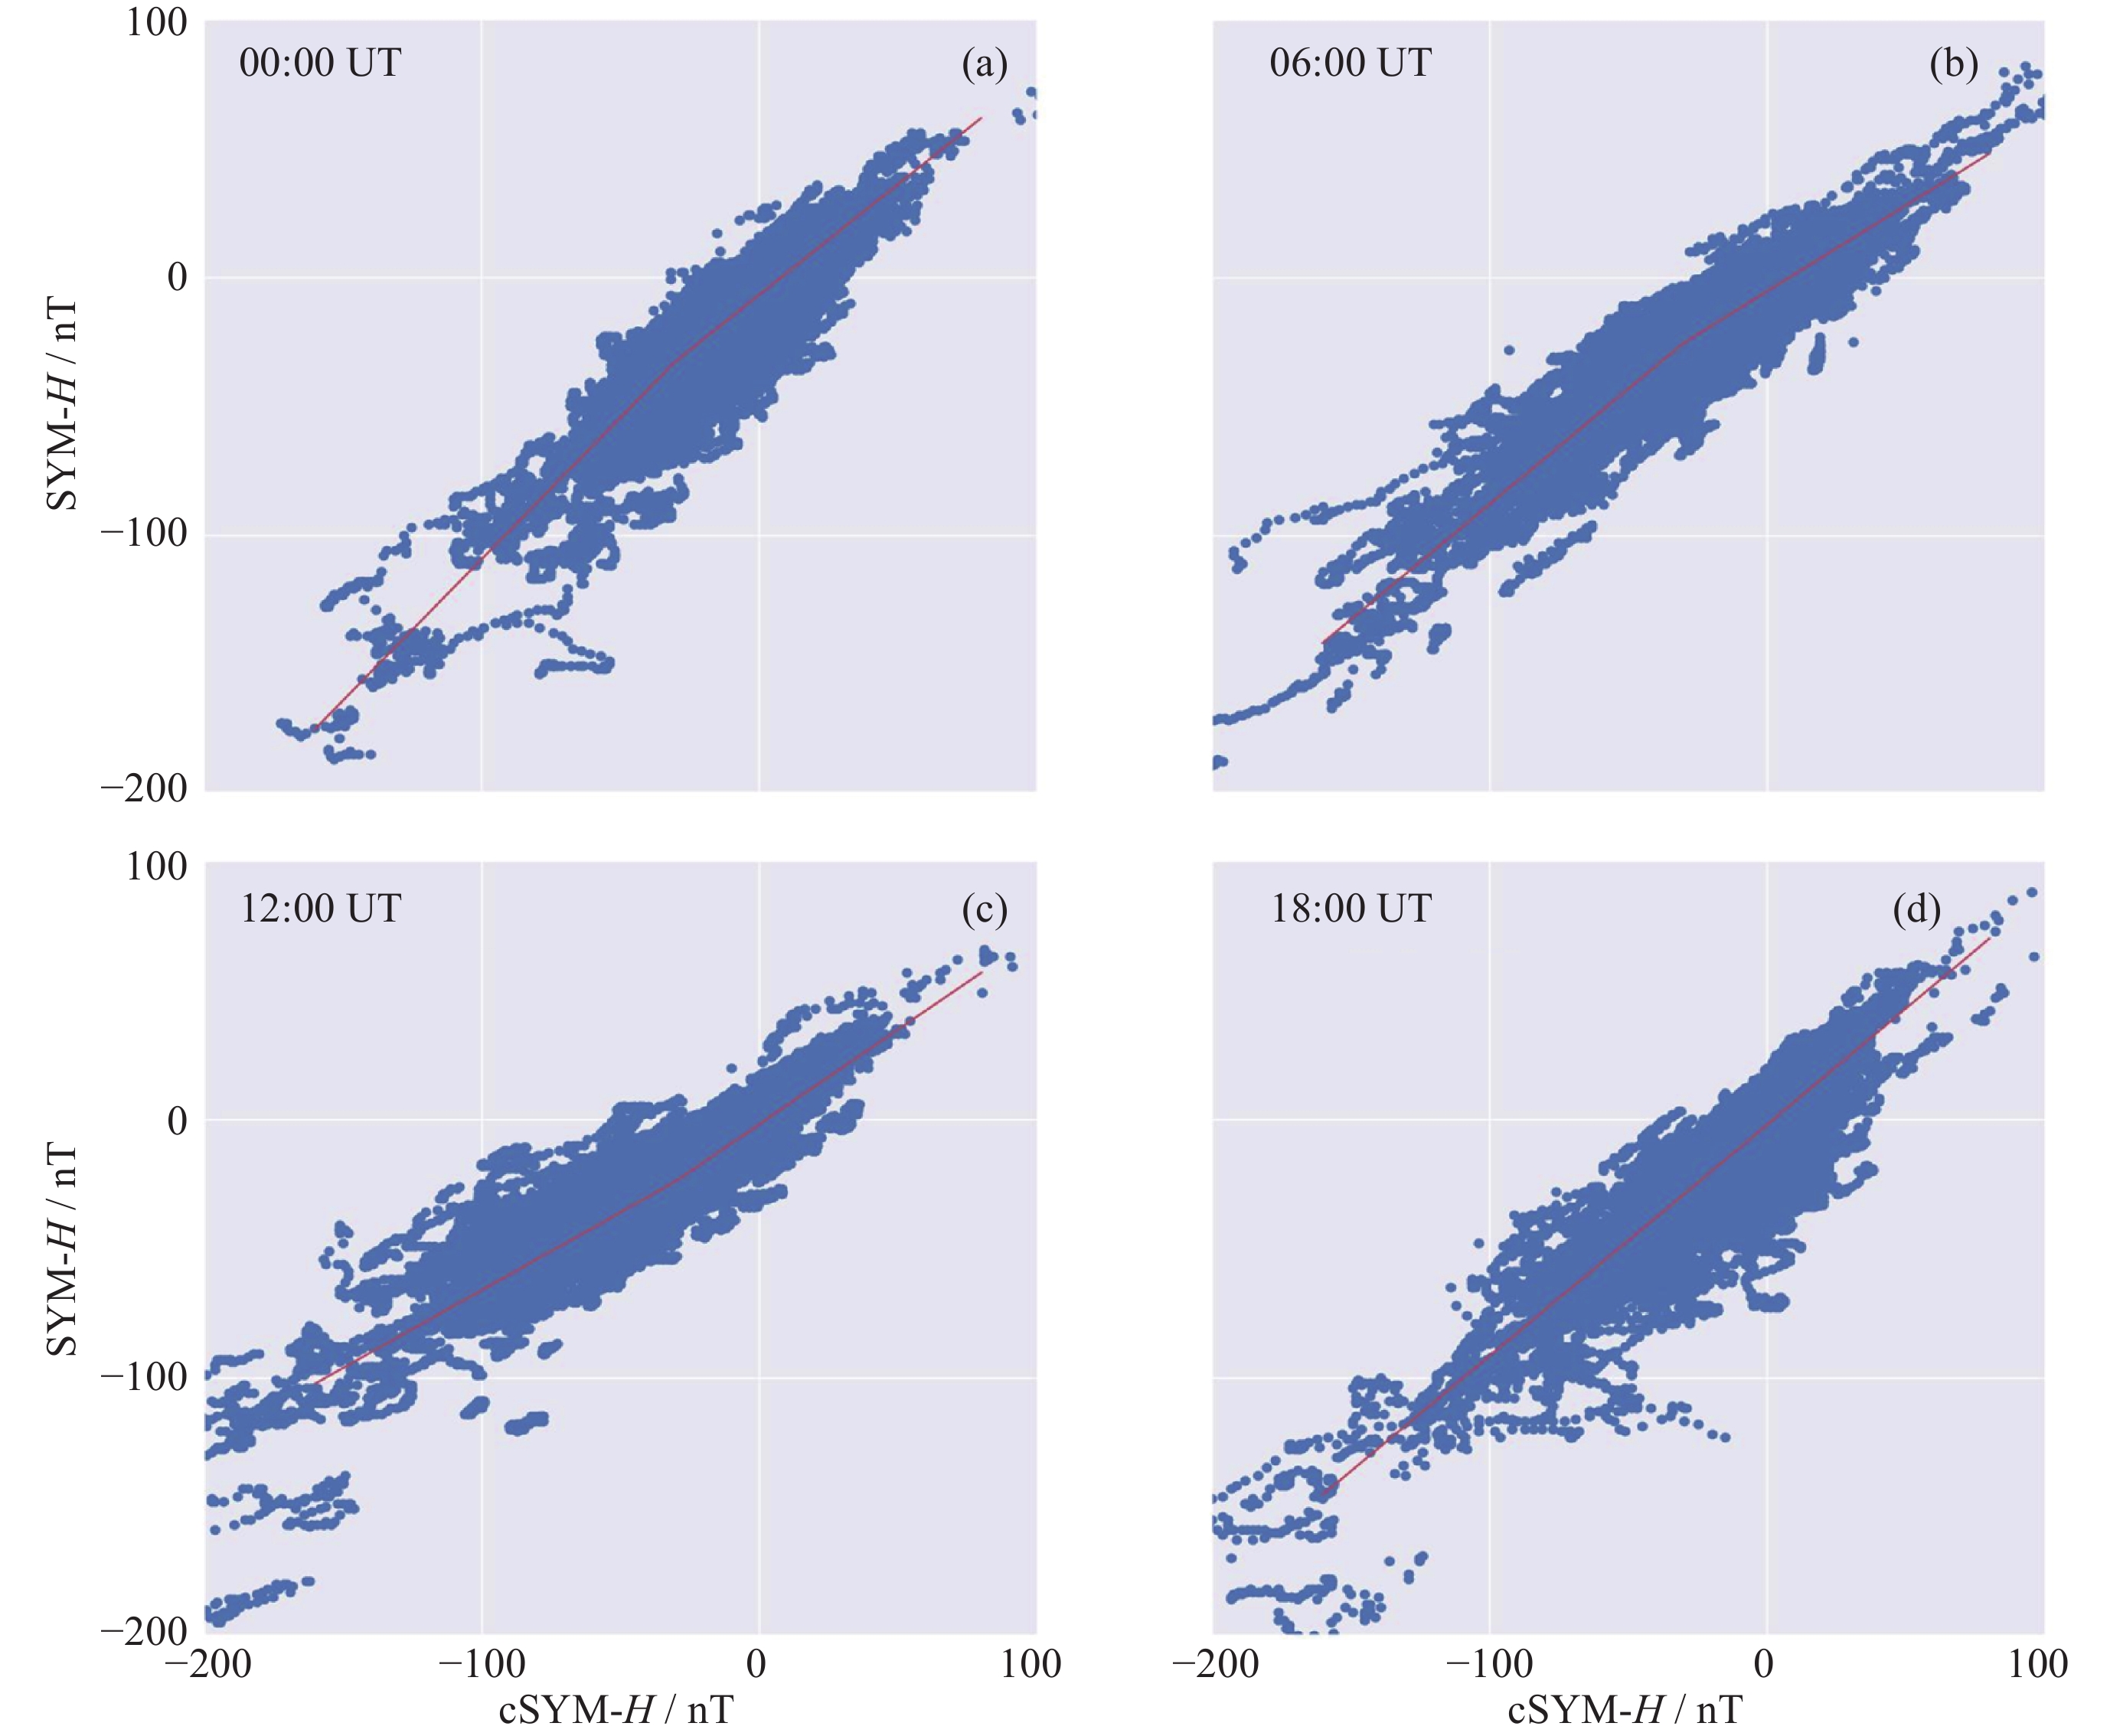
图 11 SYM-H指数随cSYM-H指数的变化关系
Figure 11. Relationship between SYM-H index and cSYM-H index
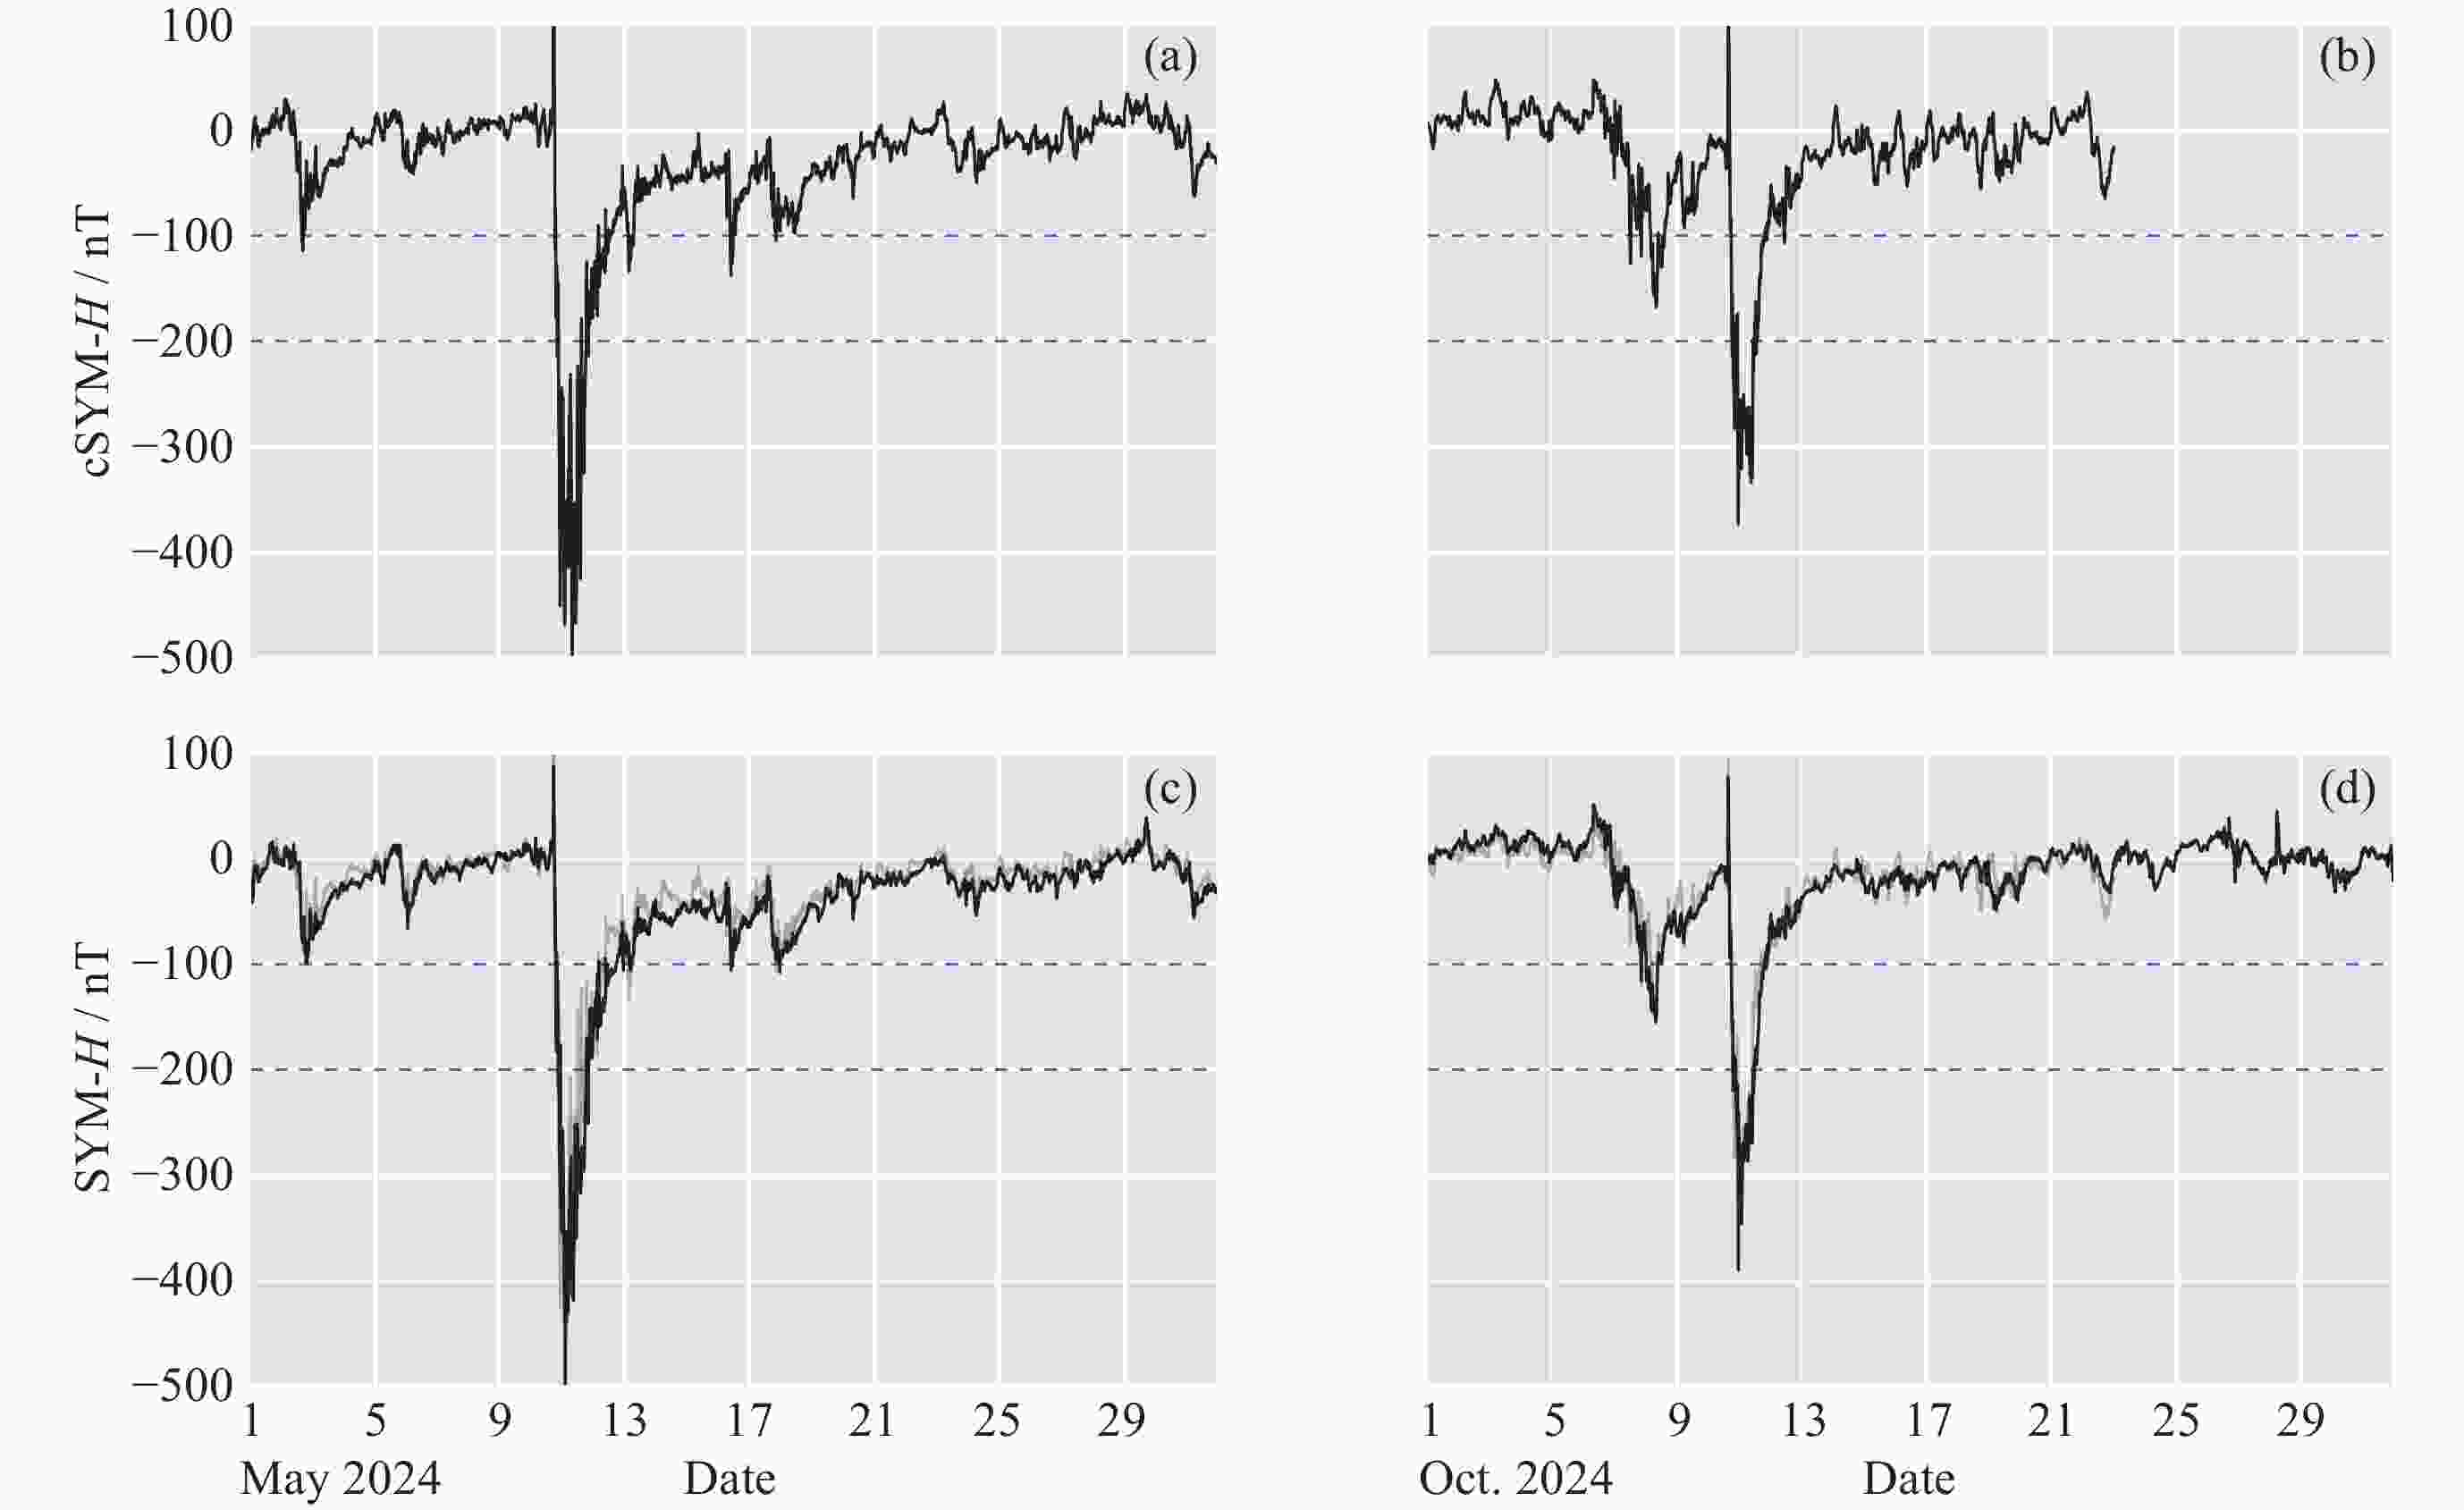
图 12 2024年5月和10月磁暴期间cSYM-H指数和SYM-H指数与fSYM-H值的对比
Figure 12. Comparison of cSYM-H index, SYM-H index, and fSYM-H values during storms in May and October of 2024
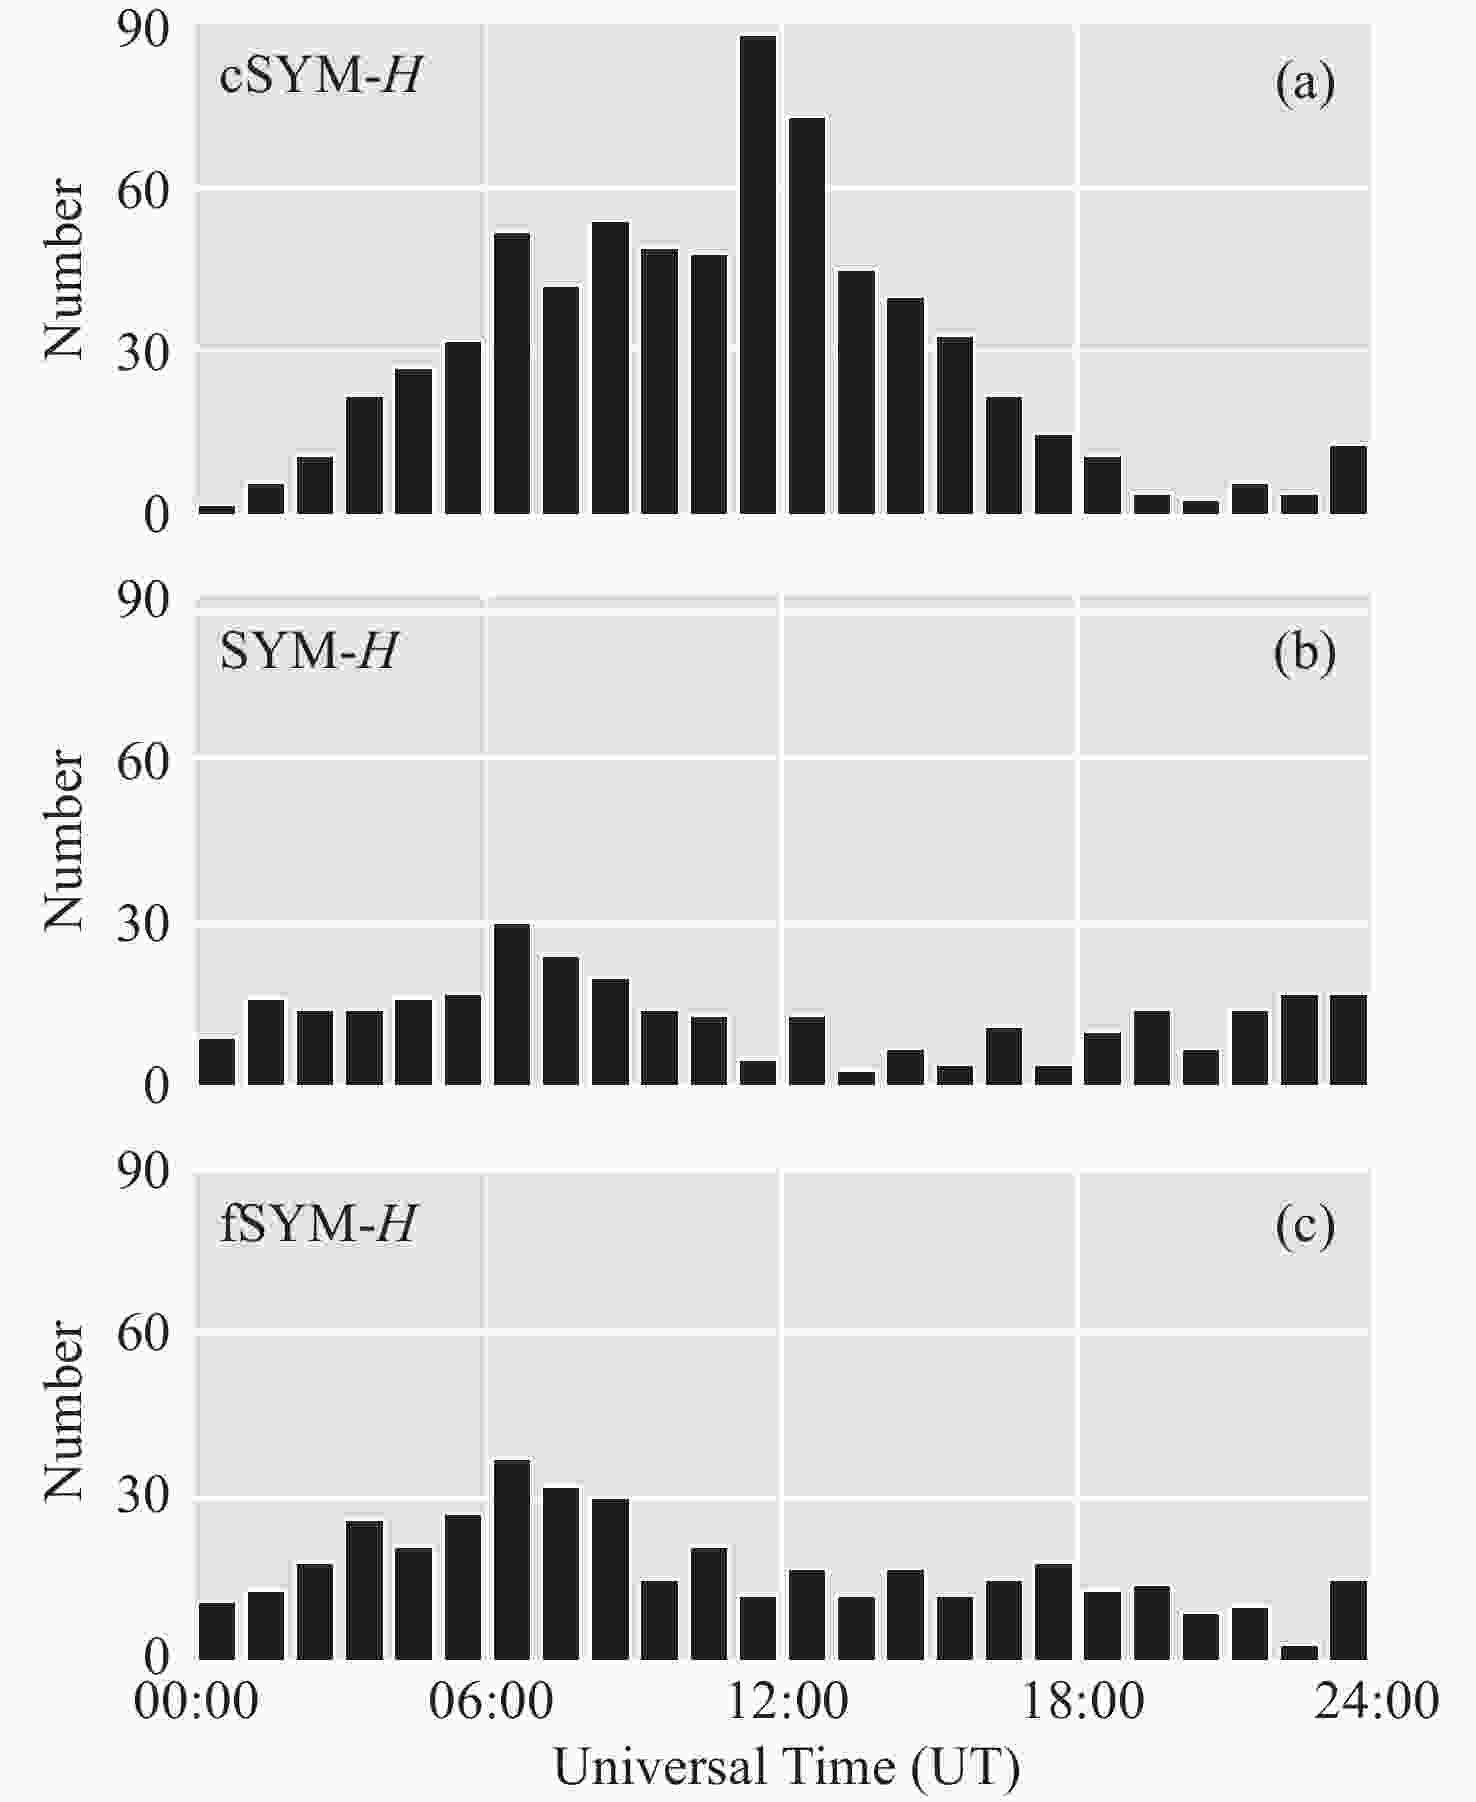
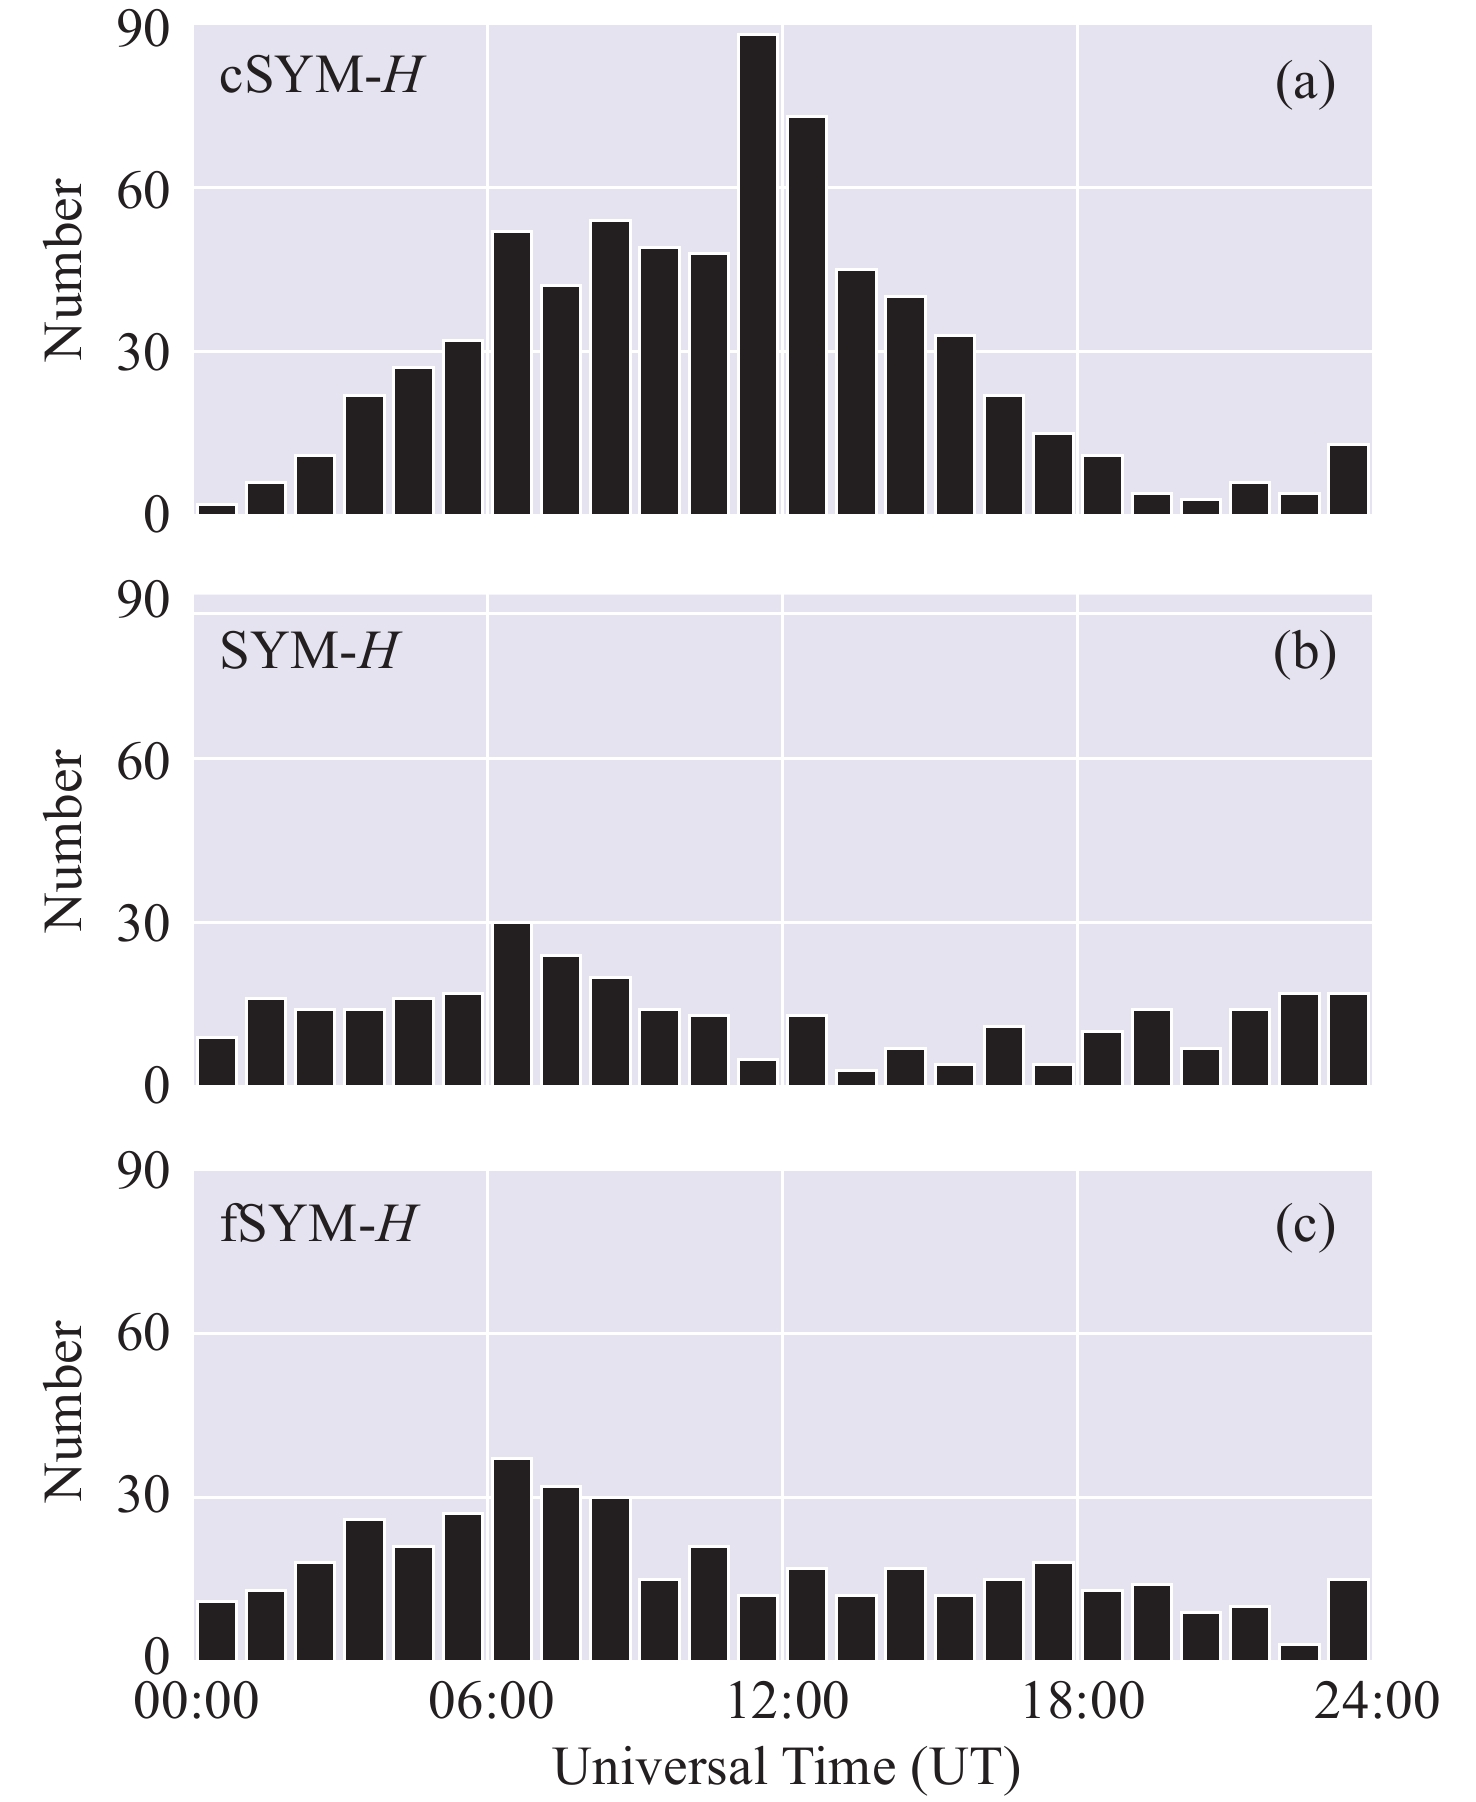
图 13 中国区域磁扰数量(a)、磁暴数量(b)和fSYM-H值判断得到的磁暴数量(c)随UT的分布
Figure 13. Distribution of the number of Chinese geomagnetic disturbances (a), storms (b), and storms determined by fSYM-H values (c) with UT
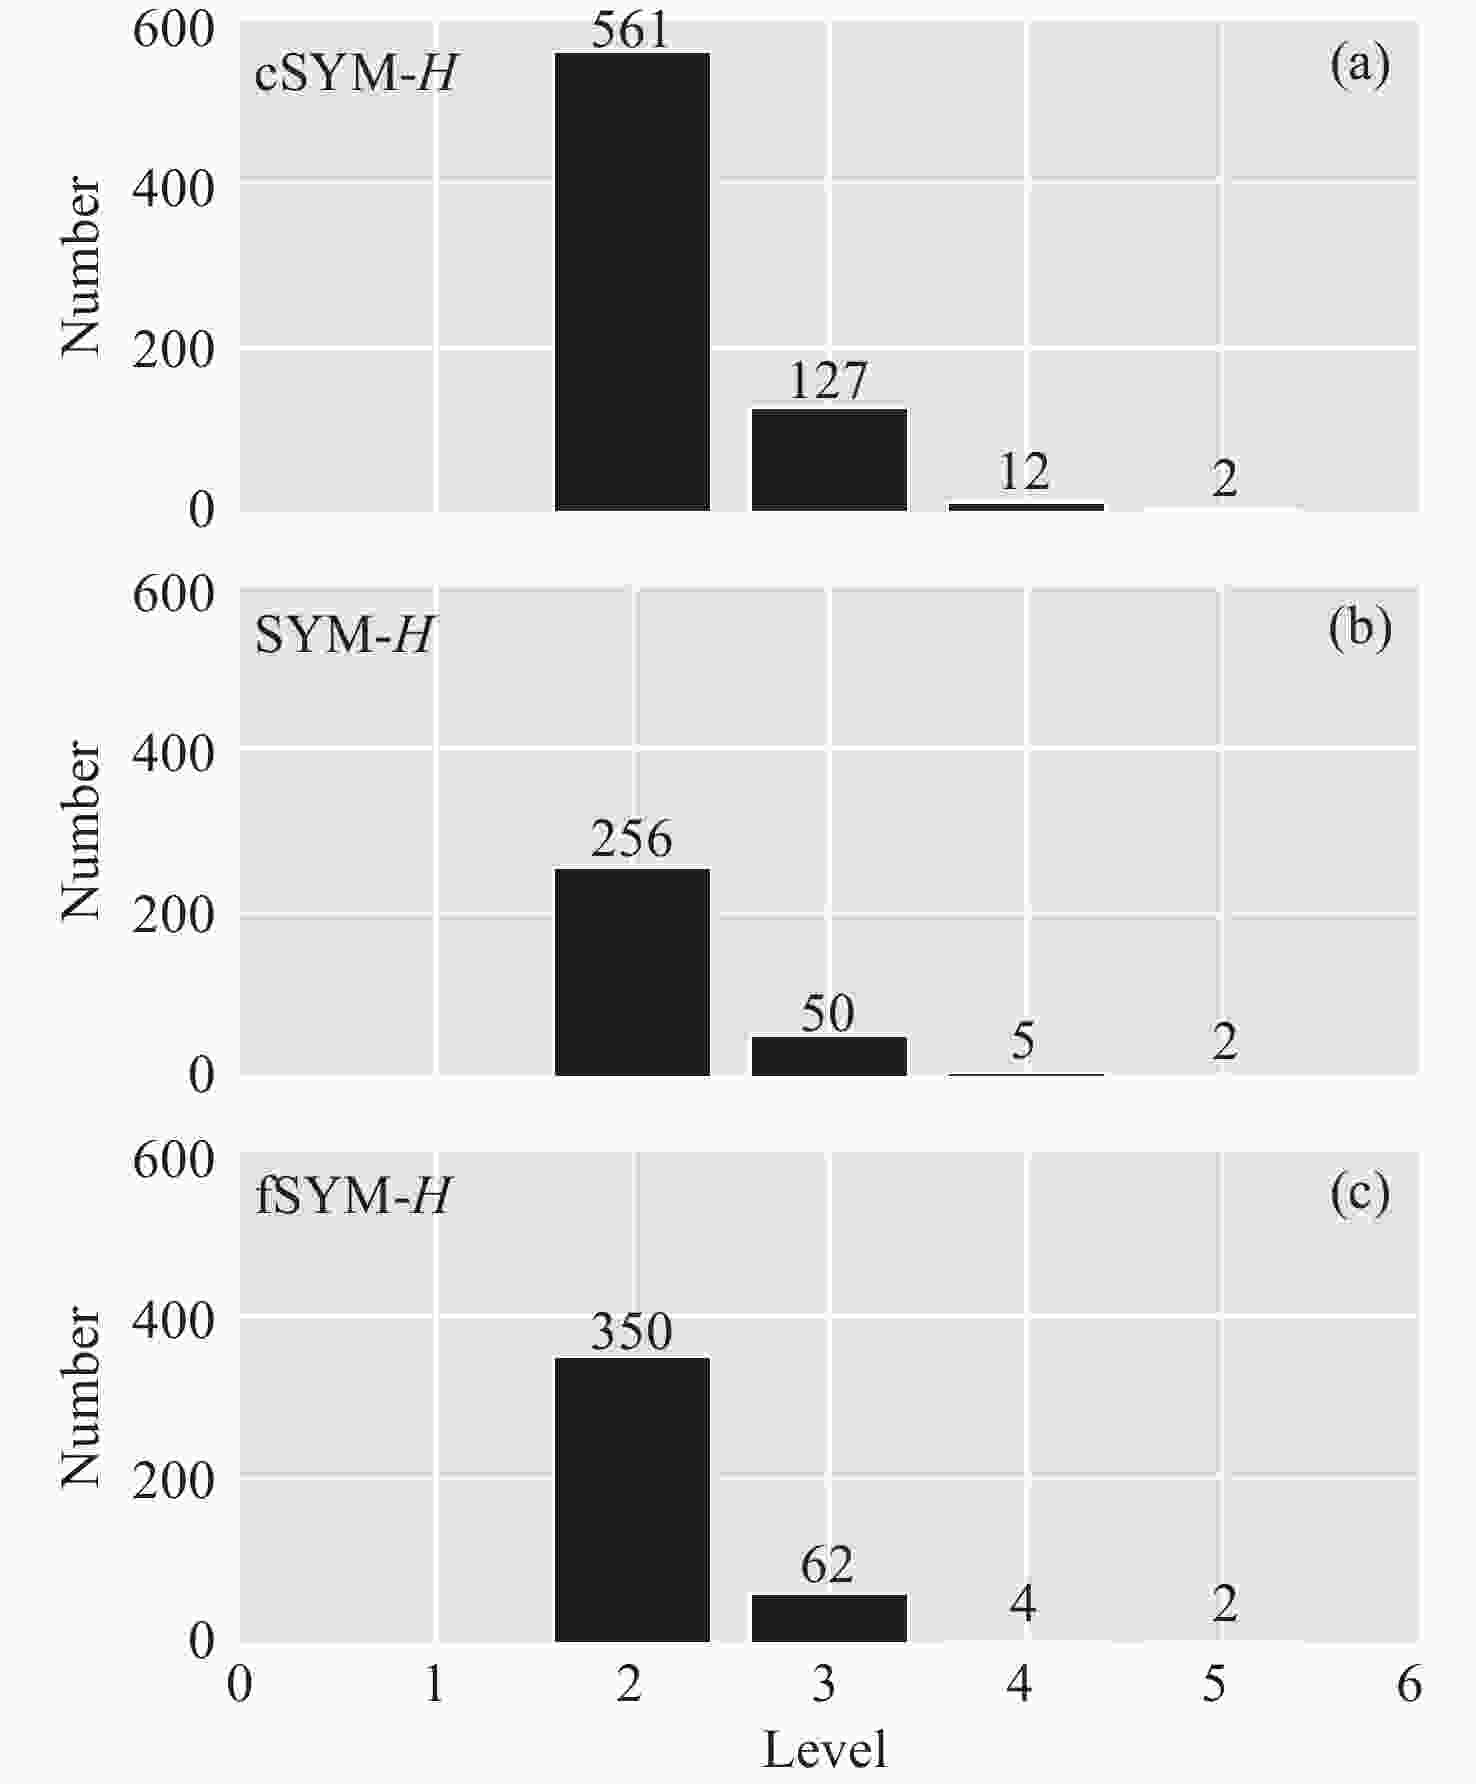
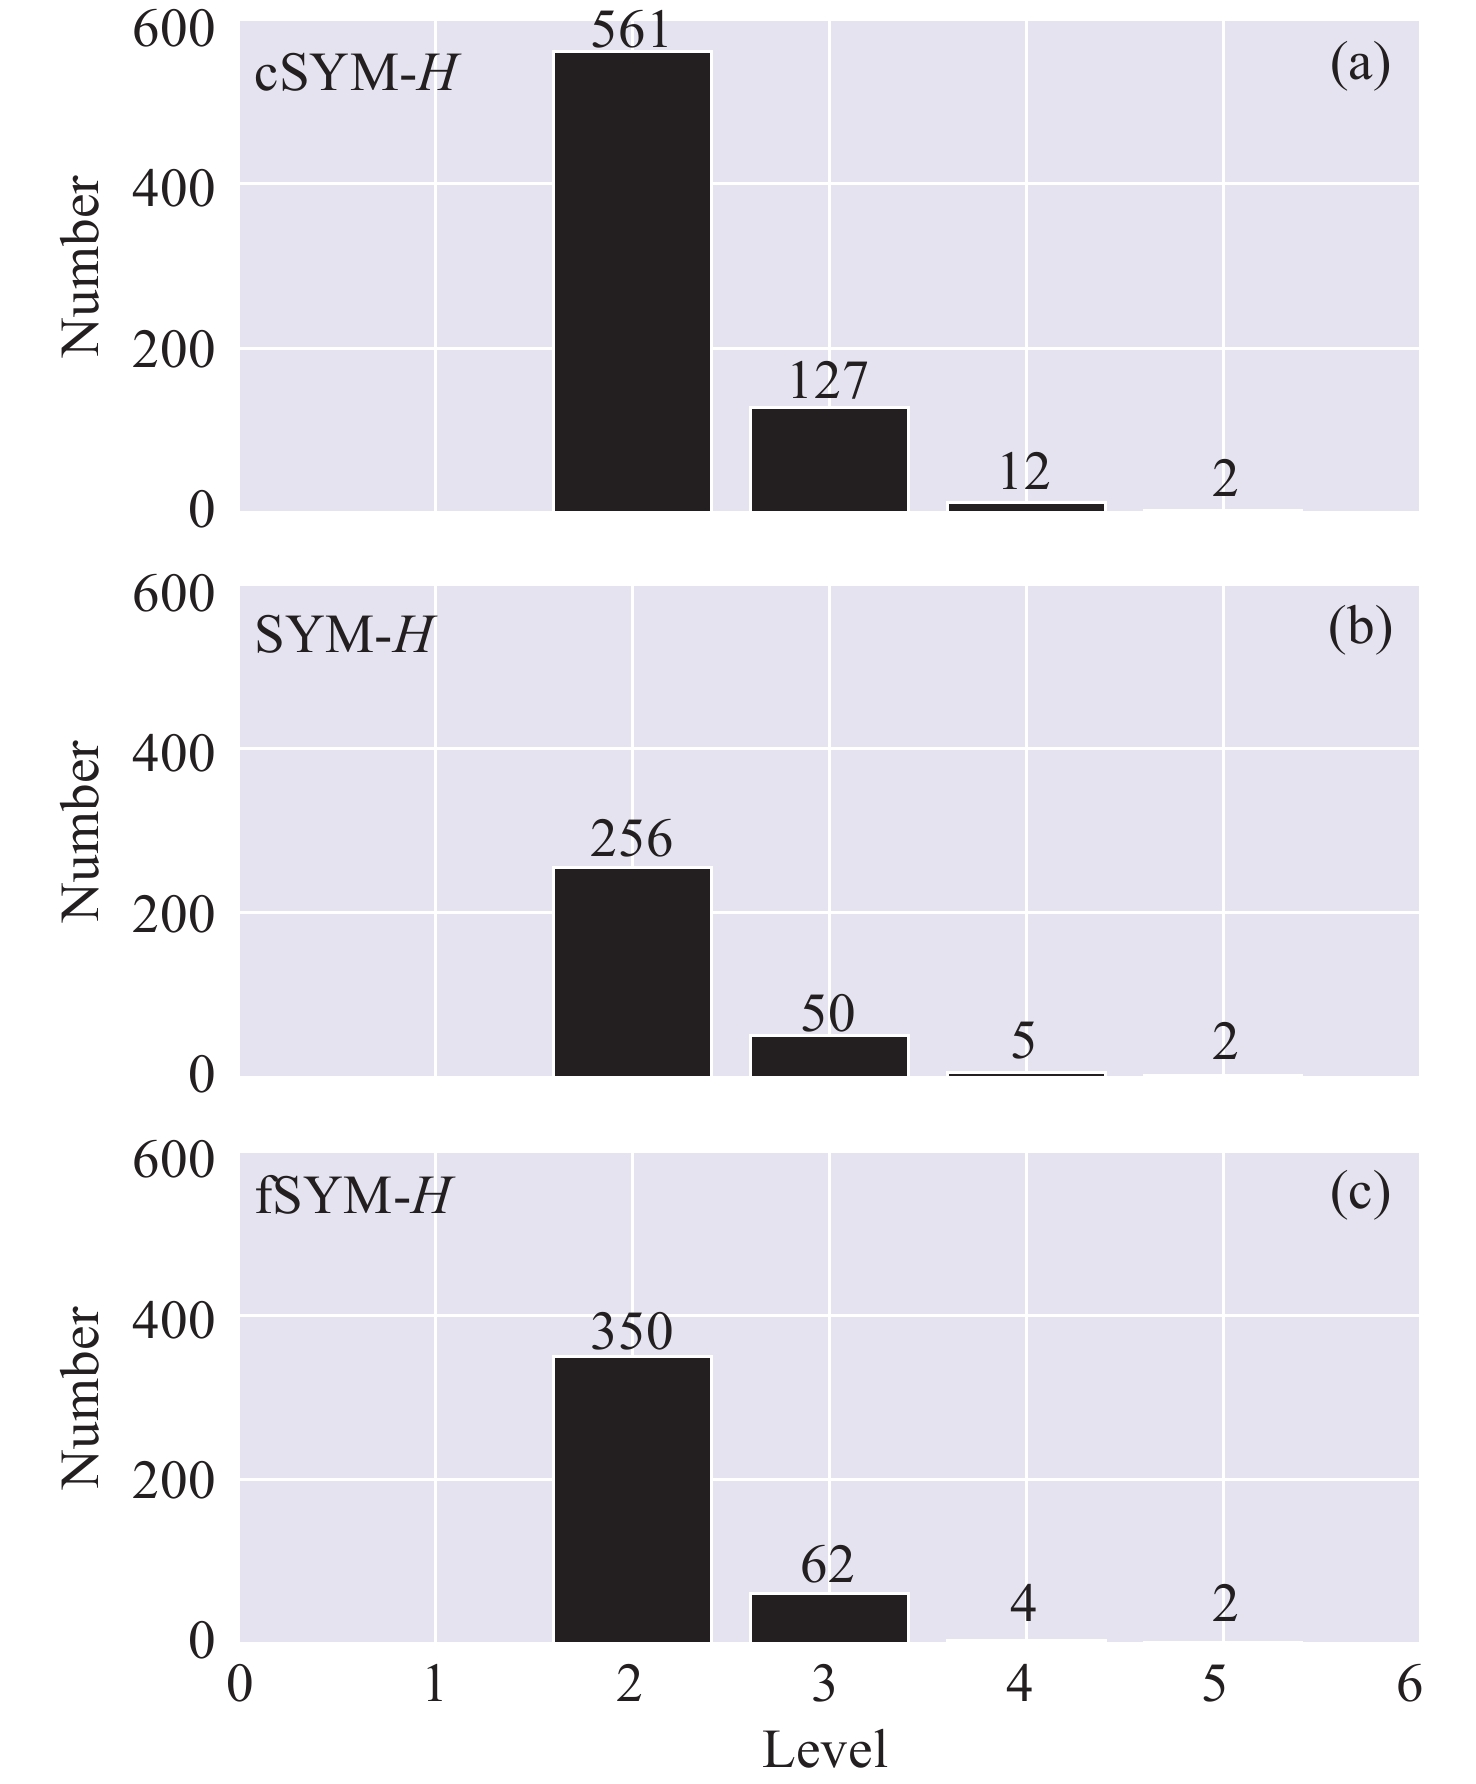
图 14 中国区域磁扰数量(a)、磁暴数量(b)和fSYM-H值判断得到的磁暴数量(c)随等级的分布
Figure 14. Distribution of the number of Chinese geomagnetic disturbances (a), storms (b), and storms determined by fSYM-H values (c) with level
表 1 地磁站点的经纬度信息
Table 1. Longitude and latitude of observatories
序号 站点 经度/ (°)E 纬度/ (°)N 地磁纬度/ (°)N 1 拉萨 91.11 29.64 20.54 2 成都 103.90 30.80 21.36 3 武汉 114.48 30.51 21.12 4 杭州 120.16 30.27 21.04  下载: 导出CSV
表 2 2024年5月和10月磁暴的cDst和Dst极值
Table 2. Minimum values of cDst and Dst of storms in May and October of 2024
序号 日期 时间 中国 cDst/nT Dst/nT cDst/Dst 1 2024-05-11 07:00 UT 昏侧 –442 –412 1.07 2 2024-10-10 23:00 UT 晨侧 –326 –333 0.97
下载: 导出CSV
表 3 Dst与cDst线性关系的系数
Table 3. Parameters of the linear relationship between Dst and cDst
UT a1 a2 b 00:00 1.238 0.848 –31.843 01:00 1.170 0.777 –29.533 02:00 1.120 0.713 –27.305 03:00 1.002 0.666 –25.677 04:00 0.926 0.639 –24.690 05:00 0.881 0.644 –24.452 06:00 0.854 0.670 –24.775 07:00 0.804 0.694 –24.922 08:00 0.737 0.725 –24.983 09:00 0.662 0.744 –24.659 10:00 0.640 0.759 –24.500 11:00 0.599 0.766 –24.123 12:00 0.572 0.785 –24.314 13:00 0.597 0.803 –24.757 14:00 0.622 0.823 –25.491 15:00 0.669 0.871 –27.232 16:00 0.741 0.930 –29.281 17:00 0.798 0.981 –31.037 18:00 0.926 1.004 –31.966 19:00 1.035 1.044 –33.270 20:00 1.201 1.057 –33.559 21:00 1.223 1.052 –33.424 22:00 1.247 1.026 –32.450 23:00 1.285 0.954 –30.164
下载: 导出CSV
表 4 2024年5月和10月磁暴的fDst和Dst极值
Table 4. Minimum values of fDst and Dst of storms in May and October of 2024
序号 日期 时间 中国 fDst/nT Dst/nT 1 2024-05-11 02:00 UT 晨侧 –445 –412 2 2024-10-11 01:00 UT 晨侧 –354 –333
下载: 导出CSV
表 5 2024年5月和10月磁暴的cSYM-H和SYM-H极值
Table 5. Minimum values of cSYM-H and SYM-H of storms in May and October of 2024
序号 日期 时间 中国 cSYM-H SYM-H cSYM-H/SYM-H 1 2024-05-11 07:37 UT 昏侧 –499 –518 0.96 2 2024-10-10 23:12 UT 晨侧 –373 –390 0.96
下载: 导出CSV
表 6 SYM-H和cSYM-H线性关系的系数
Table 6. Parameters of the linear relationship between SYM-H and cSYM-H
UT a1 a2 b 00:00 1.100 0.859 –32.787 01:00 1.035 0.791 –30.851 02:00 1.089 0.713 –28.328 03:00 1.020 0.664 –26.452 04:00 0.983 0.639 –25.523 05:00 0.935 0.641 –25.251 06:00 0.897 0.668 –25.424 07:00 0.838 0.686 –25.375 08:00 0.761 0.712 –25.428 09:00 0.681 0.724 –25.087 10:00 0.662 0.725 –24.442 11:00 0.620 0.728 –24.066 12:00 0.604 0.735 –24.062 13:00 0.639 0.739 –23.967 14:00 0.668 0.754 –24.253 15:00 0.708 0.774 –24.971 16:00 0.765 0.818 –26.211 17:00 0.830 0.856 –27.468 18:00 0.895 0.902 –29.252 19:00 0.960 0.955 –30.970 20:00 0.999 0.995 –32.112 21:00 0.969 1.012 –32.634 22:00 0.938 1.004 –32.250 23:00 1.042 0.936 –30.137
下载: 导出CSV
表 7 2024年5月和10月磁暴的fSYM-H和SYM-H极值
Table 7. Minimum values of fSYM-H and SYM-H of storms in May and October of 2024
序号 日期 时间 中国 fSYM-H/nT SYM-H/nT 1 2024-05-11 01:51 UT 昏侧 –485 –518 2 2024-10-11 23:12 UT 晨侧 –387 –390
下载: 导出CSV
-
[1] DONNER R V, BALASIS G, STOLBOVA V, et al. Recurrence-based quantification of dynamical complexity in the earth’s magnetosphere at geospace storm timescales[J]. Journal of Geophysical Research: Space Physics, 2019, 124(1): 90-108 doi: 10.1029/2018ja025318 [2] CHANG T. Low-dimensional behavior and symmetry breaking of stochastic systems near criticality―can these effects be observed in space and in the laboratory?[J]. IEEE Transactions on Plasma Science, 1992, 20(6): 691-694 doi: 10.1109/27.199515 [3] CONSOLINI G, ALBERTI T, DE MICHELIS P. On the forecast horizon of magnetospheric dynamics: a scale-to-scale approach[J]. Journal of Geophysical Research: Space Physics, 2018, 123(11): 9065-9077 doi: 10.1029/2018ja025952 [4] KLIMAS A J, VASSILIADIS D, BAKER D N, et al. The organized nonlinear dynamics of the magnetosphere[J]. Journal of Geophysical Research: Space Physics, 1996, 101(A6): 13089-13113 doi: 10.1029/96ja00563 [5] VALDIVIA J A, ROGAN J, MUÑOZ V, et al. The magnetosphere as a complex system[J]. Advances in Space Research, 2005, 35(5): 961-971 doi: 10.1016/j.asr.2005.03.144 [6] WATKINS N W, FREEMAN M P, CHAPMAN S C, et al. Testing the SOC hypothesis for the magnetosphere[J]. Journal of Atmospheric and Solar-Terrestrial Physics, 2001, 63(13): 1435-1445 doi: 10.1016/s1364-6826(00)00245-5 [7] DAGLIS I A, THORNE R M, BAUMJOHANN W, et al. The terrestrial ring current: origin, formation, and decay[J]. Reviews of Geophysics, 1999, 37(4): 407-438 doi: 10.1029/1999RG900009 [8] BOTHMER V, DAGLIS I A. Space Weather: Physics and Effects[M]. Berlin: Springer, 2007. DOI: 10.1007/978-3-540-34578-7 [9] SUGIURA M. Hourly values of equatorial DstDst for the IGY[J]. Annals of the International Geophysical Year, 1964, 35: 49 [10] KOTZÉ P B. Hermanus magnetic observatory: a historical perspective of geomagnetism in southern Africa[J]. History of Geo- and Space Sciences, 2018, 9(2): 125-131 doi: 10.5194/hgss-9-125-2018 [11] MINAMOTO Y. Availability and access to data from Kakioka magnetic observatory, Japan[J]. Data Science Journal, 2013, 12: G30-G35 doi: 10.2481/dsj.G-040 [12] LOVE J J, FINN C A. The USGS geomagnetism program and its role in space weather monitoring[J]. Space Weather, 2011, 9(7): S07001 doi: 10.1029/2011SW000684 [13] LOEWE C A, PRÖLSS G W. Classification and mean behavior of magnetic storms[J]. Journal of Geophysical Research: Space Physics, 1997, 102(A7): 14209-14213 doi: 10.1029/96JA04020 [14] GONZALEZ W D, JOSELYN J A, KAMIDE Y, et al. What is a geomagnetic storm?[J]. Journal of Geophysical Research: Space Physics, 1994, 99(A4): 5771-5792 doi: 10.1029/93JA02867 [15] DAGLIS I A. Ring current dynamics[J]. Space Science Reviews, 2006, 124(1/2/3/4): 183-202 doi: 10.1007/s11214-006-9104-z [16] BOROVSKY J E, SHPRITS Y Y. Is the DstDst index sufficient to define all geospace storms?[J]. Journal of Geophysical Research: Space Physics, 2017, 122(11): 11543-11547 doi: 10.1002/2017ja024679 [17] KAMIDE Y, BAUMJOHANN W, DAGLIS I A, et al. Current understanding of magnetic storms: storm-substorm relationships[J]. Journal of Geophysical Research: Space Physics, 1998, 103(A8): 17705-17728 doi: 10.1029/98JA01426 [18] LANZEROTTI L J. Comment on “Great magnetic storms” by Tsurutani et al.[J]. Geophysical Research Letters, 1992, 19(19): 1991-1992 doi: 10.1029/92GL02238 [19] GANUSHKINA N, JAYNES A, LIEMOHN M. Space weather effects produced by the ring current particles[J]. Space Science Reviews, 2017, 212(3): 1315-1344 doi: 10.1007/s11214-017-0412-2 [20] WELLING D. Magnetohydrodynamic models of B and their use in GIC estimates[M]//GANNON J L, SWIDINSKY A, XU Z H. Geomagnetically Induced Currents from the Sun to the Power Grid. Washington: American Geophysical Union, 2019: 43-65. DOI: 10.1002/9781119434412.ch3 [21] LUCAS G M, LOVE J J, KELBERT A, et al. A 100-year geoelectric hazard analysis for the U. S. high-voltage power grid[J]. Space Weather, 2020, 18(2): e2019SW002329 doi: 10.1029/2019SW002329 [22] NGWIRA C M, PULKKINEN A, WILDER V, et al. Extended study of extreme geoelectric field event scenarios for geomagnetically induced current applications[J]. Space Weather, 2013, 11(3): 121-131 doi: 10.1002/swe.20021 [23] OUGHTON E J, SKELTON A, HORNE R B, et al. Quantifying the daily economic impact of extreme space weather due to failure in electricity transmission infrastructure[J]. Space Weather, 2017, 15(1): 65-83 doi: 10.1002/2016SW001491 [24] PULKKINEN A, BERNABEU E, EICHNER J, et al. Generation of 100-year geomagnetically induced current scenarios[J]. Space Weather, 2012, 10(4): S04003 doi: 10.1029/2011SW000750 [25] WOODROFFE J R, MORLEY S K, JORDANOVA V K, et al. The latitudinal variation of geoelectromagnetic disturbances during large (DstDst≤–100 nT) geomagnetic storms[J]. Space Weather, 2016, 14(9): 668-681 doi: 10.1002/2016SW001376 [26] ASTAFYEVA E, YASYUKEVICH Y, MAKSIKOV A, et al. Geomagnetic storms, super-storms, and their impacts on GPS-based navigation systems[J]. Space Weather, 2014, 12(7): 508-525 doi: 10.1002/2014SW001072 [27] BASU S, BASU S, MACKENZIE E, et al. Specification of the occurrence of equatorial ionospheric scintillations during the main phase of large magnetic storms within solar cycle 23[J]. Radio Science, 2010, 45(5): RS5009 doi: 10.1029/2009RS004343 [28] BOWMAN B R, TOBISKA W K, MARCOS F A, et al. A new empirical thermospheric density model JB2008 using new solar and geomagnetic indices[C]//Proceedings of the AIAA/AAS Astrodynamics Specialist Conference and Exhibit. Honolulu: AIAA, 2008: AIAA 2008-6438. DOI: 10.2514/6.2008-6438 [29] GUO J P, FENG X S, FORBES J M, et al. On the relationship between thermosphere density and solar wind parameters during intense geomagnetic storms[J]. Journal of Geophysical Research: Space Physics, 2010, 115(A12): A12335 doi: 10.1029/2010JA015971 [30] OLIVEIRA D M, ZESTA E. Satellite orbital drag during magnetic storms[J]. Space Weather, 2019, 17(11): 1510-1533 doi: 10.1029/2019SW002287 [31] RANGARAJAN G. Indices of geomagnetic activity[M]//JACOBS J A. Geomagnetism. London: Academic Press, 1989: 323-384 [32] SICILIANO F, CONSOLINI G, TOZZI R, et al. Forecasting SYM-H index: a comparison between long short-term memory and convolutional neural networks[J]. Space Weather, 2021, 19(2): e2020SW002589 doi: 10.1029/2020SW002589 [33] VICHARE G, THOMAS N, SHIOKAWA K, et al. Spatial gradients in geomagnetic storm time currents observed by Swarm multispacecraft mission[J]. Journal of Geophysical Research: Space Physics, 2019, 124(2): 982-995 doi: 10.1029/2018JA025692 [34] WANLISS J A, SHOWALTER K M. High-resolution global storm index: DstDst versus SYM-H[J]. Journal of Geophysical Research: Space Physics, 2006, 111(A2): A02202 doi: 10.1029/2005JA011034 [35] KOZYRA J U, LIEMOHN M W. Ring current energy input and decay[J]. Space Science Reviews, 2003, 109(1/2/3/4): 105-131 doi: 10.1023/B:SPAC.0000007516.10433.ad [36] YU Y Q, RIDLEY A J, WELLING D T, et al. Including gap region field-aligned currents and magnetospheric currents in the MHD calculation of ground-based magnetic field perturbations[J]. Journal of Geophysical Research: Space Physics, 2010, 115(A8): A08207 doi: 10.1029/2009JA014869 -
-

 下载:
下载:

计量
- 文章访问数: 1061
- HTML全文浏览量: 126
- PDF下载量: 165
-
被引次数:
0(来源:Crossref)
0(来源:其他)

