


兴隆台站OH (3-1) 转动温度的反演与分析
doi: 10.11728/cjss2026.05.2026-0043 cstr: 32142.14.cjss.2026-0043
-
 李敏 女, 2000年8月出生于云南省大理市, 现为中国科学院国家空间科学中心太阳活动与空间天气全国重点实验室硕士研究生, 主要研究方向为中高层大气物理. E-mail: limin233@mails.ucas.ac.cn
 -
 朱亚军 男, 1985年8月出生, 中国科学院国家空间科学中心研究员, 博士生导师, 主要研究方向为中高层大气动力学、光化学以及辐射等物理过程和机制、中高层大气地基和卫星探测数的分析和反演算法, 以及被动光学遥感探测仪器的研发等. E-mail: y.zhu@swl.ac.cn
作者简介:
通讯作者:
Retrieval and Analysis of OH (3-1) Rotational Temperature at Xinglong Station
-
摘要: 中间层顶是地球大气响应太阳活动和低层大气波动变化的关键区域, 中间层顶温度是理解中高层大气动力过程和气候变化的重要参数, OH气辉的转动温度常被用于监测中间层顶区域的长期变化. 为研究该区域温度的长期变化, 使用中国兴隆台站(40°24'N, 117°35'E)地基红外光谱仪(Ground-Based Infrared Spectrometer, GBIS)在2017-2024年的OH (3-1)气辉光谱数据, 通过多光谱全局优化拟合算法反演得到OH气辉的转动温度. 研究发现, OH (3-1)转动温度在2017-2024年年平均转动温度平均值为199.3 K, 且呈现出显著的季节性变化特征, 表现为冬季温度高、夏季温度低, 年周期振幅约为11.6 K, 为主导季节振荡成分; 其年际变化与太阳活动变化具有良好的对应关系, 夏季和冬季平均温度均呈上升趋势, 其中冬季增温速率明显高于夏季. 研究表明, 兴隆地区中间层顶温度变化受到太阳活动和大气动力过程的共同调制, OH (3-1)转动温度可作为监测中间层顶长期温度变化的重要指标.
-
关键词:
- OH (3-1)转动温度 /
- GBIS /
- 多光谱全局优化拟合算法 /
- 反演
Abstract: Mesopause is a key region that responds to solar activity and wave perturbations originating from the lower atmosphere. Temperature in this region is an essential parameter for understanding the dynamical processes and climate change in the middle and upper atmosphere. Rotational temperature of OH airglow is widely used to monitor long-term temperature variations near the mesopause. To investigate the long-term temperature variability in this region, OH (3-1) airglow spectra obtained by a Ground-Based Infrared Spectrometer (GBIS) at Xinglong Station (40°24'N, 117°35'E), China, from 2017 to 2024 were analyzed. The OH rotational temperature was retrieved using a multispectral global optimization fitting algorithm. The reliability of the retrieved temperatures was verified through comparisons with independent measurements from the TIMED satellite and the co-located SpectroMeter of Atmospheric RadiaTion (SMART), showing overall good agreement. The results indicate that the average of annual OH (3-1) rotational temperature during 2017–2024 was 199.3 K and exhibited pronounced seasonal variability, characterized by higher temperatures in winter and lower temperatures in summer. Lomb-Scargle spectral analysis identified the annual oscillation as the dominant periodic component, with an average amplitude of approximately 11.6 K. Furthermore, the interannual variation of the annual mean temperature showed good agreement with changes in solar activity, while both summer and winter mean temperatures exhibited increasing trends throughout the study period, with winter temperatures increasing more rapidly than summer temperatures. These findings suggest that the temperature variability in the mesopause region above Xinglong is jointly influenced by solar activity and atmospheric dynamical processes. The long-term OH (3-1) rotational temperature observations presented in this study demonstrate the capability of GBIS measurements for monitoring long-term temperature variations in the mesopause region and provide valuable observational evidence for understanding the response of the middle and upper atmosphere to external forcing and dynamical processes. -
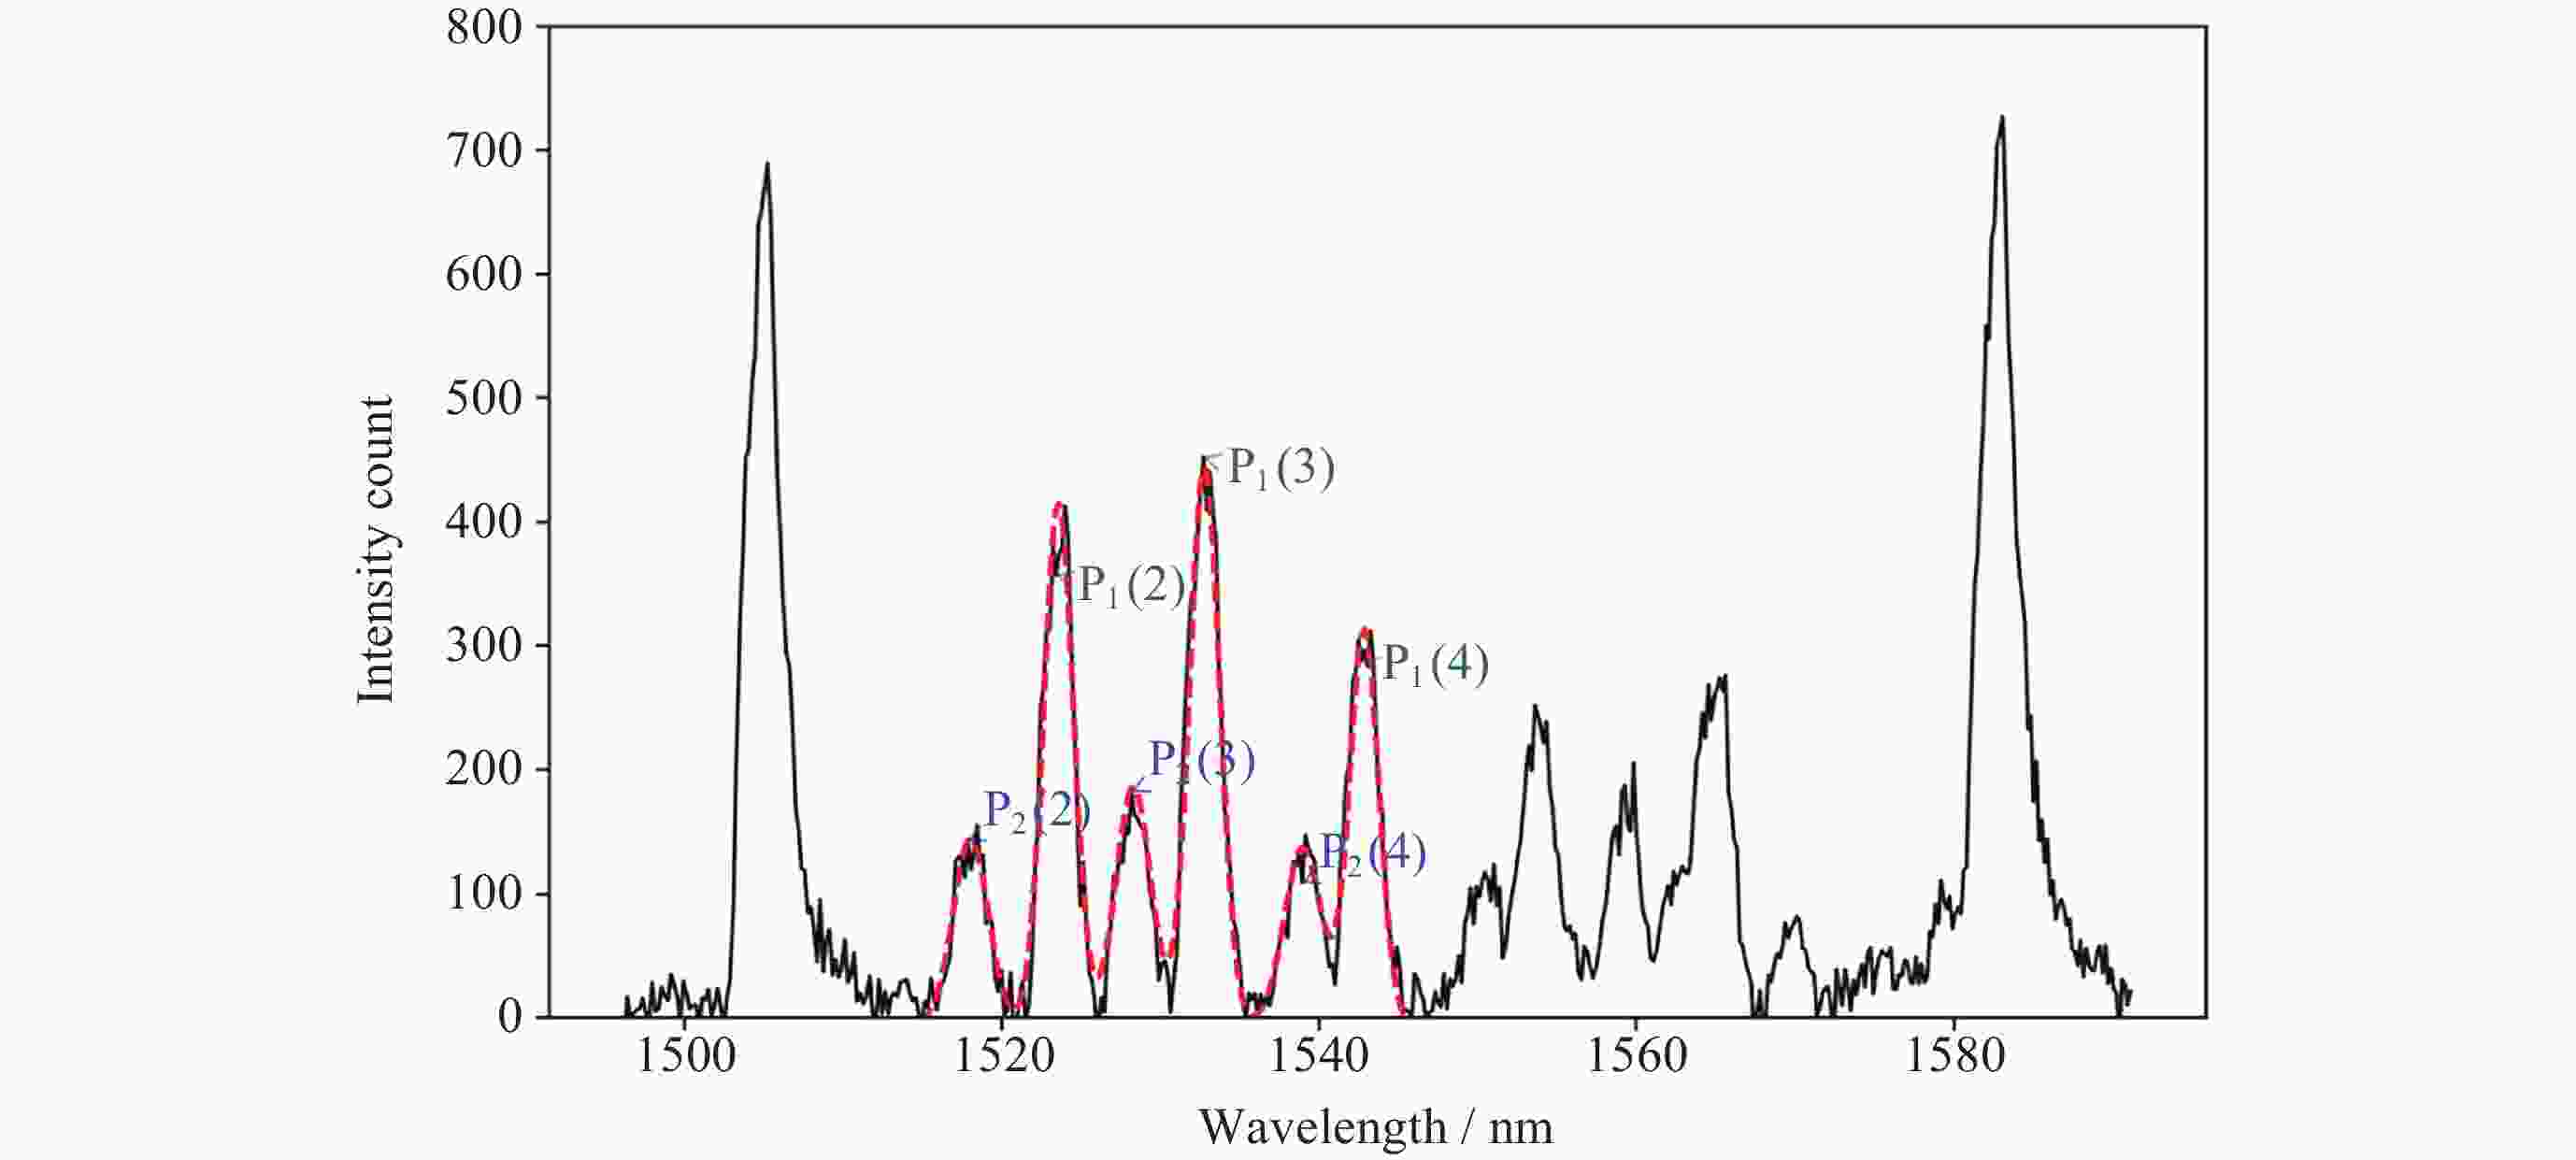
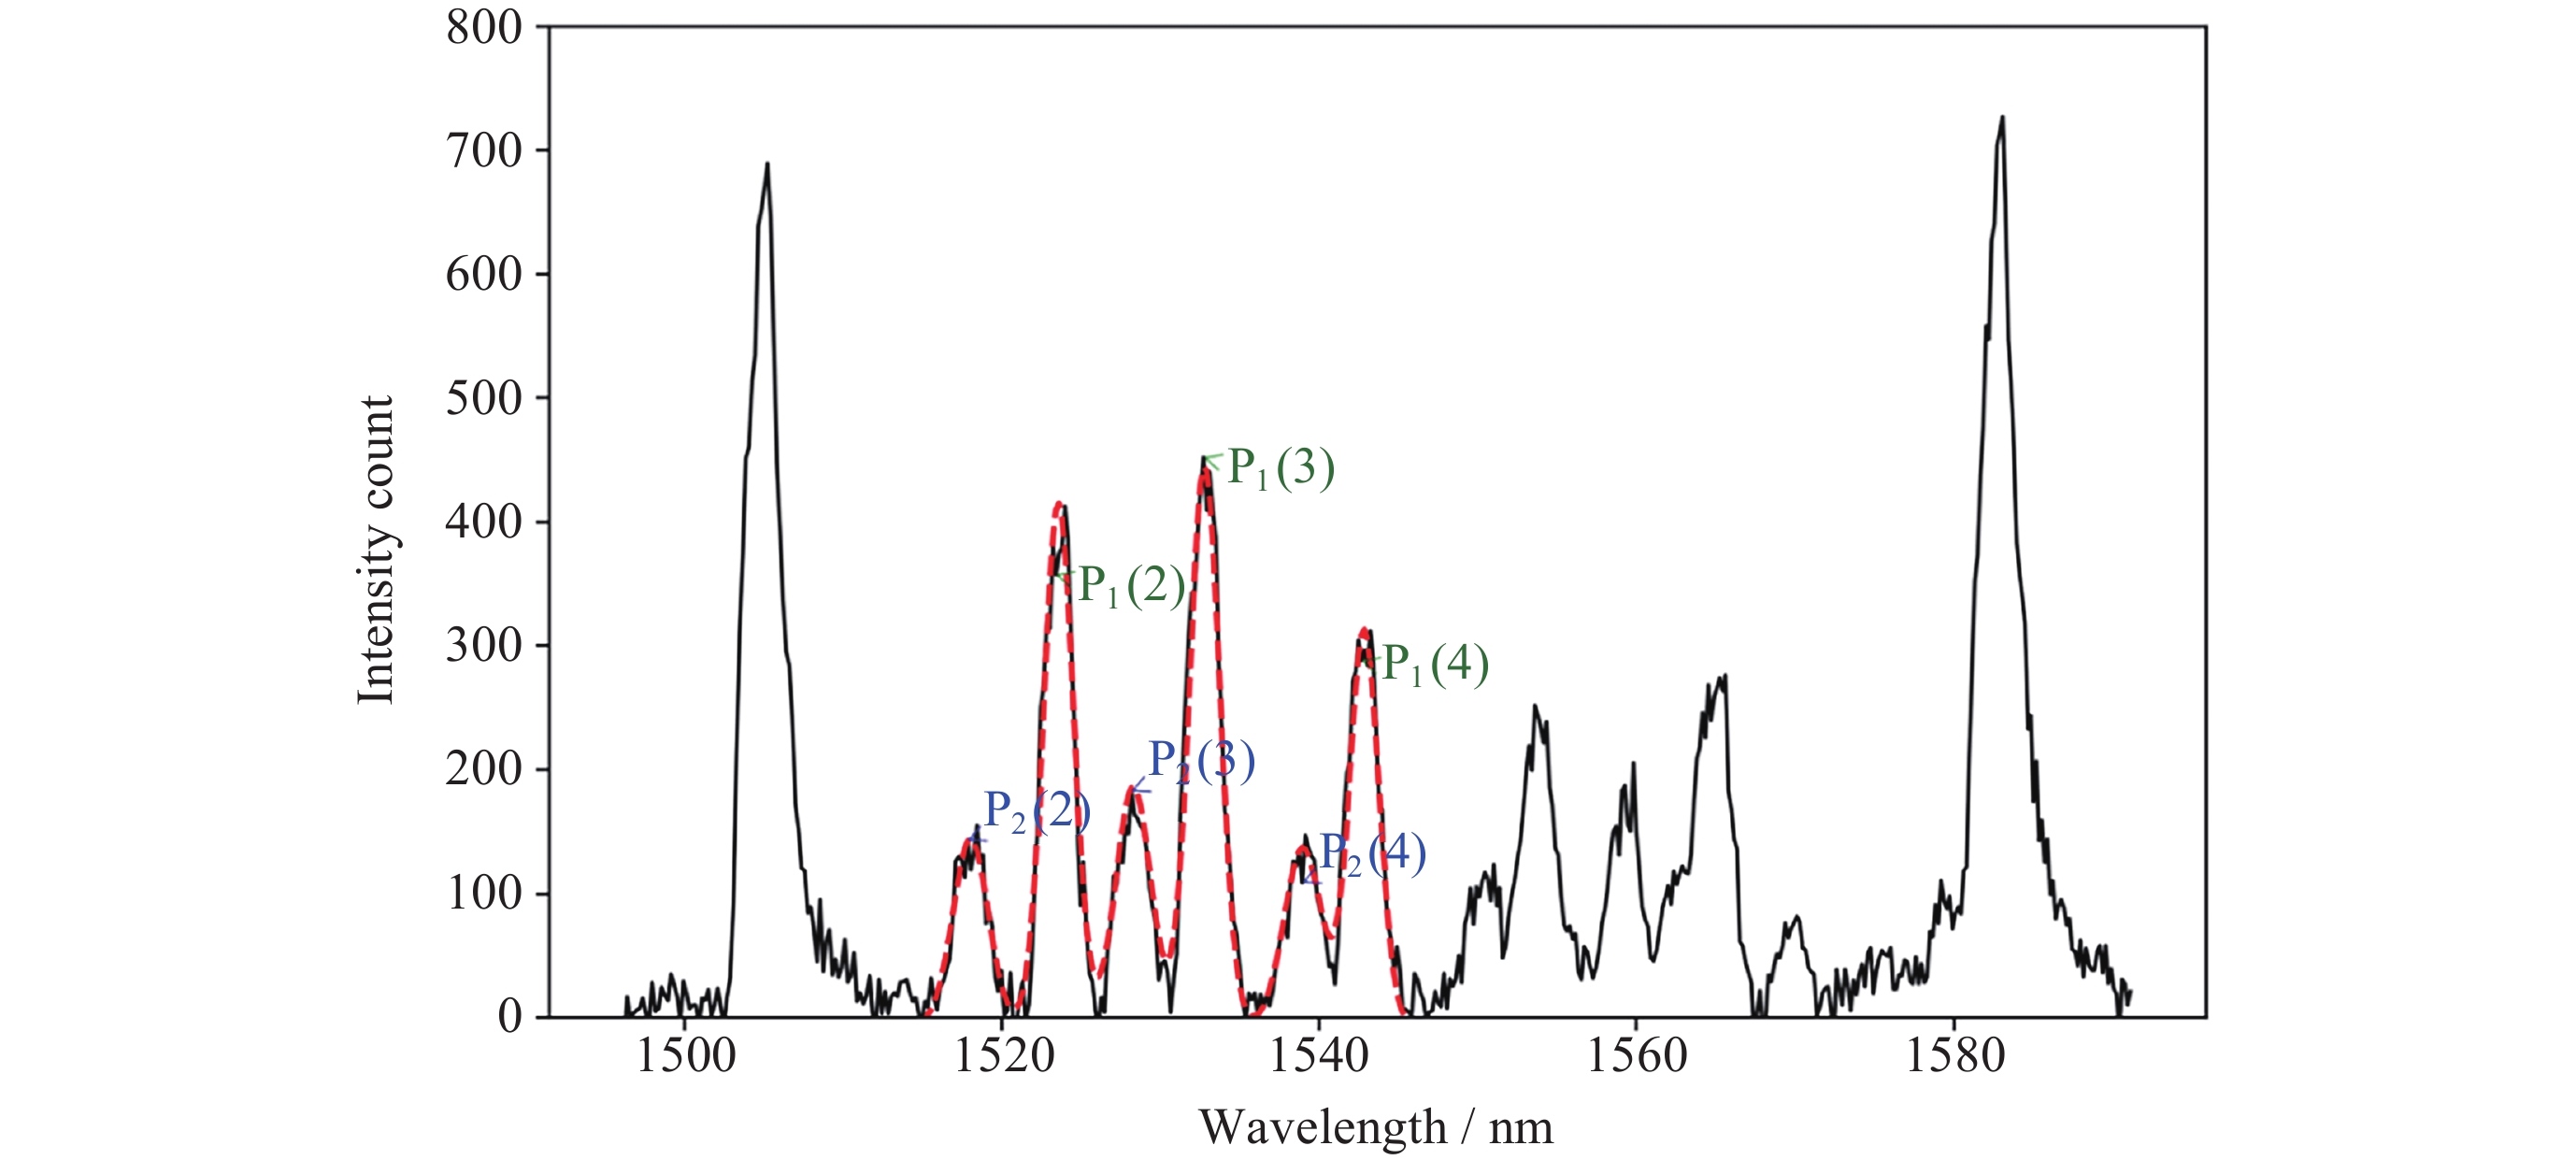
图 1 2024年12月9日兴隆台站地基红外光谱仪(GBIS)观测的OH夜气辉光谱. 黑色曲线表示实际观测得到的光谱, 红色虚线表示通过多光谱全局优化拟合算法得到的结果
Figure 1. OH nightglow spectrum observed by Ground-Based Infrared Spectrometer (GBIS) at Xinglong Station on 9 December 2024. The black curve represents the actual observed spectrum, and the red dashed line shows the fitting result by using the multispectral global optimization fitting algorithm
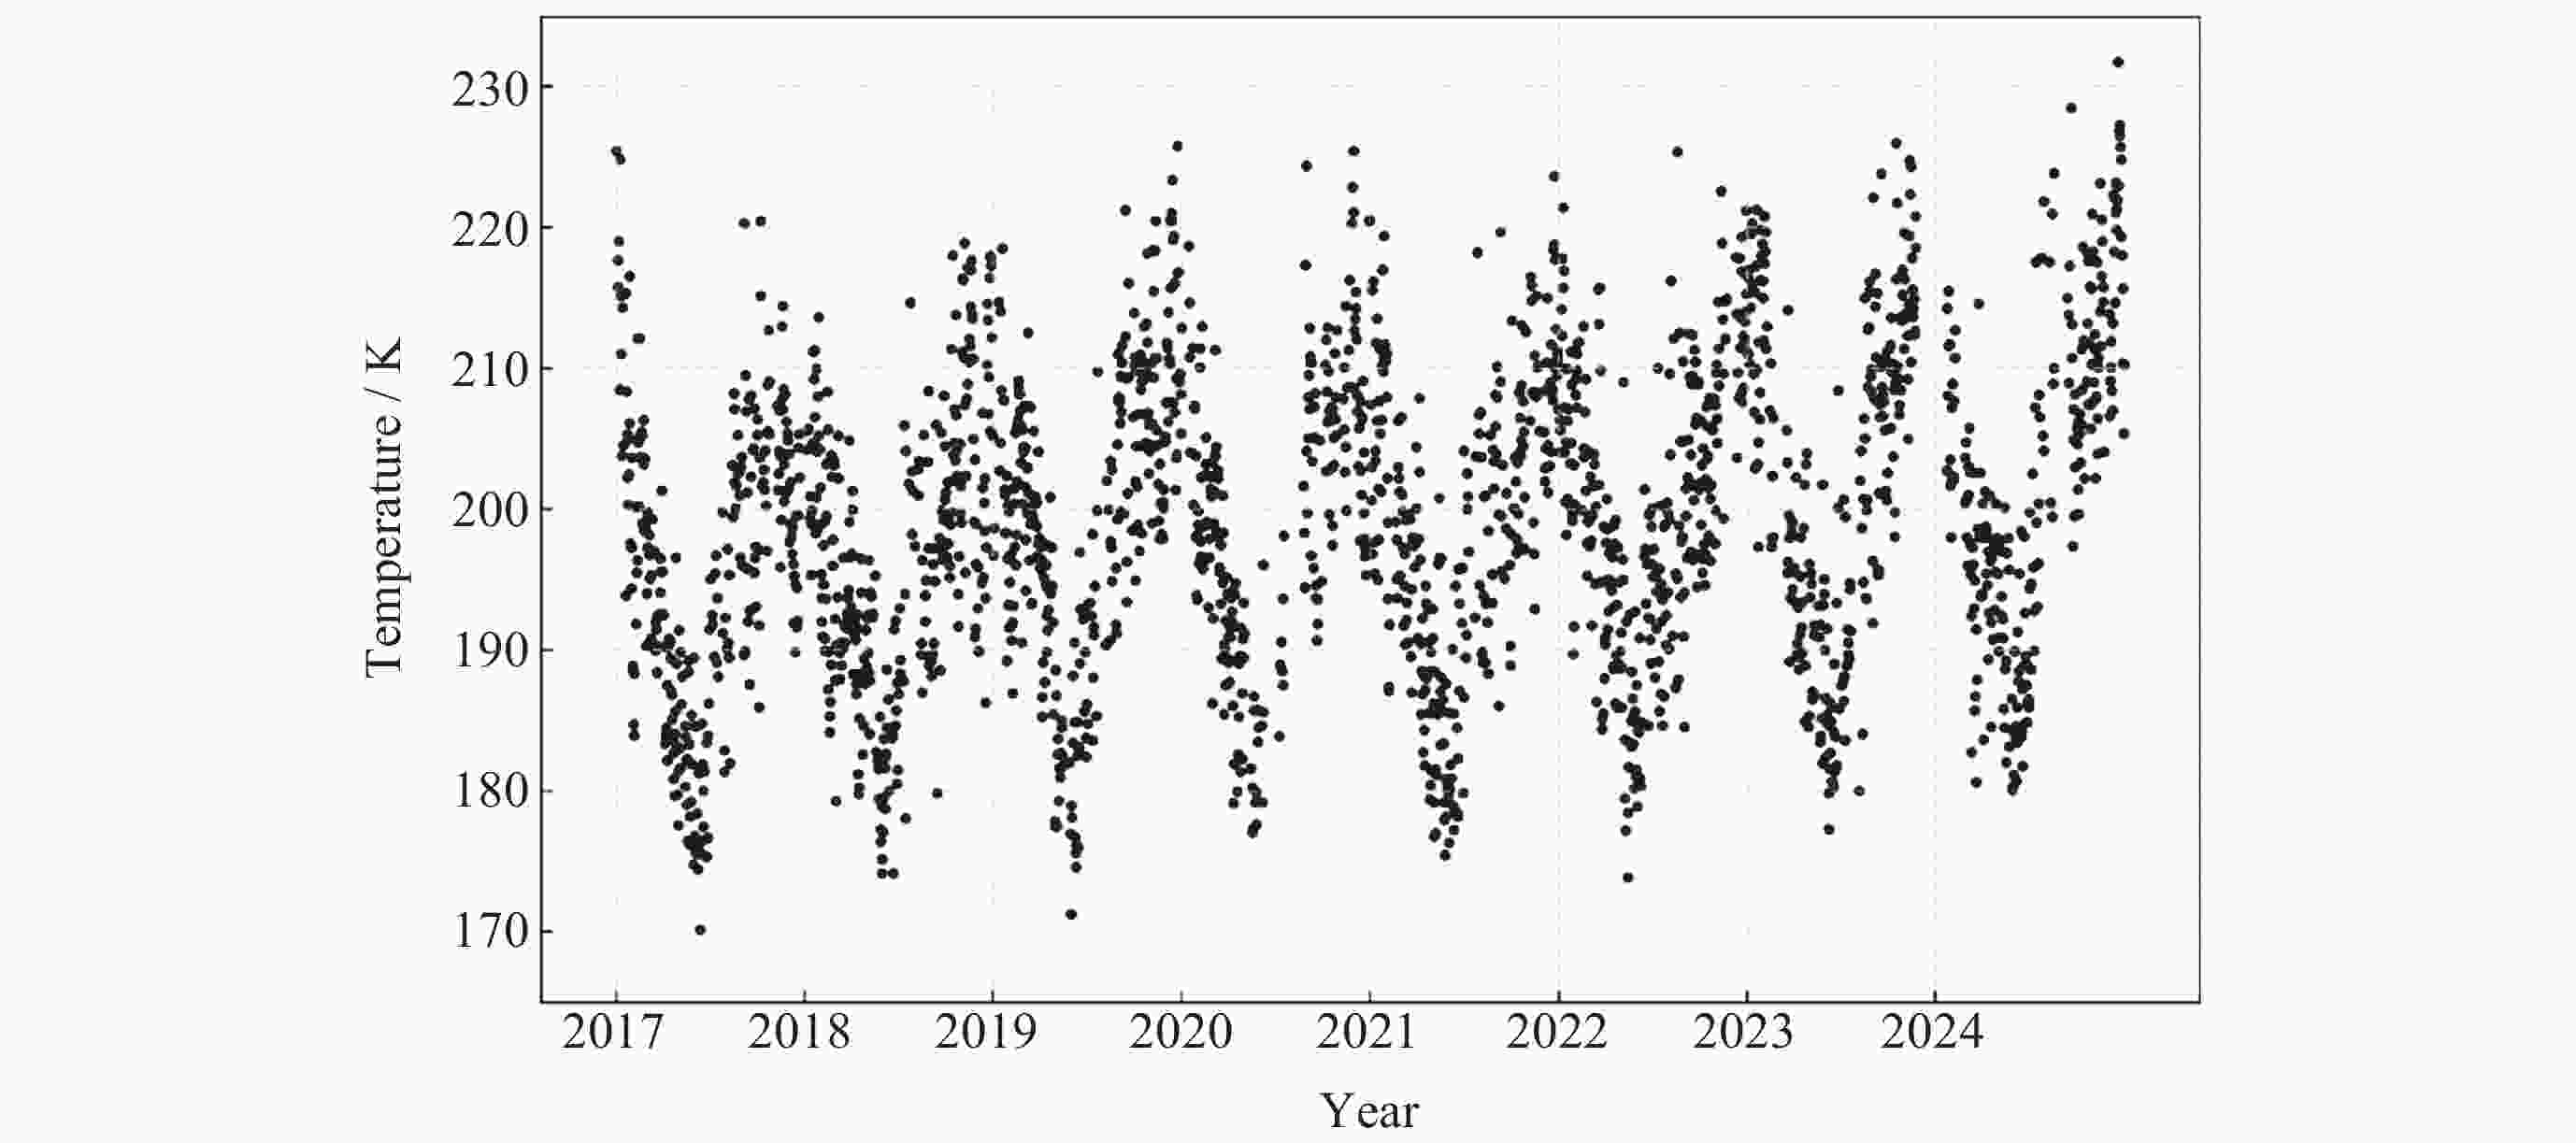
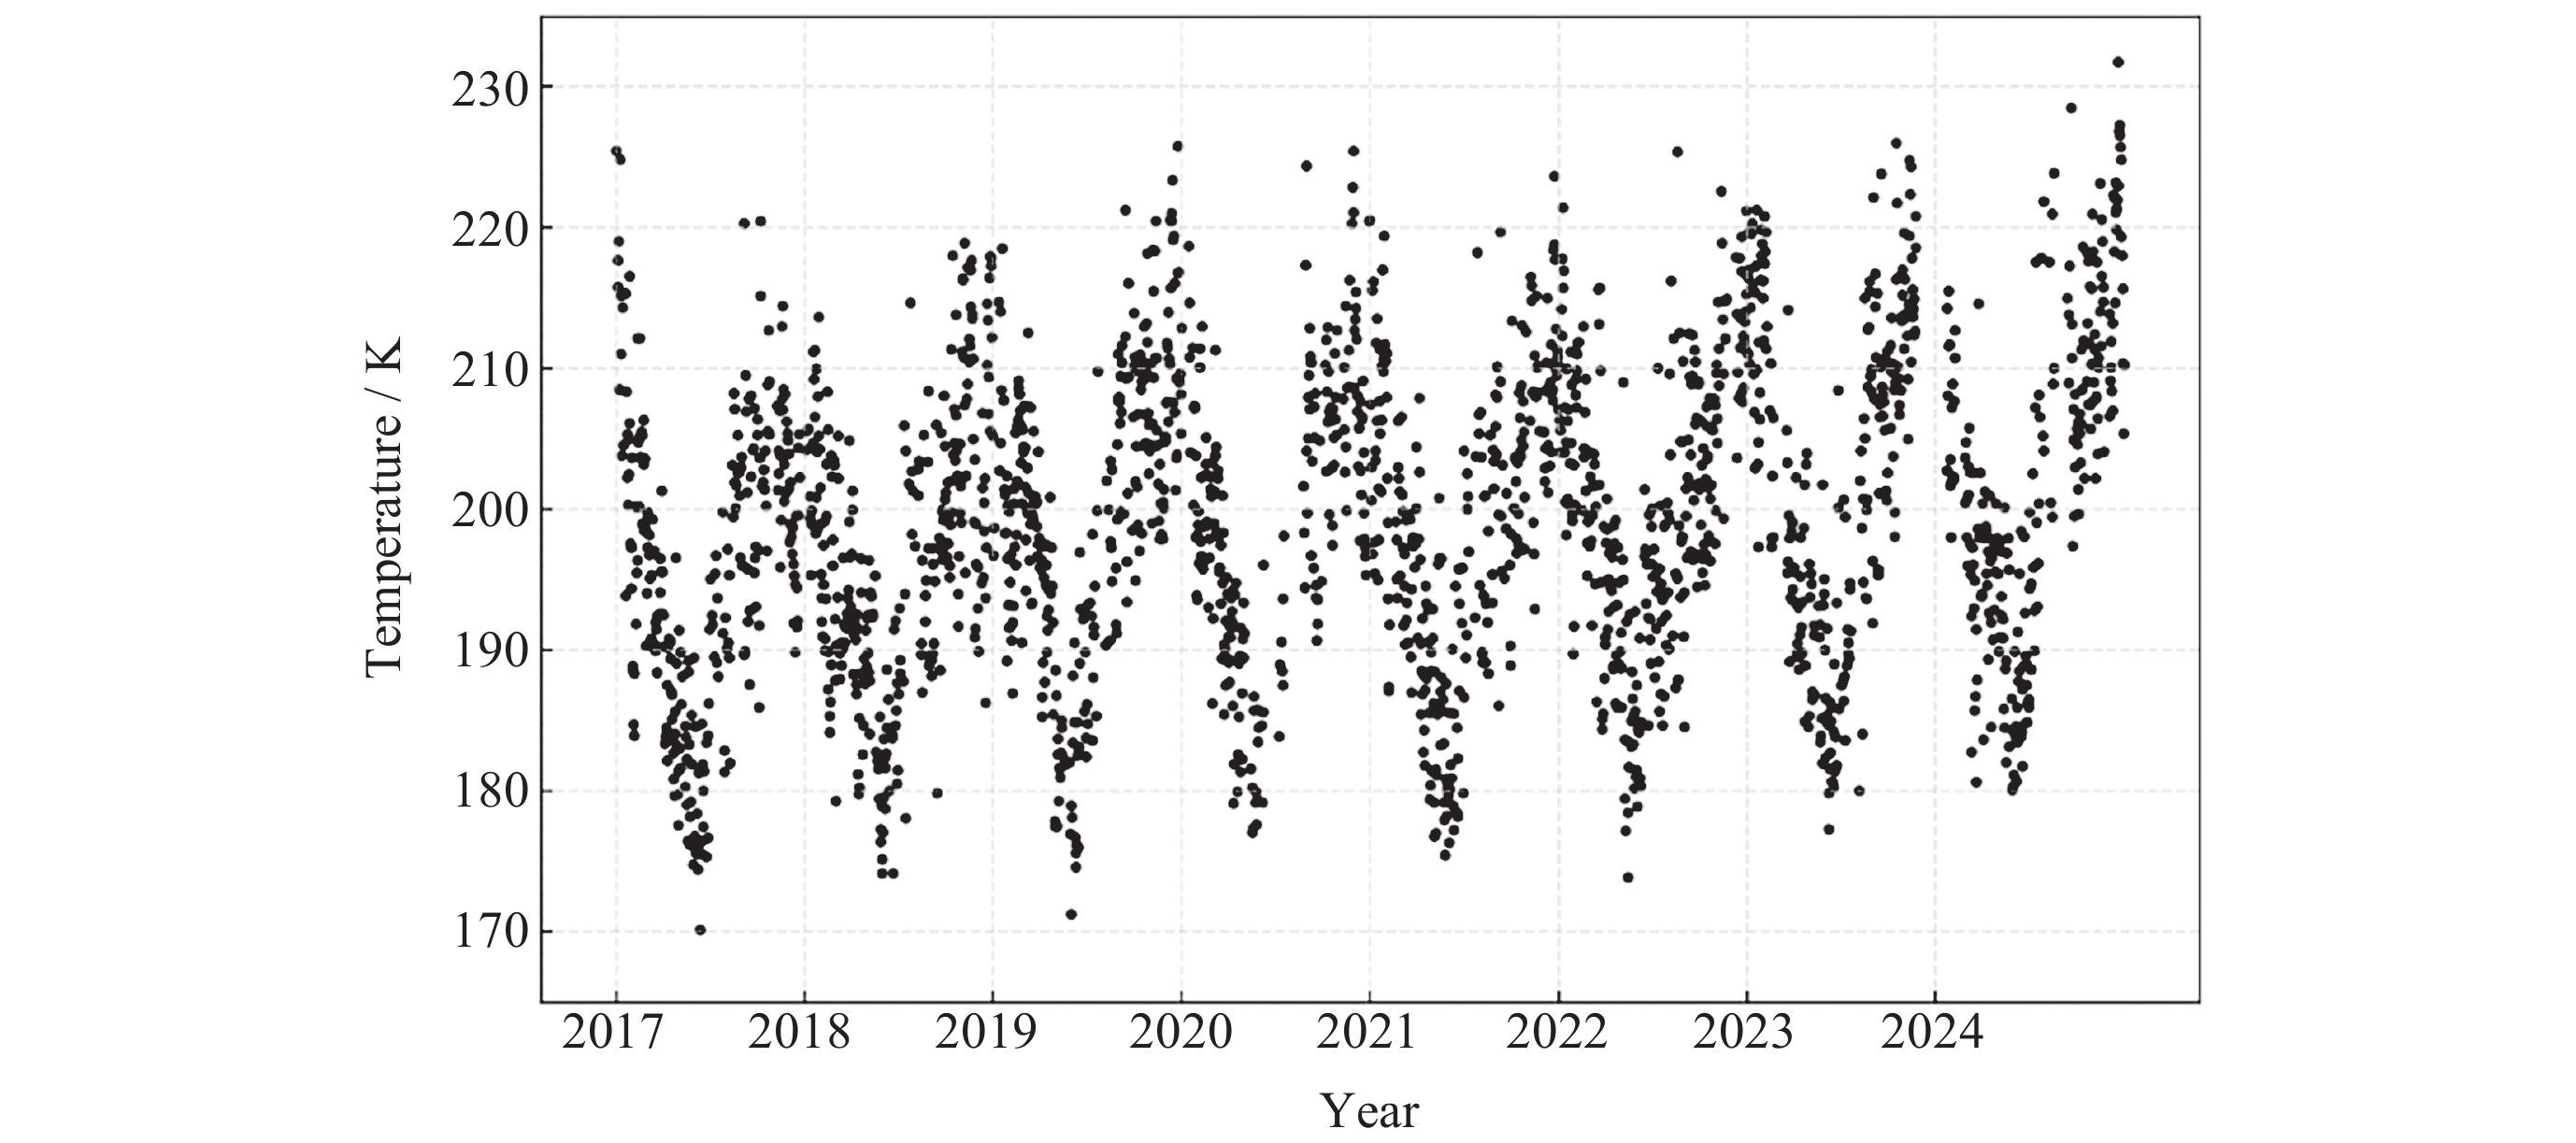
图 2 兴隆台站2017-2024年OH (3-1)转动温度时间序列. 黑色散点代表每日的夜间平均温度
Figure 2. Time series of OH (3-1) rotational temperatures observed at Xinglong Station from 2017 to 2024. The black scatter points represent the night-mean temperature
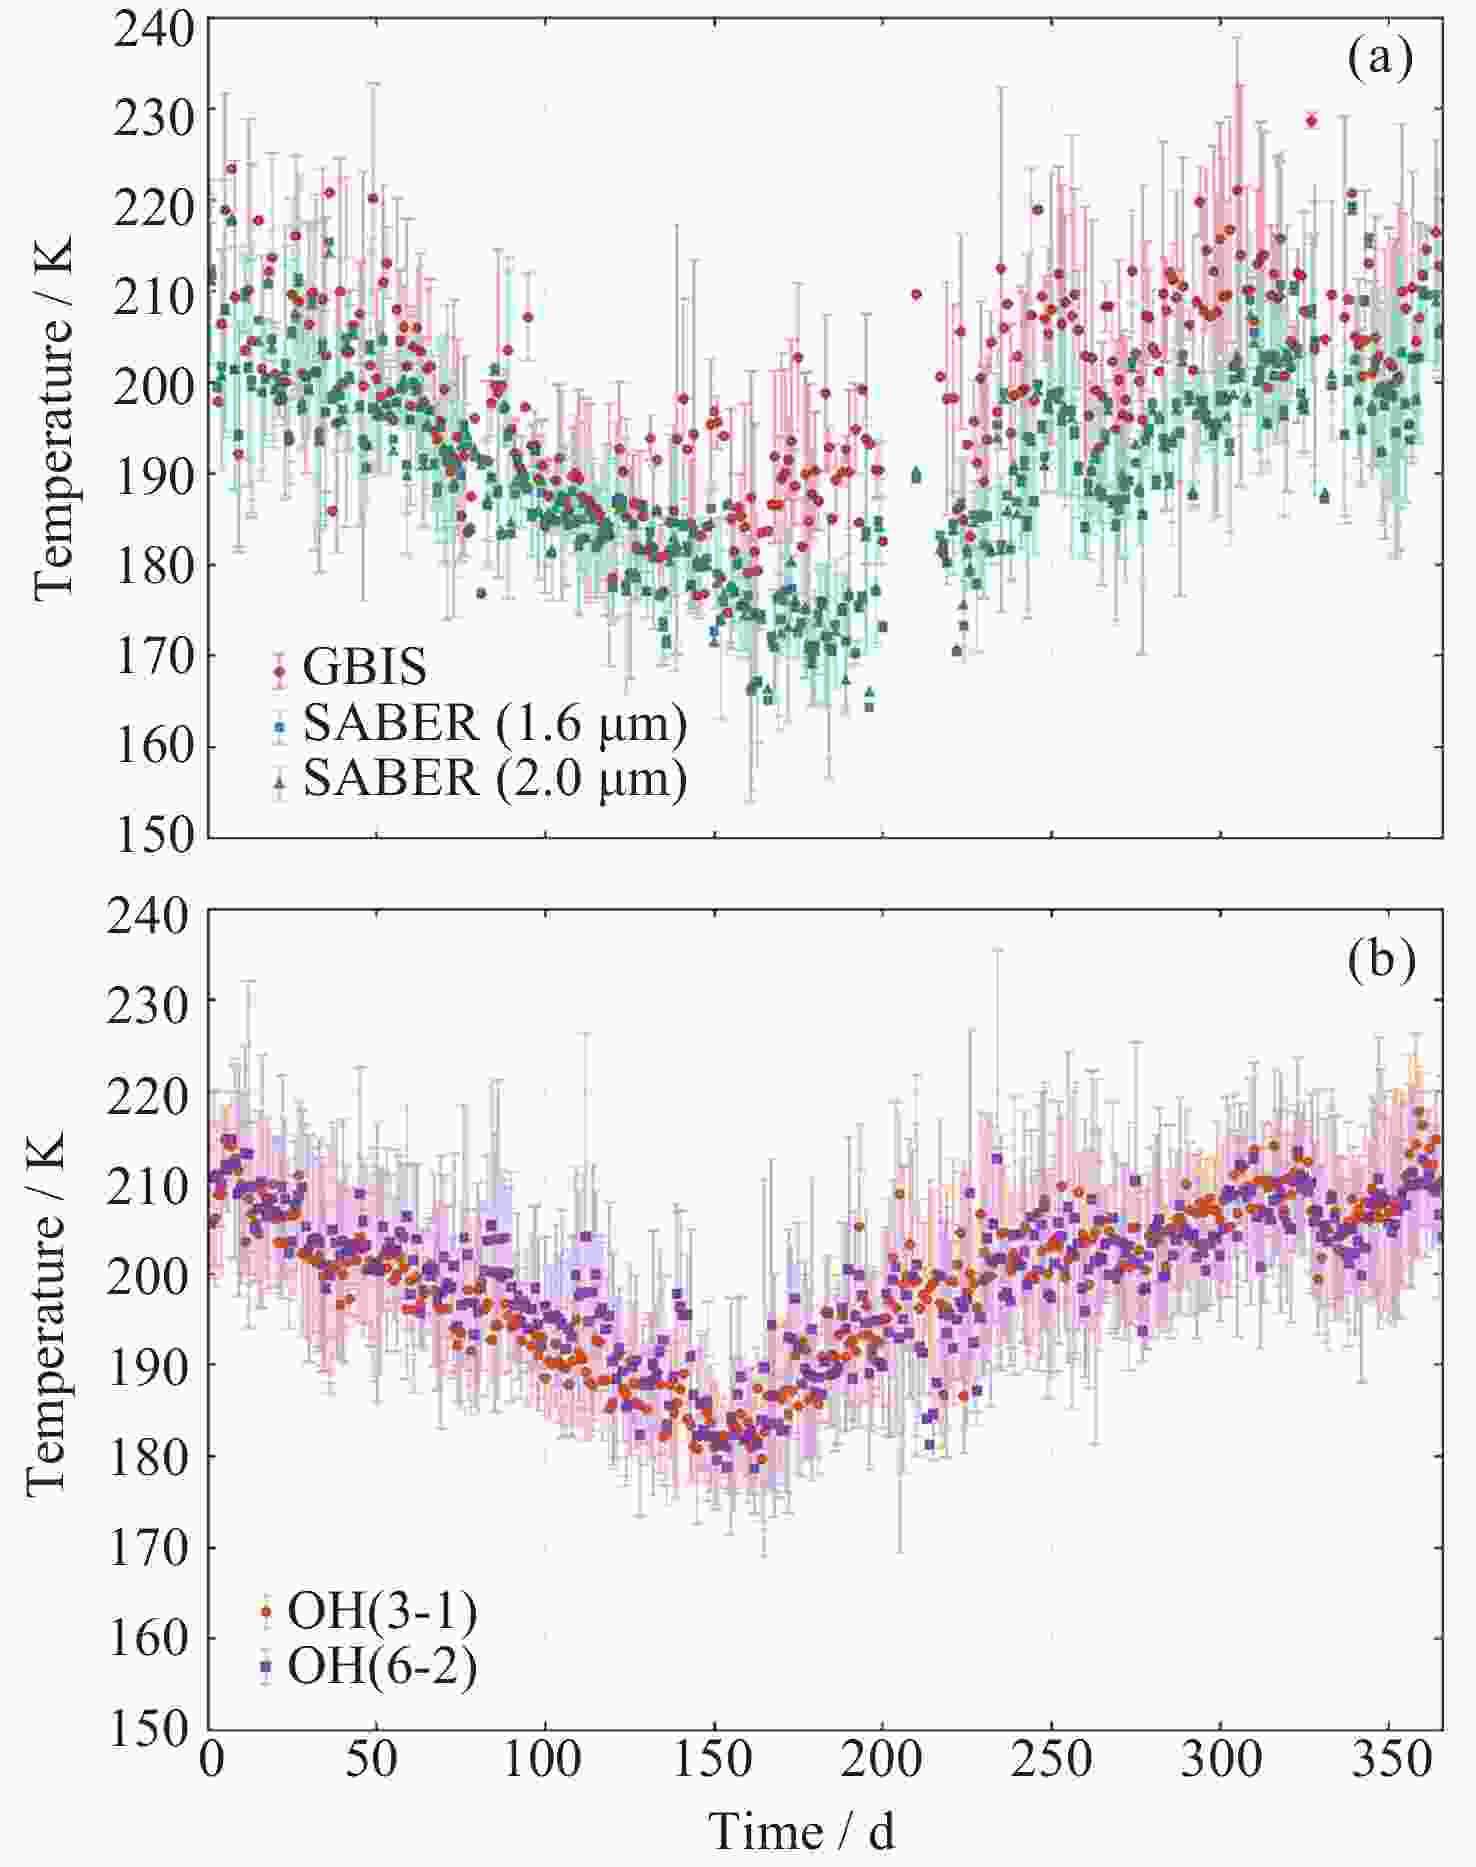
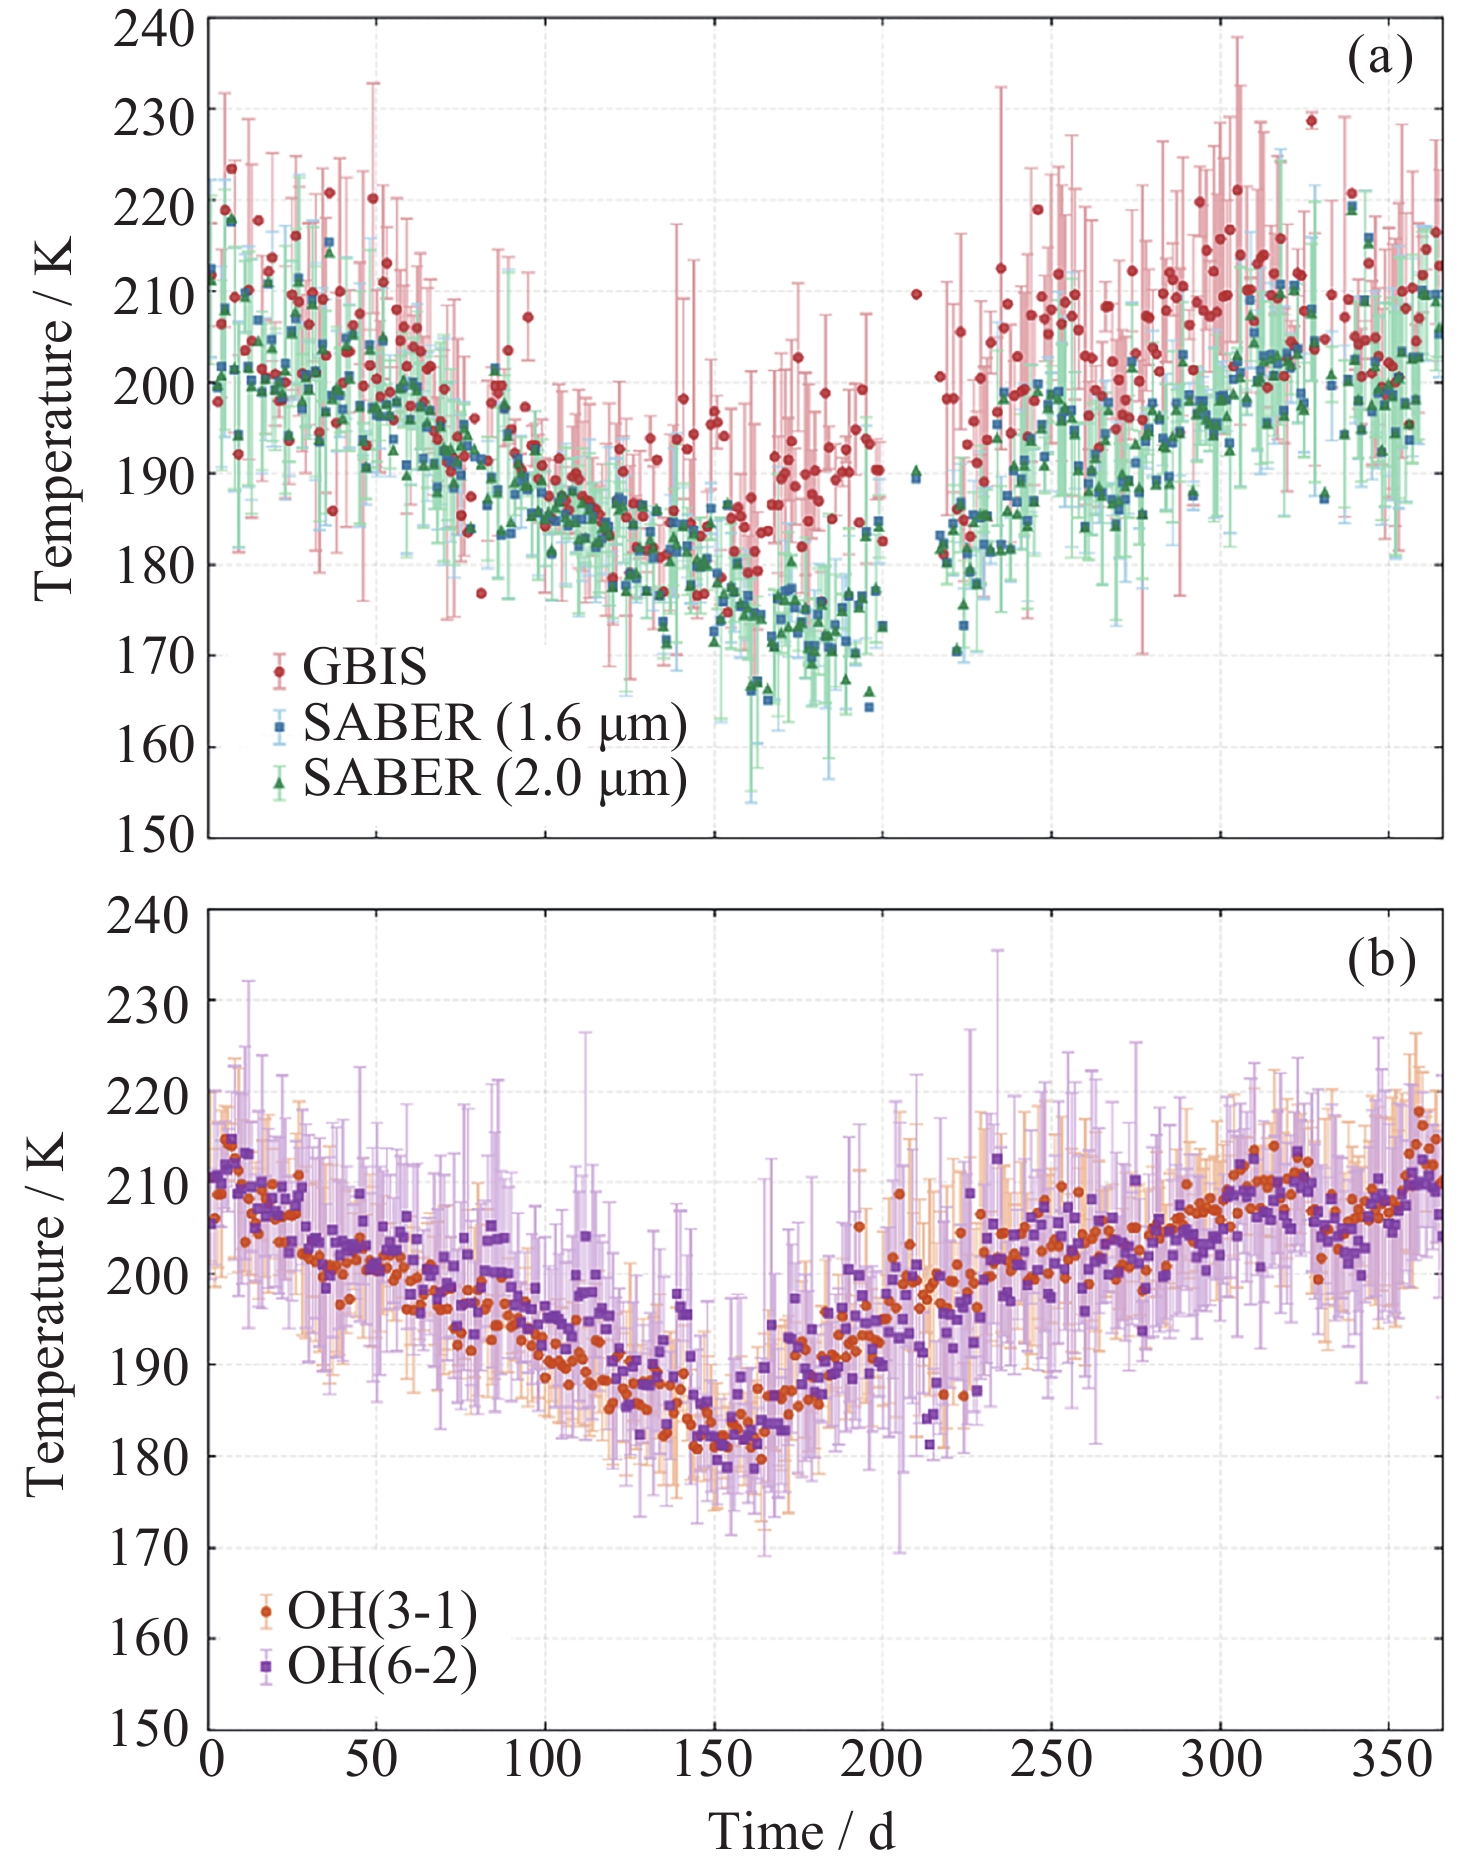
图 3 GBIS与TIMED卫星及同台站SMART测得的8年平均温度时间序列. (a)OH (3-1)转动温度与SABER加权平均温度时间序列, 其中红色为GBIS观测温度, 蓝色为SABER(1.6 μm)加权平均温度, 绿色为SABER(2.0 μm)加权平均温度, 误差棒表示标准差; (b)OH (3-1)转动温度与OH (6-2)转动温度时间序列, 其中橙色为OH (3-1)转动温度, 紫色为OH (6-2)转动温度, 误差棒表示标准差
Figure 3. Time series of 8-year mean temperatures measured from GBIS, the TIMED satellite, and the co-located SMART spectrometer. (a) shows the OH (3-1) rotational temperature and SABER weighted mean temperatures: red indicates GBIS observed temperature, blue indicates SABER (1.6 μm) weighted mean temperature, and green indicates SABER (2.0 μm) weighted mean temperature. Error bars represent standard deviations. (b) shows the OH (3-1) rotational temperature and OH (6-2) rotational temperature: orange indicates OH (3-1) rotational temperature, purple indicates OH (6-2) rotational temperature. Error bars also represent standard deviations
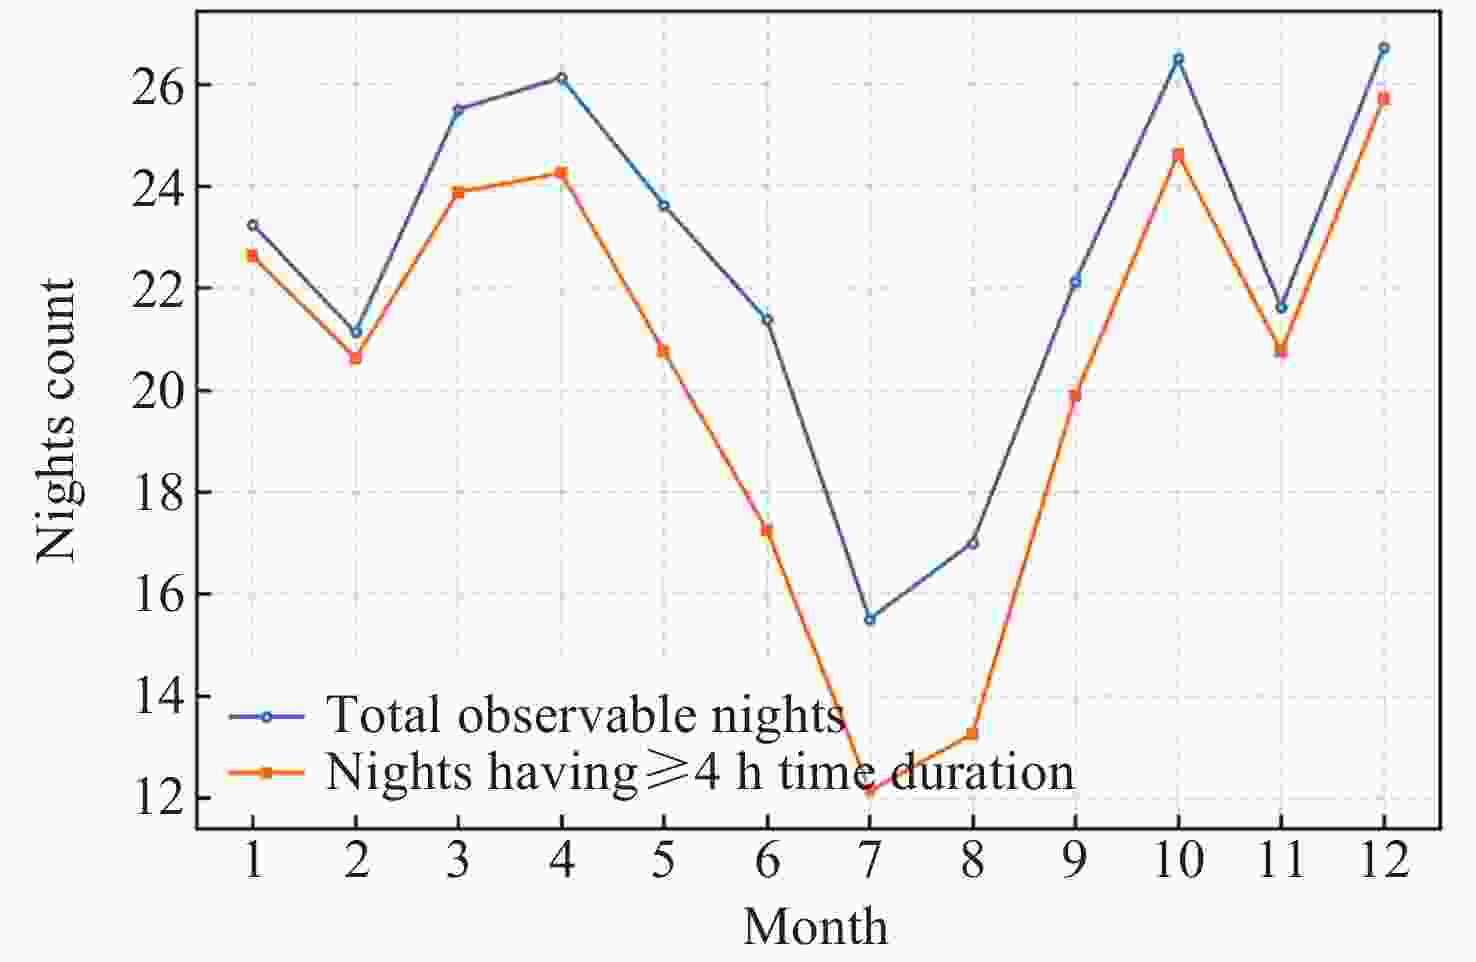
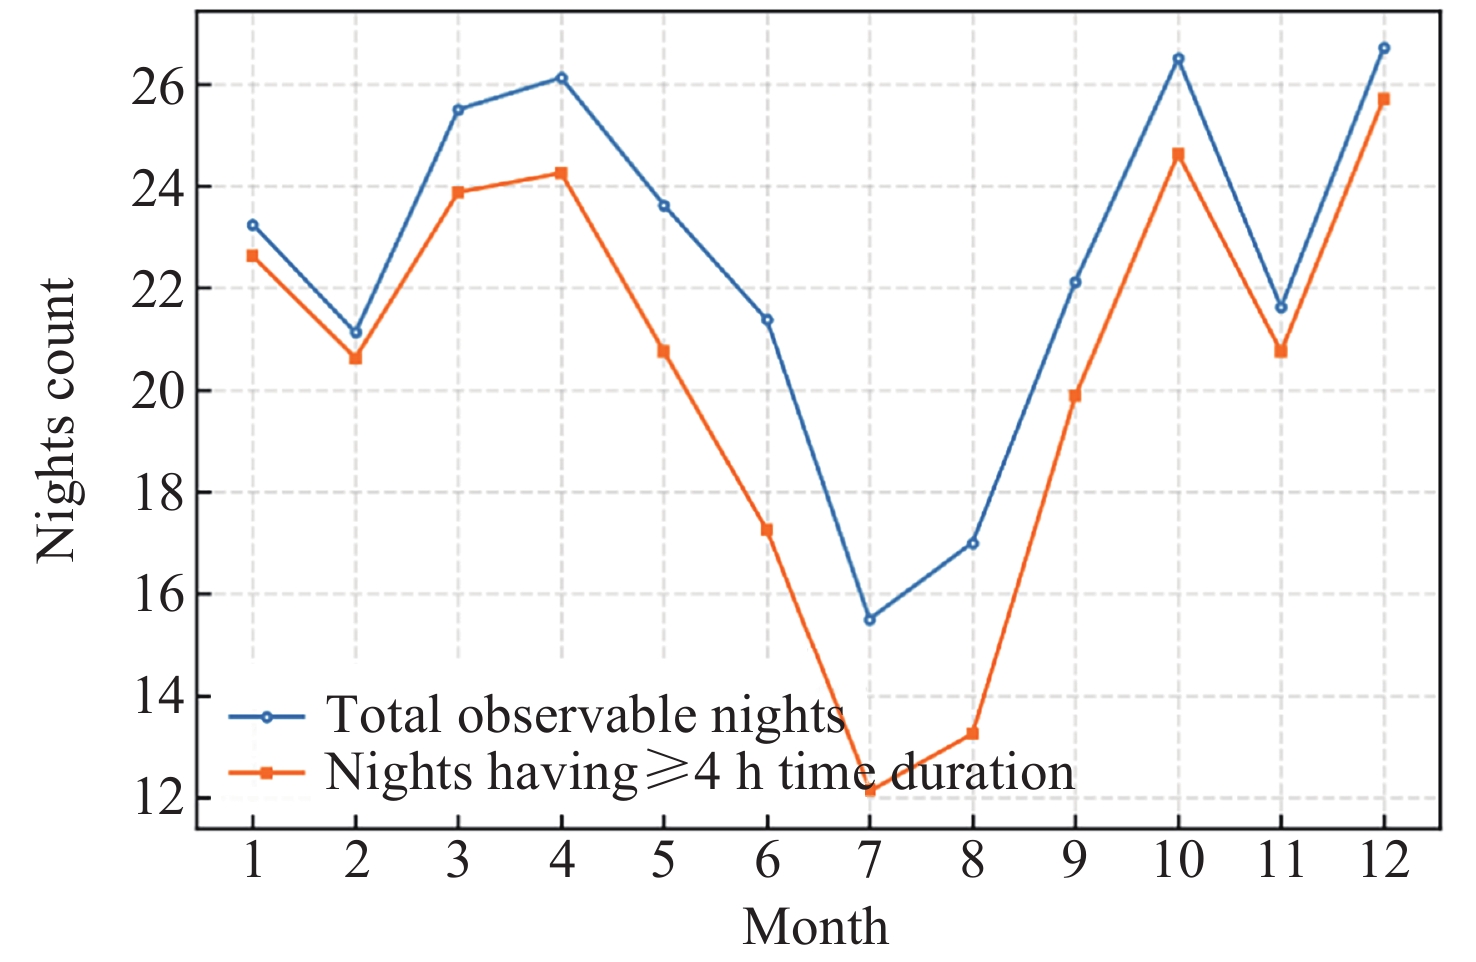
图 4 兴隆台站OH (3-1)气辉转动温度有效观测天数月平均分布. 蓝色曲线代表所有夜晚的总观测数, 橙色曲线对应观测时长 ≥4 h的有效观测夜晚数量
Figure 4. Monthly distribution of the average number of valid observational nights for OH (3-1) rotational temperature measurements at Xinglong Station. The blue curve represents the total number of nights observed, and the orange curve corresponds to the number of valid nights with an observation time ≥4 h
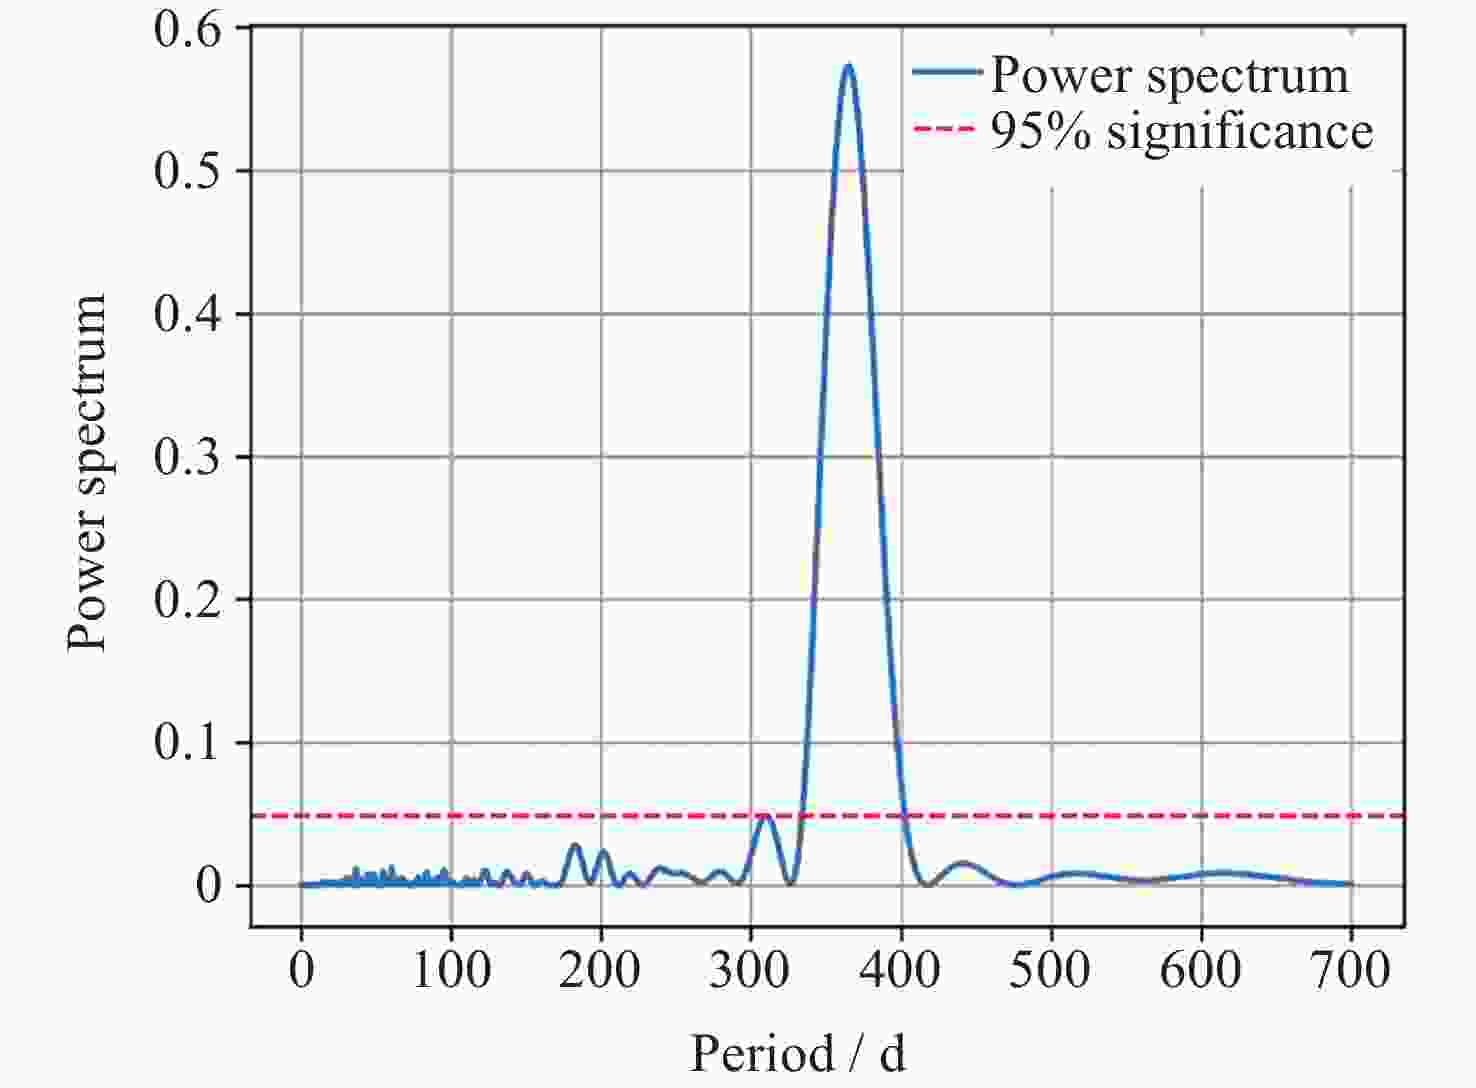
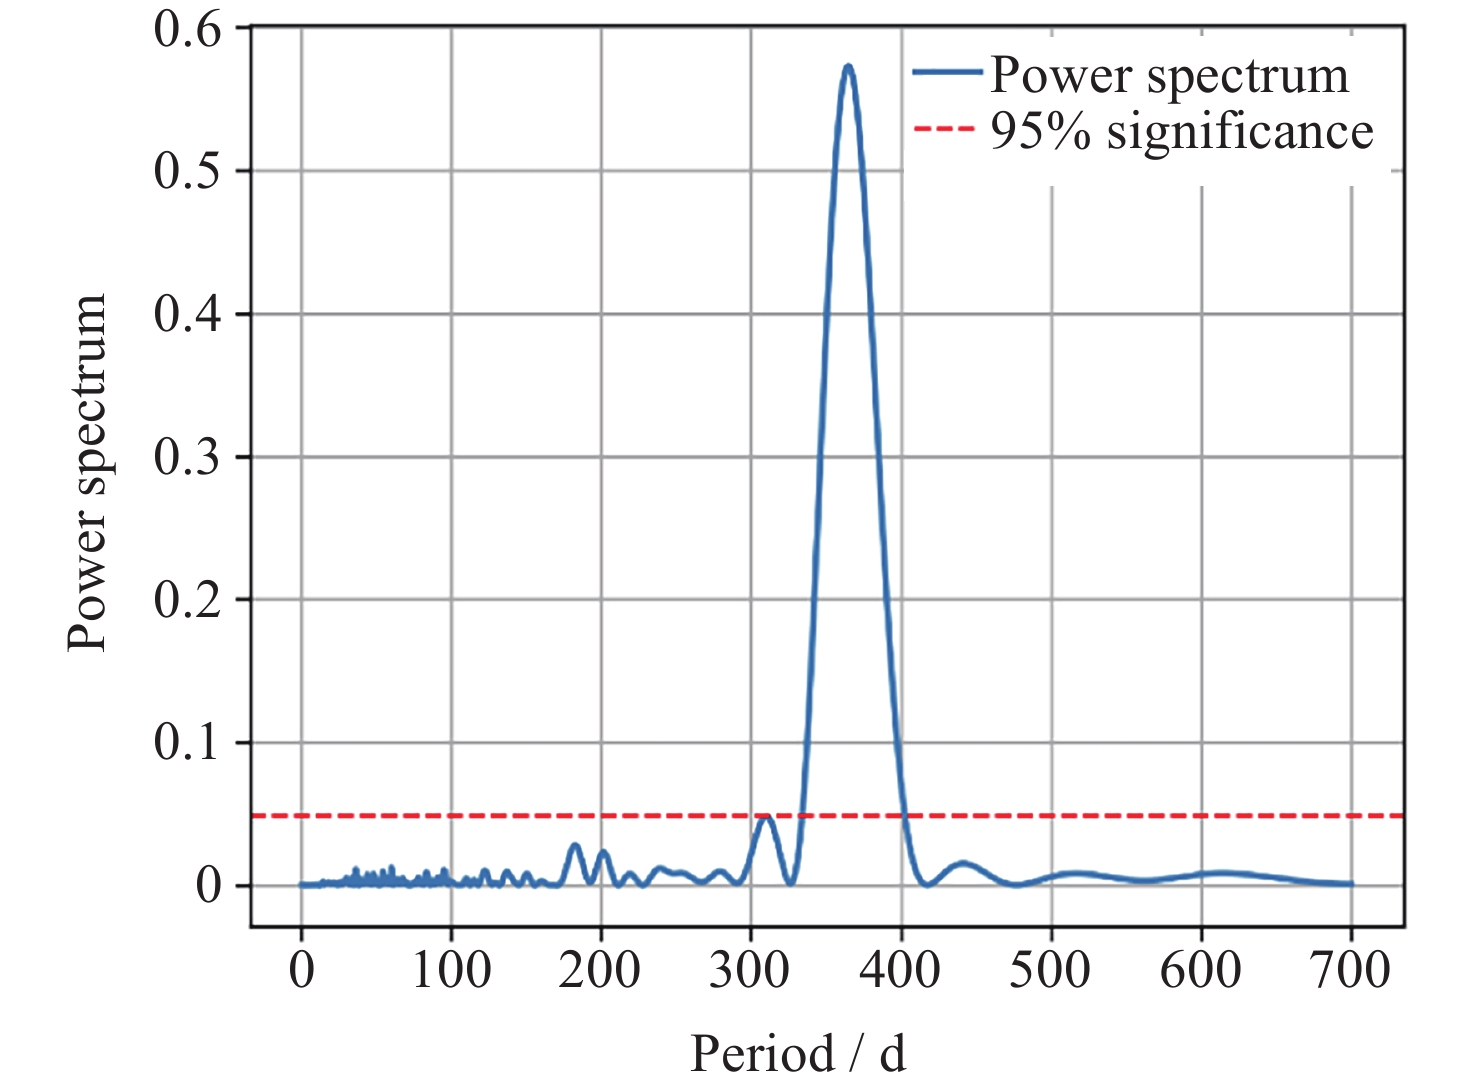
图 5 OH (3-1)转动温度的LSP周期分析结果. 蓝色曲线表示信号的功率谱, 红色虚线为95%置信水平
Figure 5. Lomb-Scargle Periodogram (LSP) results for the OH (3-1) rotational temperature time series. The blue curve represents the power spectrum of the signal, and the red dashed line indicates the 95% confidence level
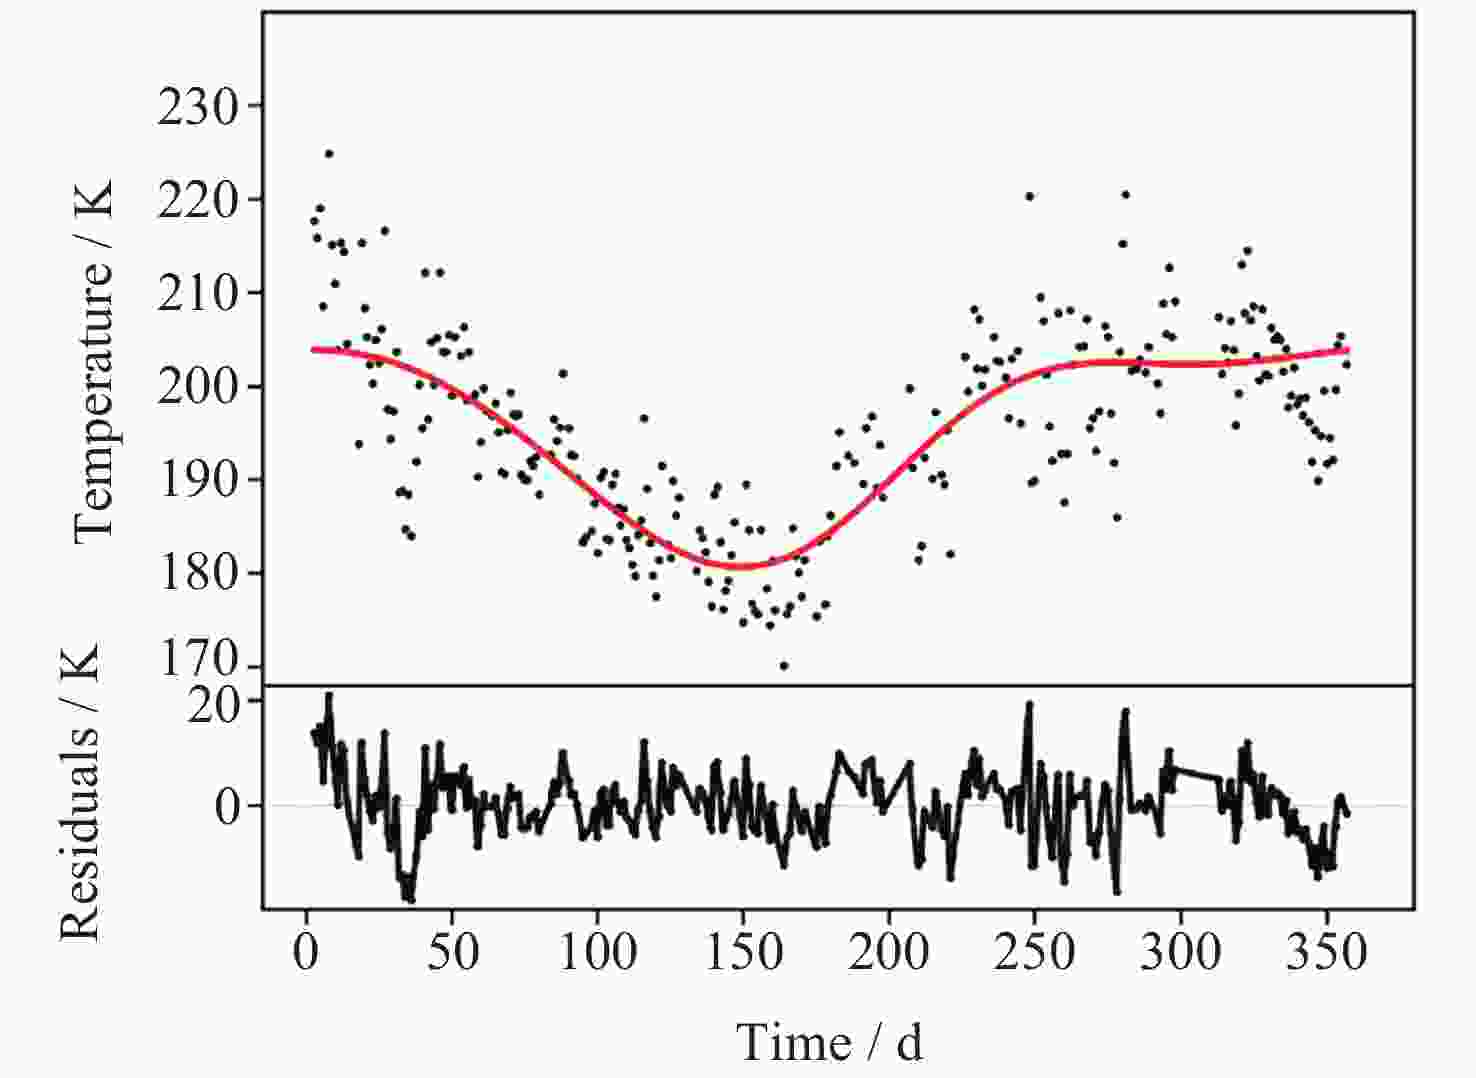
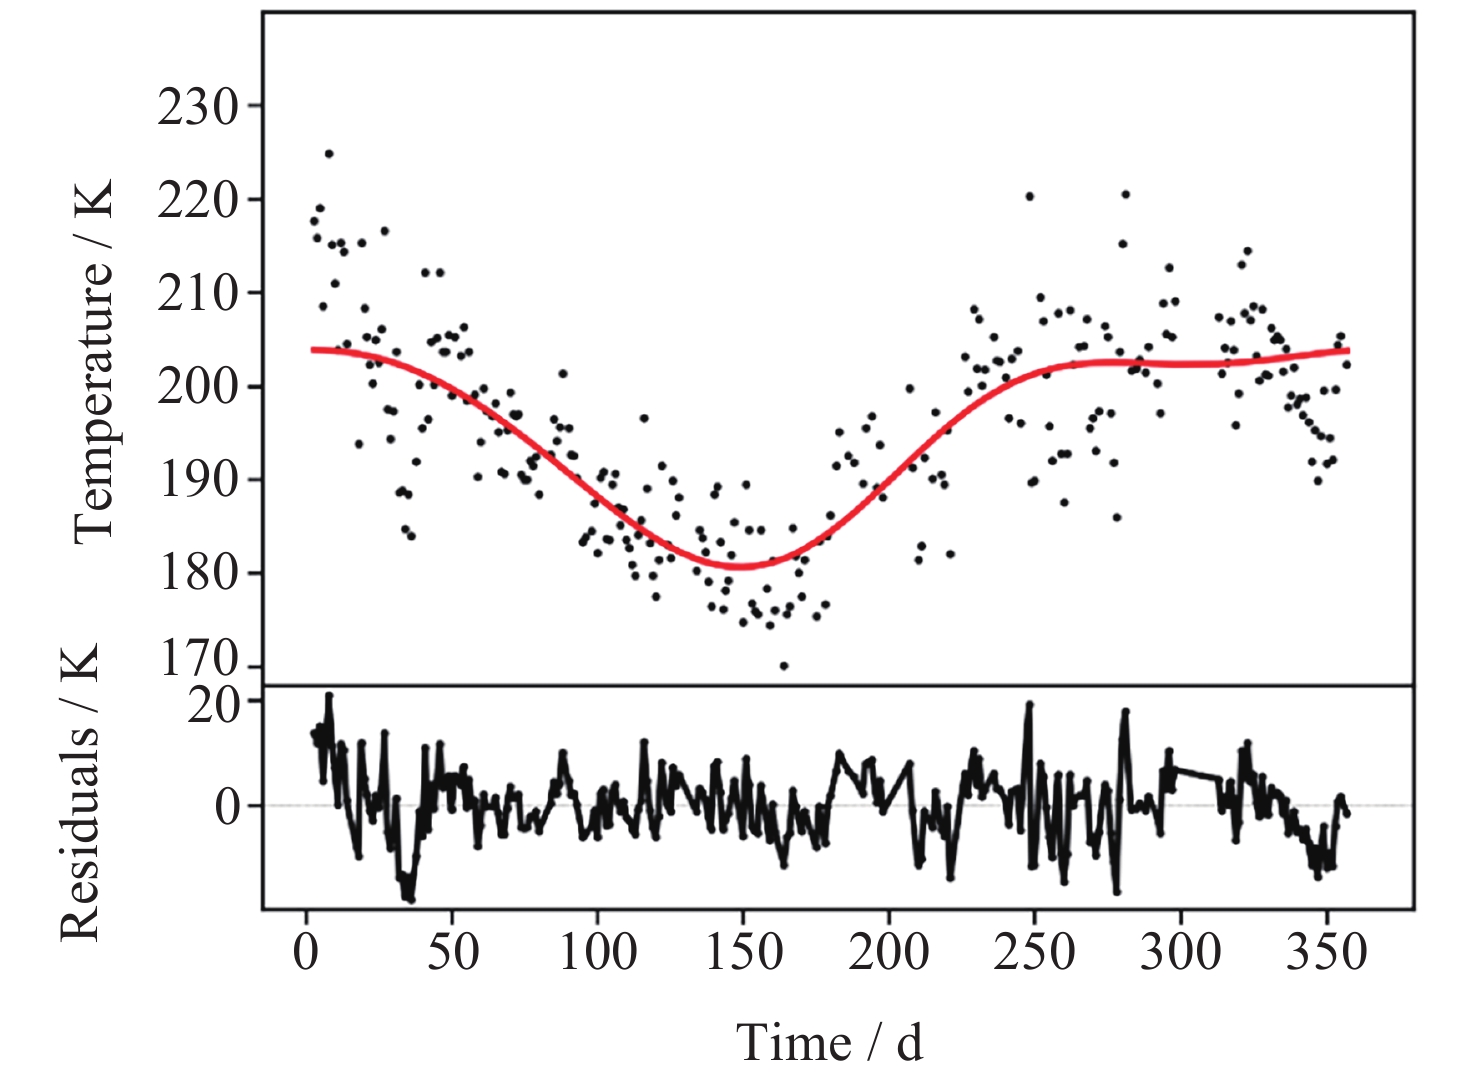
图 6 2017年OH (3-1)转动温度的拟合结果. 黑色圆点代表每一天的日均温度值, 红色曲线为对应的拟合结果. 黑色折线为温度残差, 即实际温度与拟合值的差值
Figure 6. Fitting result of the OH (3-1) rotational temperature in 2017. The black dots represent the daily mean temperature for each day, and the red curve shows the corresponding fitting result. The black polyline is the temperature residual, i.e., the difference between the measurement and the fitted value
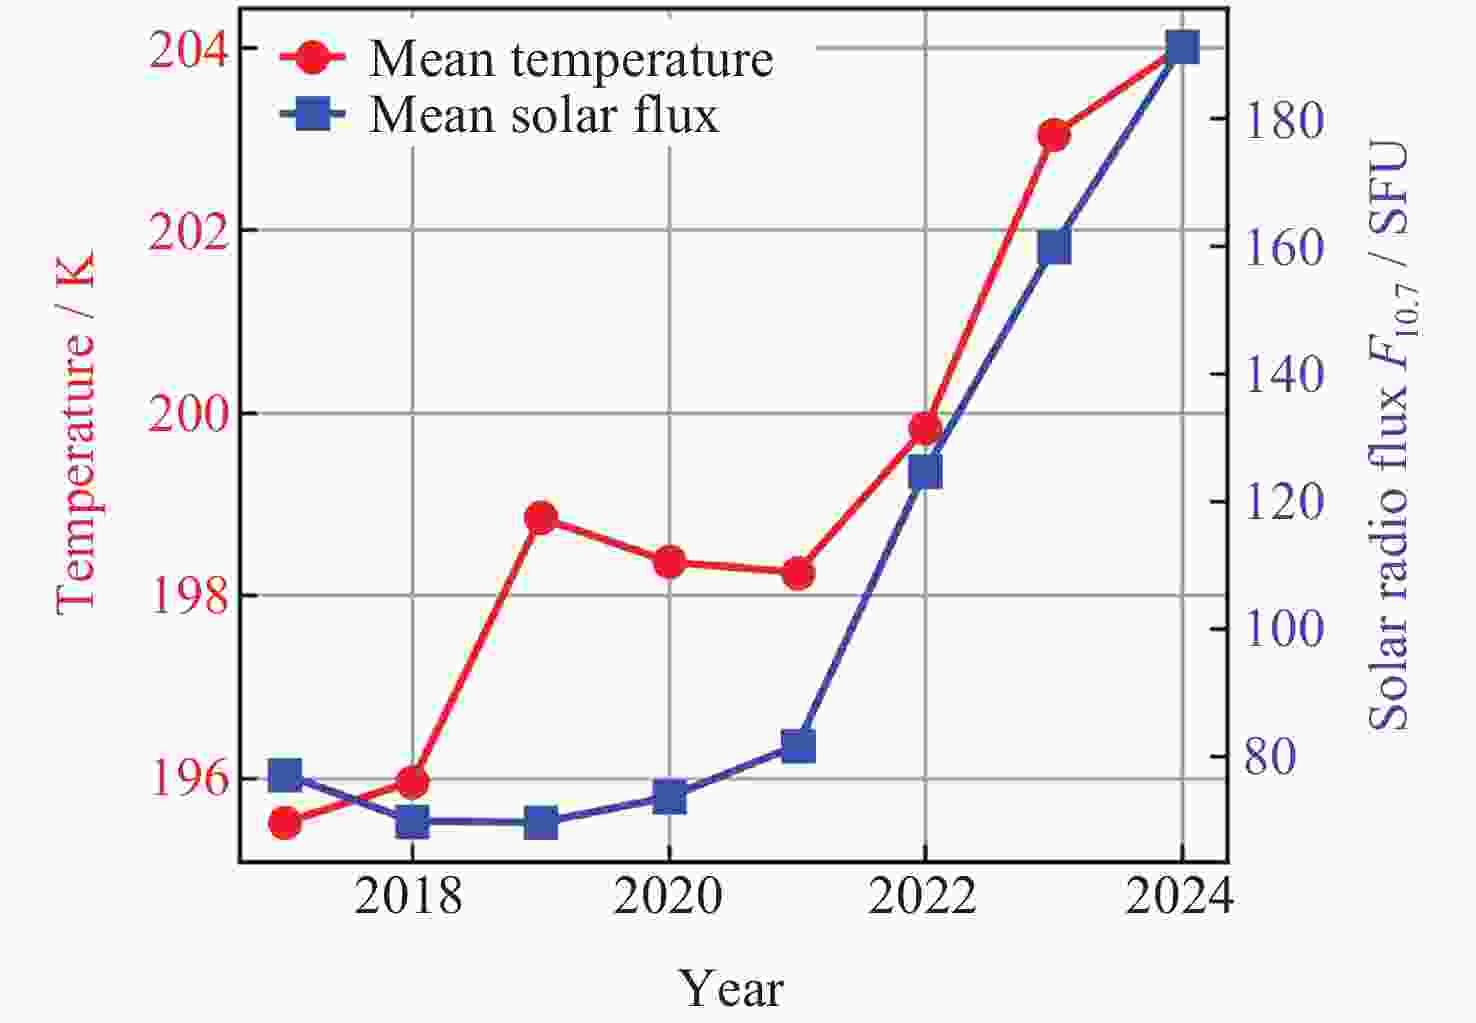
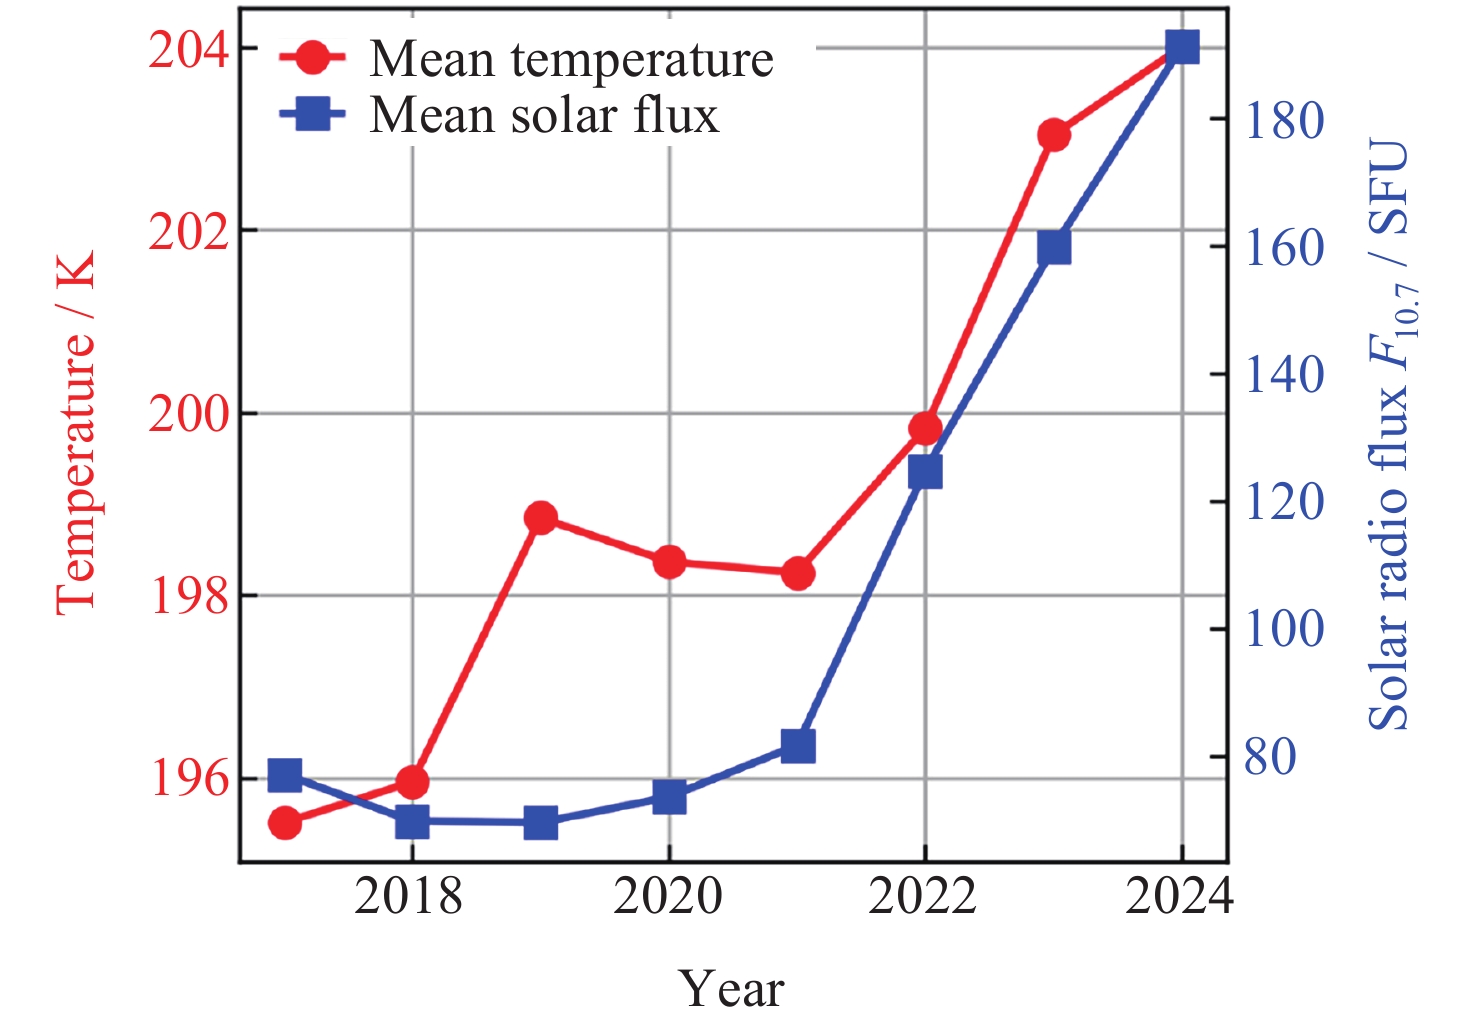
图 7 2017-2024年兴隆台站OH (3-1) 年平均转动温度和年均F10.7指数. 图中红色实心圆点代表OH气辉的年均转动温度, 蓝色实心方点代表F10.7指数年均值
Figure 7. Annual mean OH (3-1) rotational temperature and annual mean solar radio flux index F10.7 at Xinglong Station from 2017 to 2024. The solid red circles in the figure represent the annual mean rotational temperature of the OH airglow, and the solid blue squares represent the annual mean F10.7 index
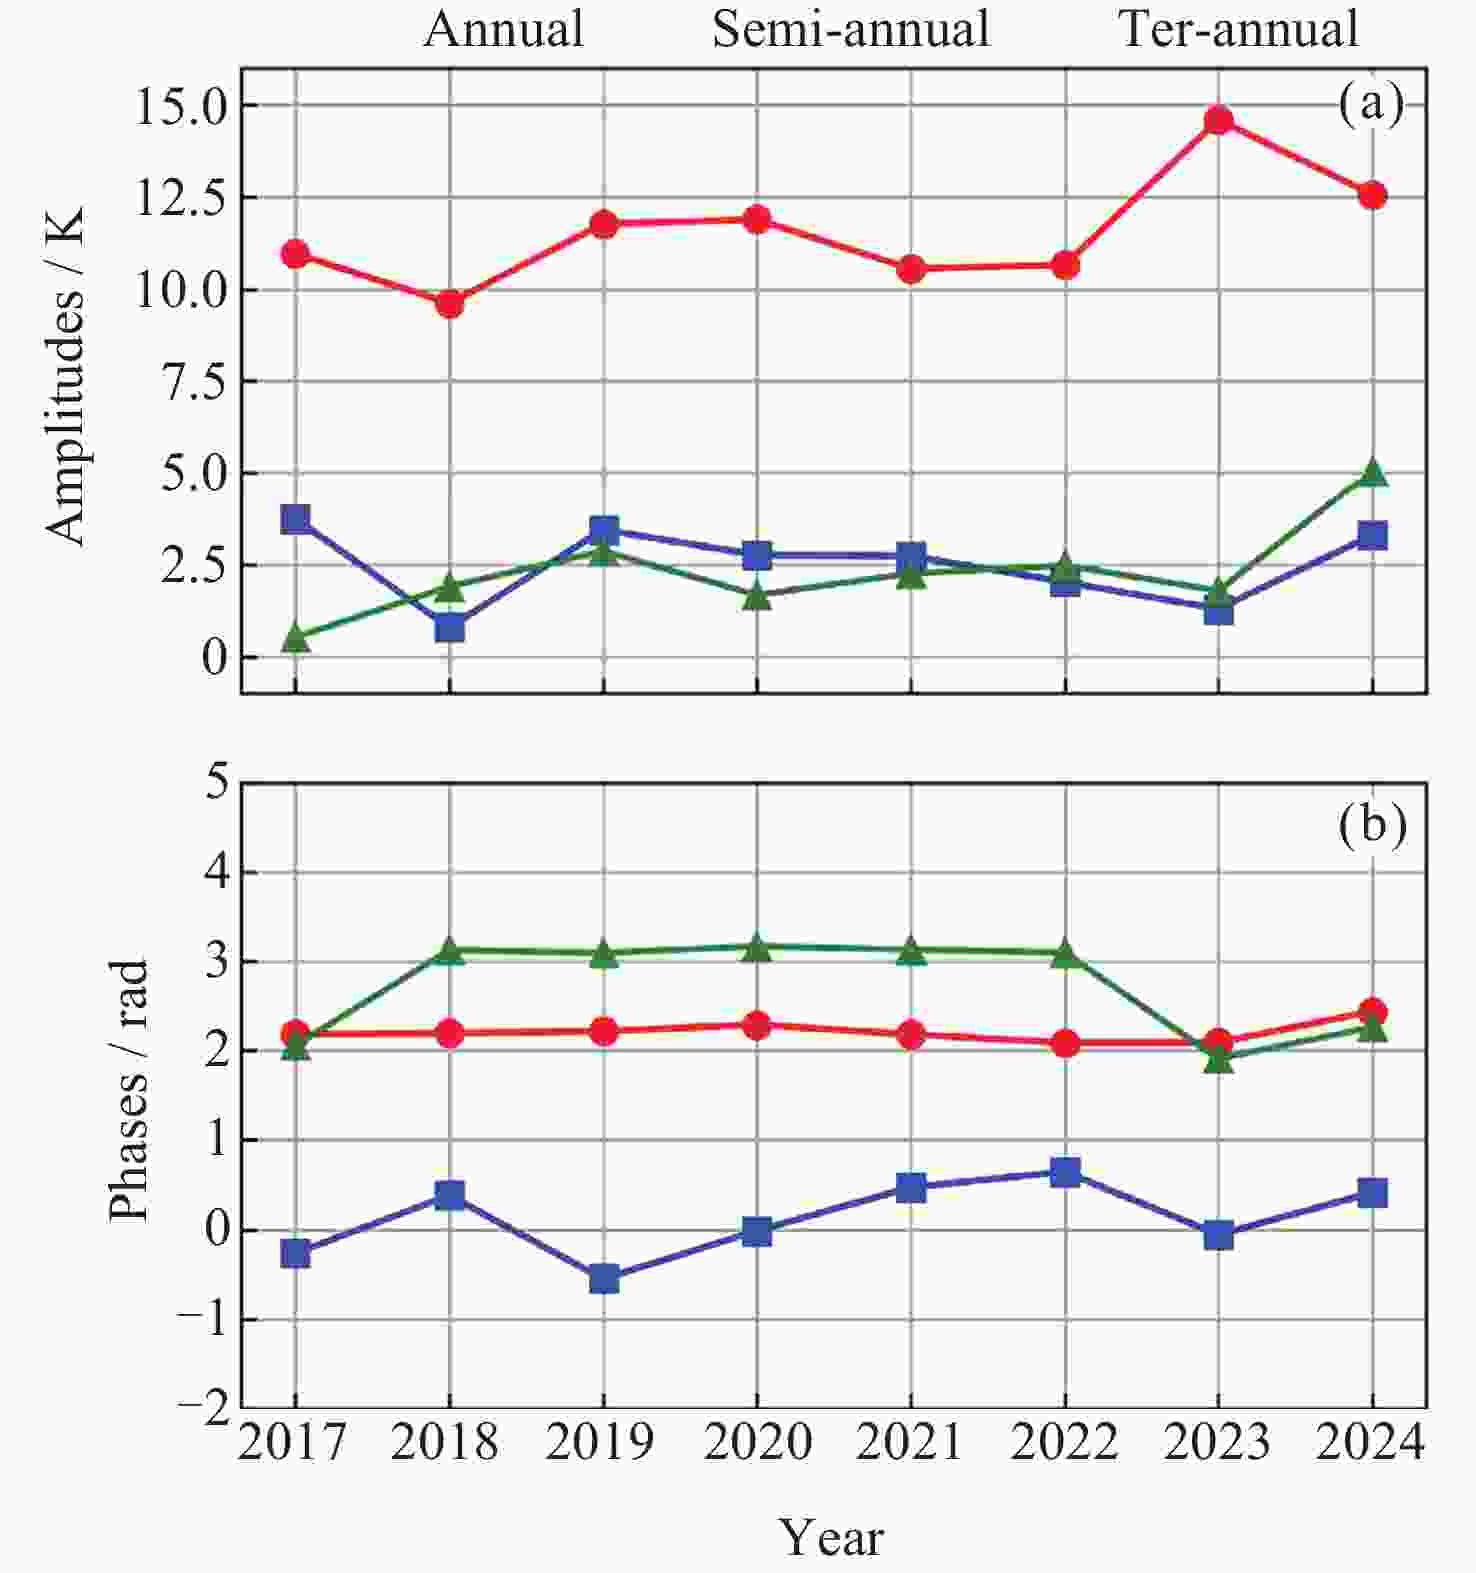
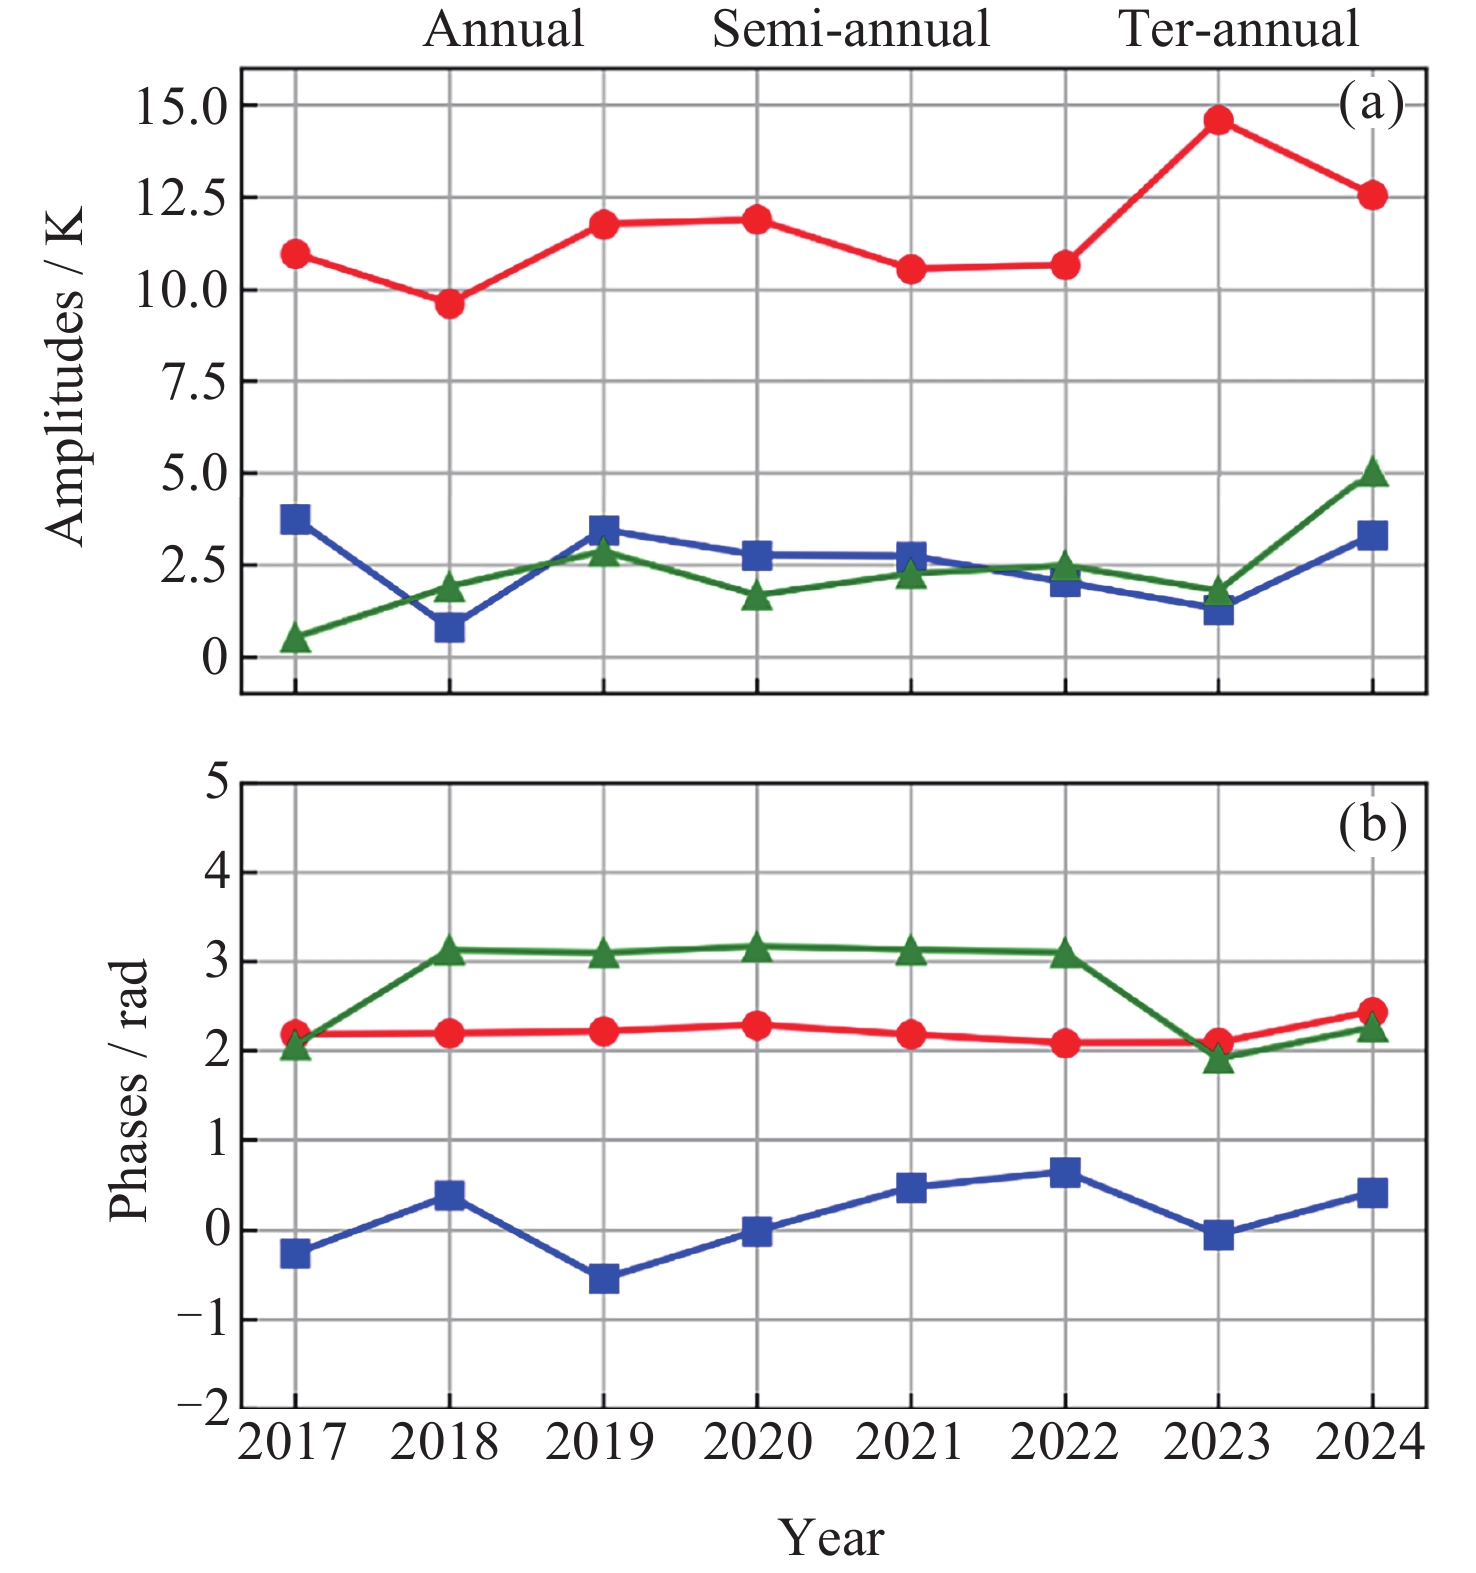
图 8 2017-2024年OH (3-1)转动温度各周期分量振幅和相位变化. (a)2017-2024年OH (3-1)转动温度年周期、半年周期和1/3年周期分量年均振幅变化, (b)对应各周期分量的年均相位变化. 红色表示年周期成分, 蓝色表示半年周期成分, 绿色表示1/3年周期成分
Figure 8. Variation of amplitude and phase of OH (3-1) rotational temperature in each period from 2017 to 2024. (a) Annual variations of the mean amplitudes of the annual, semi-annual, and ter-annual components of the OH (3-1) rotational temperature from 2017 to 2024. (b) Corresponding annual mean phase variations of each periodic component. Red dot line represents the annual component, blue square line represents the semi-annual component, and green triangle line represents the ter-annual component
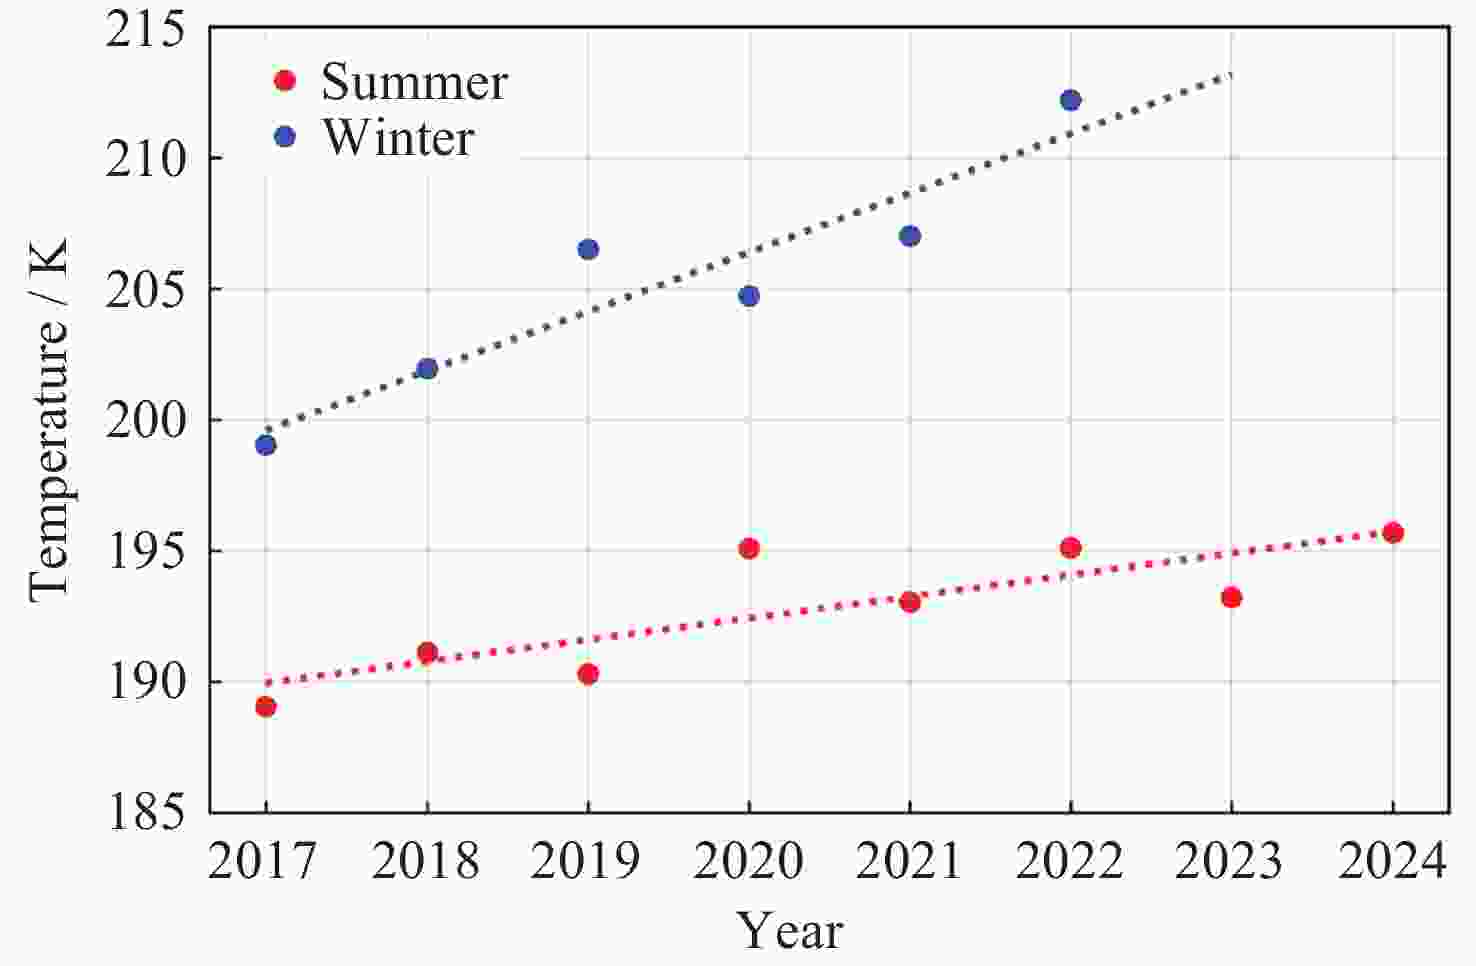
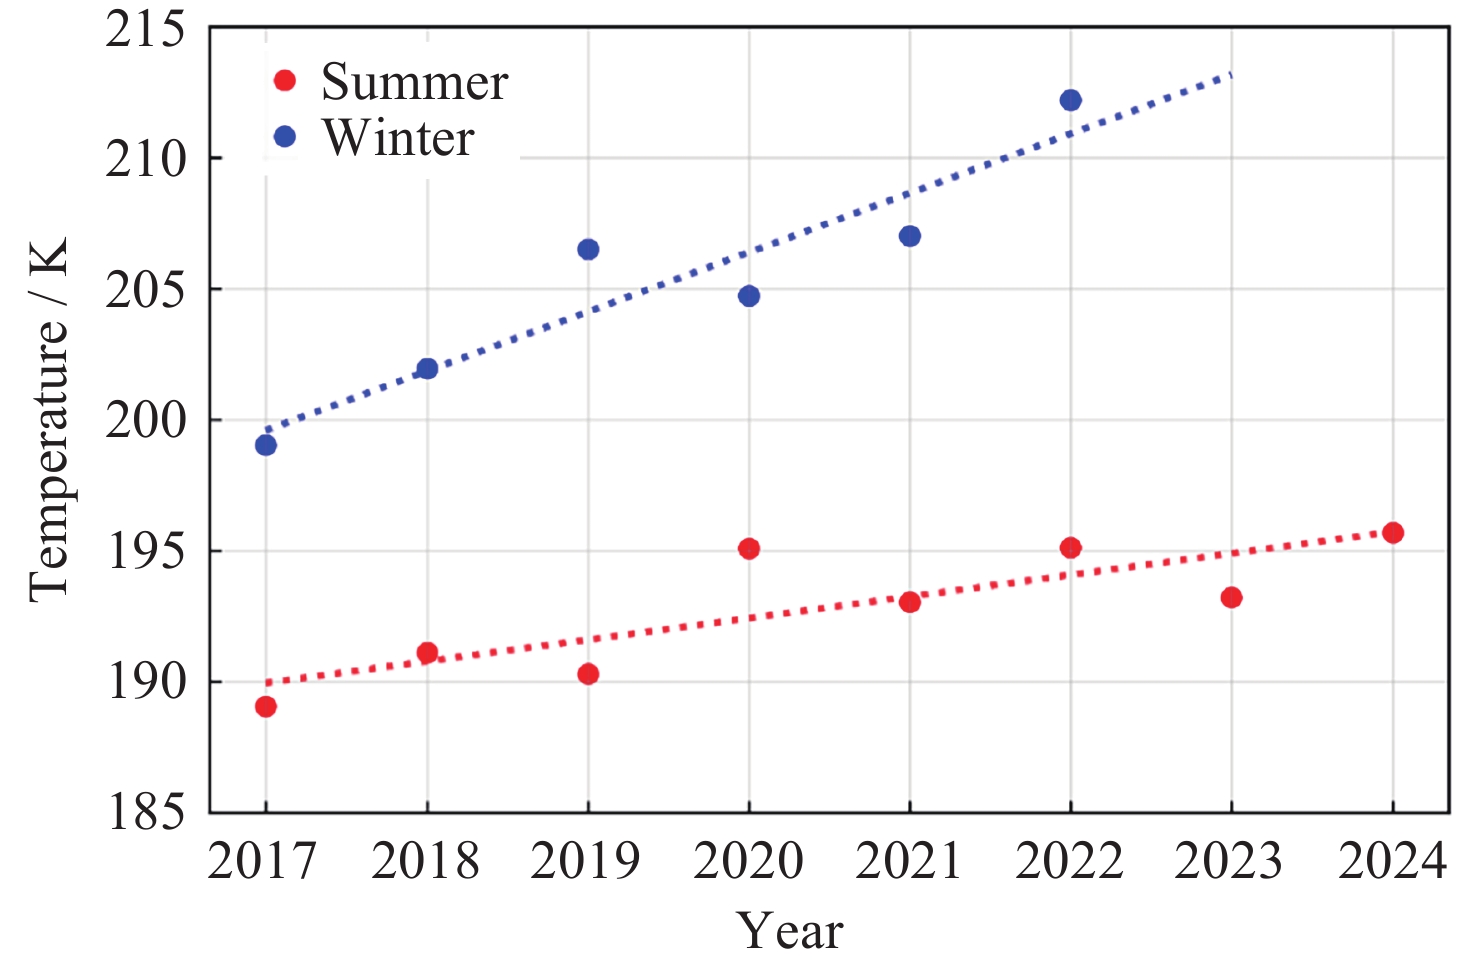
图 9 2017-2024年季节平均温度变化. 红色散点代表夏季年平均温度, 蓝色散点代表冬季年平均温度, 虚线为线性拟合结果
Figure 9. Interannual variation of the seasonal mean OH (3-1) rotational temperatures from 2017 to 2024. The red scatter points represent the annual mean temperature in summer, the blue scatter points represent the annual mean temperature in winter, and the dashed line is the linear fitting result
-
[1] BAKER D J, STAIR-JR A T. Rocket measurements of the altitude distributions of the hydroxyl airglow[J]. Physica Scripta, 1988, 37(4): 611 doi: 10.1088/0031-8949/37/4/021 [2] BITTNER M, OFFERMANN D, GRAEF H H. Mesopause temperature variability above a midlatitude station in Europe[J]. Journal of Geophysical Research: Atmospheres, 2000, 105(D2): 2045-2058 doi: 10.1029/1999JD900307 [3] BITTNER M, OFFERMANN D, GRAEF H H, et al. An 18-year time series of OH rotational temperatures and middle atmosphere decadal variations[J]. Journal of Atmospheric and Solar-Terrestrial Physics, 2002, 64(8/9/10/11): 1147-1166 doi: 10.1016/s1364-6826(02)00065-2 [4] OFFERMANN D, HOFFMANN P, KNIELING P, et al. Long-term trends and solar cycle variations of mesospheric temperature and dynamics[J]. Journal of Geophysical Research: Atmospheres, 2010, 115(D18): D18127 doi: 10.1029/2009jd013363 [5] FRENCH W J R, MULLIGAN F J, KLEKOCIUK A R. Analysis of 24 years of mesopause region OH rotational temperature observations at Davis, Antarctica-Part 1: long-term trends[J]. Atmospheric Chemistry and Physics, 2020, 20(11): 6379-6394 doi: 10.5194/acp-20-6379-2020 [6] KALICINSKY C, KNIELING P, KOPPMANN R, et al. Long-term dynamics of OH* temperatures over central Europe: trends and solar correlations[J]. Atmospheric Chemistry and Physics, 2016, 16(23): 15033-15047 doi: 10.5194/acp-16-15033-2016 [7] KALICINSKY C, KIRCHHOFF S, KNIELING P, et al. Long-term variations in the mesopause region derived from OH*(3, 1) rotational temperature observations at Wuppertal, Germany, from 1988-2022[J]. Advances in Space Research, 2024, 73(7): 3398-3407 doi: 10.1016/j.asr.2023.08.045 [8] BITTNER M, OFFERMANN D, BUGAEVA I V, et al. Long period/large scale oscillations of temperature during the DYANA campaign[J]. Journal of Atmospheric and Terrestrial Physics, 1994, 56(13/14): 1675-1700 doi: 10.1016/0021-9169(94)90004-3 [9] KALICINSKY C, REISCH R, KNIELING P. Ground-based observations of periodic temperature fluctuations in the mesopause region with periods longer than 2 d[J]. Atmospheric Chemistry and Physics, 2026, 26(4): 2531-2544. doi: 10.5194/acp-26-2531-2026 [10] SINGH R P, PALLAMRAJU D, SURYAWANSHI P, et al. Studies of atmospheric waves by ground-based observations of OH(3-1) emission and rotational temperature using PRL airglow InfraRed spectrograph (PAIRS)[J]. Journal of Atmospheric and Solar-Terrestrial Physics, 2023, 244: 106039 doi: 10.1016/j.jastp.2023.106039 [11] ZHU Y J, XU J Y, YUAN W, et al. First experiment of spectrometric observation of hydroxyl emission and rotational temperature in the mesopause in China[J]. Science China Technological Sciences, 2012, 55(5): 1312-1318 doi: 10.1007/s11431-012-4824-7 [12] XU J Y, GAO H, SMITH A K, et al. Using TIMED/SABER nightglow observations to investigate hydroxyl emission mechanisms in the mesopause region[J]. Journal of Geophysical Research: Atmospheres, 2012, 117(D2): D02301 doi: 10.1029/2011jd016342 [13] SCHMIDT C, HÖPPNER K, BITTNER M. A ground-based spectrometer equipped with an InGaAs array for routine observations of OH(3-1) rotational temperatures in the mesopause region[J]. Journal of Atmospheric and Solar-Terrestrial Physics, 2013, 102: 125-139 doi: 10.1016/j.jastp.2013.05.001 [14] SAU S, TERRA P, BRUM C G M, et al. Retrieval of rotational temperatures from the Arecibo observatory Ebert-Fastie spectrometer and their inter-comparison with Co-located K-Lidar and SABER measurements[J]. Earth and Space Science, 2024, 11(2): e2023EA003323 doi: 10.1029/2023EA003323 [15] MIES F H. Calculated vibrational transition probabilities of OH(X2Π)[J]. Journal of Molecular Spectroscopy, 1974, 53(2): 150-188 doi: 10.1016/0022-2852(74)90125-8 [16] PERMINOV V I, SEMENOV A I, MEDVEDEVA I V, et al. Variability of mesopause temperature from the hydroxyl airglow observations over mid-latitudinal sites, Zvenigorod and Tory, Russia[J]. Advances in Space Research, 2014, 54(12): 2511-2517 doi: 10.1016/j.asr.2014.01.027 [17] KIRAN, SINGH R P. Vertical wave characteristics in the MLT region and its seasonal variations using OH(3-1) brightness and rotational temperature from Ahmedabad (23°N, 72.6°E)[J]. Advances in Space Research, 2025, 75(7): 5484-5498 doi: 10.1016/j.asr.2025.01.017 [18] OBERHEIDE J, OFFERMANN D, RUSSELL-III J M, et al. Intercomparison of kinetic temperature from 15 μm CO2 limb emissions and OH*(3, 1) rotational temperature in nearly coincident air masses: SABER, GRIPS[J]. Geophysical research letters, 2006, 33(14): L14811 [19] LIU W J, XU J Y, SMITH A K, et al. Comparison of rotational temperature derived from ground-based OH airglow observations with TIMED/SABER to evaluate the Einstein coefficients[J]. Journal of Geophysical Research: Space Physics, 2015, 120(11): 10069-10082 doi: 10.1002/2015JA021886 [20] KALICINSKY C, REISCH R, KNIELING P, et al. Determination of time-varying periodicities in unequally spaced time series of OH* temperatures using a moving Lomb-Scargle periodogram and a fast calculation of the false alarm probabilities[J]. Atmospheric Measurement Techniques, 2020, 13(2): 467-477 doi: 10.5194/amt-13-467-2020 [21] OFFERMANN D, JARISCH M, DONNER M, et al. OH temperature re-analysis forced by recent variance increases[J]. Journal of atmospheric and solar-terrestrial physics, 2006, 68(17): 1924-1933 doi: 10.1016/j.jastp.2006.03.007 [22] HOLTON J R. The influence of gravity wave breaking on the general circulation of the middle atmosphere[J]. Journal of the Atmospheric Sciences, 1983, 40(10): 2497-2507 doi: 10.1175/1520-0469(1983)040<2497:tiogwb>2.0.co;2 [23] GARCIA R R, SOLOMON S. The effect of breaking gravity waves on the dynamics and chemical composition of the mesosphere and lower thermosphere[J]. Journal of Geophysical Research: Atmospheres, 1985, 90(D2): 3850-3868 doi: 10.1029/JD090iD02p03850 [24] ROBLE R G, DICKINSON R E. How will changes in carbon dioxide and methane modify the mean structure of the mesosphere and thermosphere?[J]. Geophysical Research Letters, 1989, 16(12): 1441-1444 doi: 10.1029/GL016i012p01441 [25] SOLOMON S C, LIU H L, MARSH D R, et al. Whole atmosphere climate change: dependence on solar activity[J]. Journal of Geophysical Research: Space Physics, 2019, 124(5): 3799-3809 doi: 10.1029/2019JA026678 [26] OFFERMANN D, DONNER M, KNIELING P, et al. Middle atmosphere temperature changes and the duration of summer[J]. Journal of Atmospheric and Solar-Terrestrial Physics, 2004, 66(6/7/8/9): 437-450 doi: 10.1016/j.jastp.2004.01.028 [27] SCHMIDT C, KÜCHELBACHER L, WÜST S, et al. OH airglow observations with two identical spectrometers: benefits of increased data homogeneity in the identification of variations induced by the 11-year solar cycle, the QBO, and other factors[J]. Atmospheric Measurement Techniques, 2023, 16(19): 4331-4356 doi: 10.5194/amt-16-4331-2023 -
-

 下载:
下载:

计量
- 文章访问数: 466
- HTML全文浏览量: 86
- PDF下载量: 65
-
被引次数:
0(来源:Crossref)
0(来源:其他)

