


基于SWARM-C卫星数据对HASDM模型的热层大气密度误差分析
doi: 10.11728/cjss2026.01.2025-0012 cstr: 32142.14.cjss.2025-0012
-
 吴尧 男, 2001年1月出生于福建省福州市, 现为昆明理工大学国土资源工程学院硕士研究生, 主要研究方向为高层大气密度的建模和修正. E-mail: wuyao@kust.stu.edu.cn
 -
 陈俊宇 男, 1989年1月出生于云南省大理市, 现为昆明理工大学国土资源工程学院讲师, 硕士研究生导师, 主要研究方向为空间态势感知. E-mail: jychen@kust.edu.cn
作者简介:
通讯作者:
Error Analysis of Thermosphere Atmospheric Density for HASDM Method Based on SWARM-C Satellite Data
-
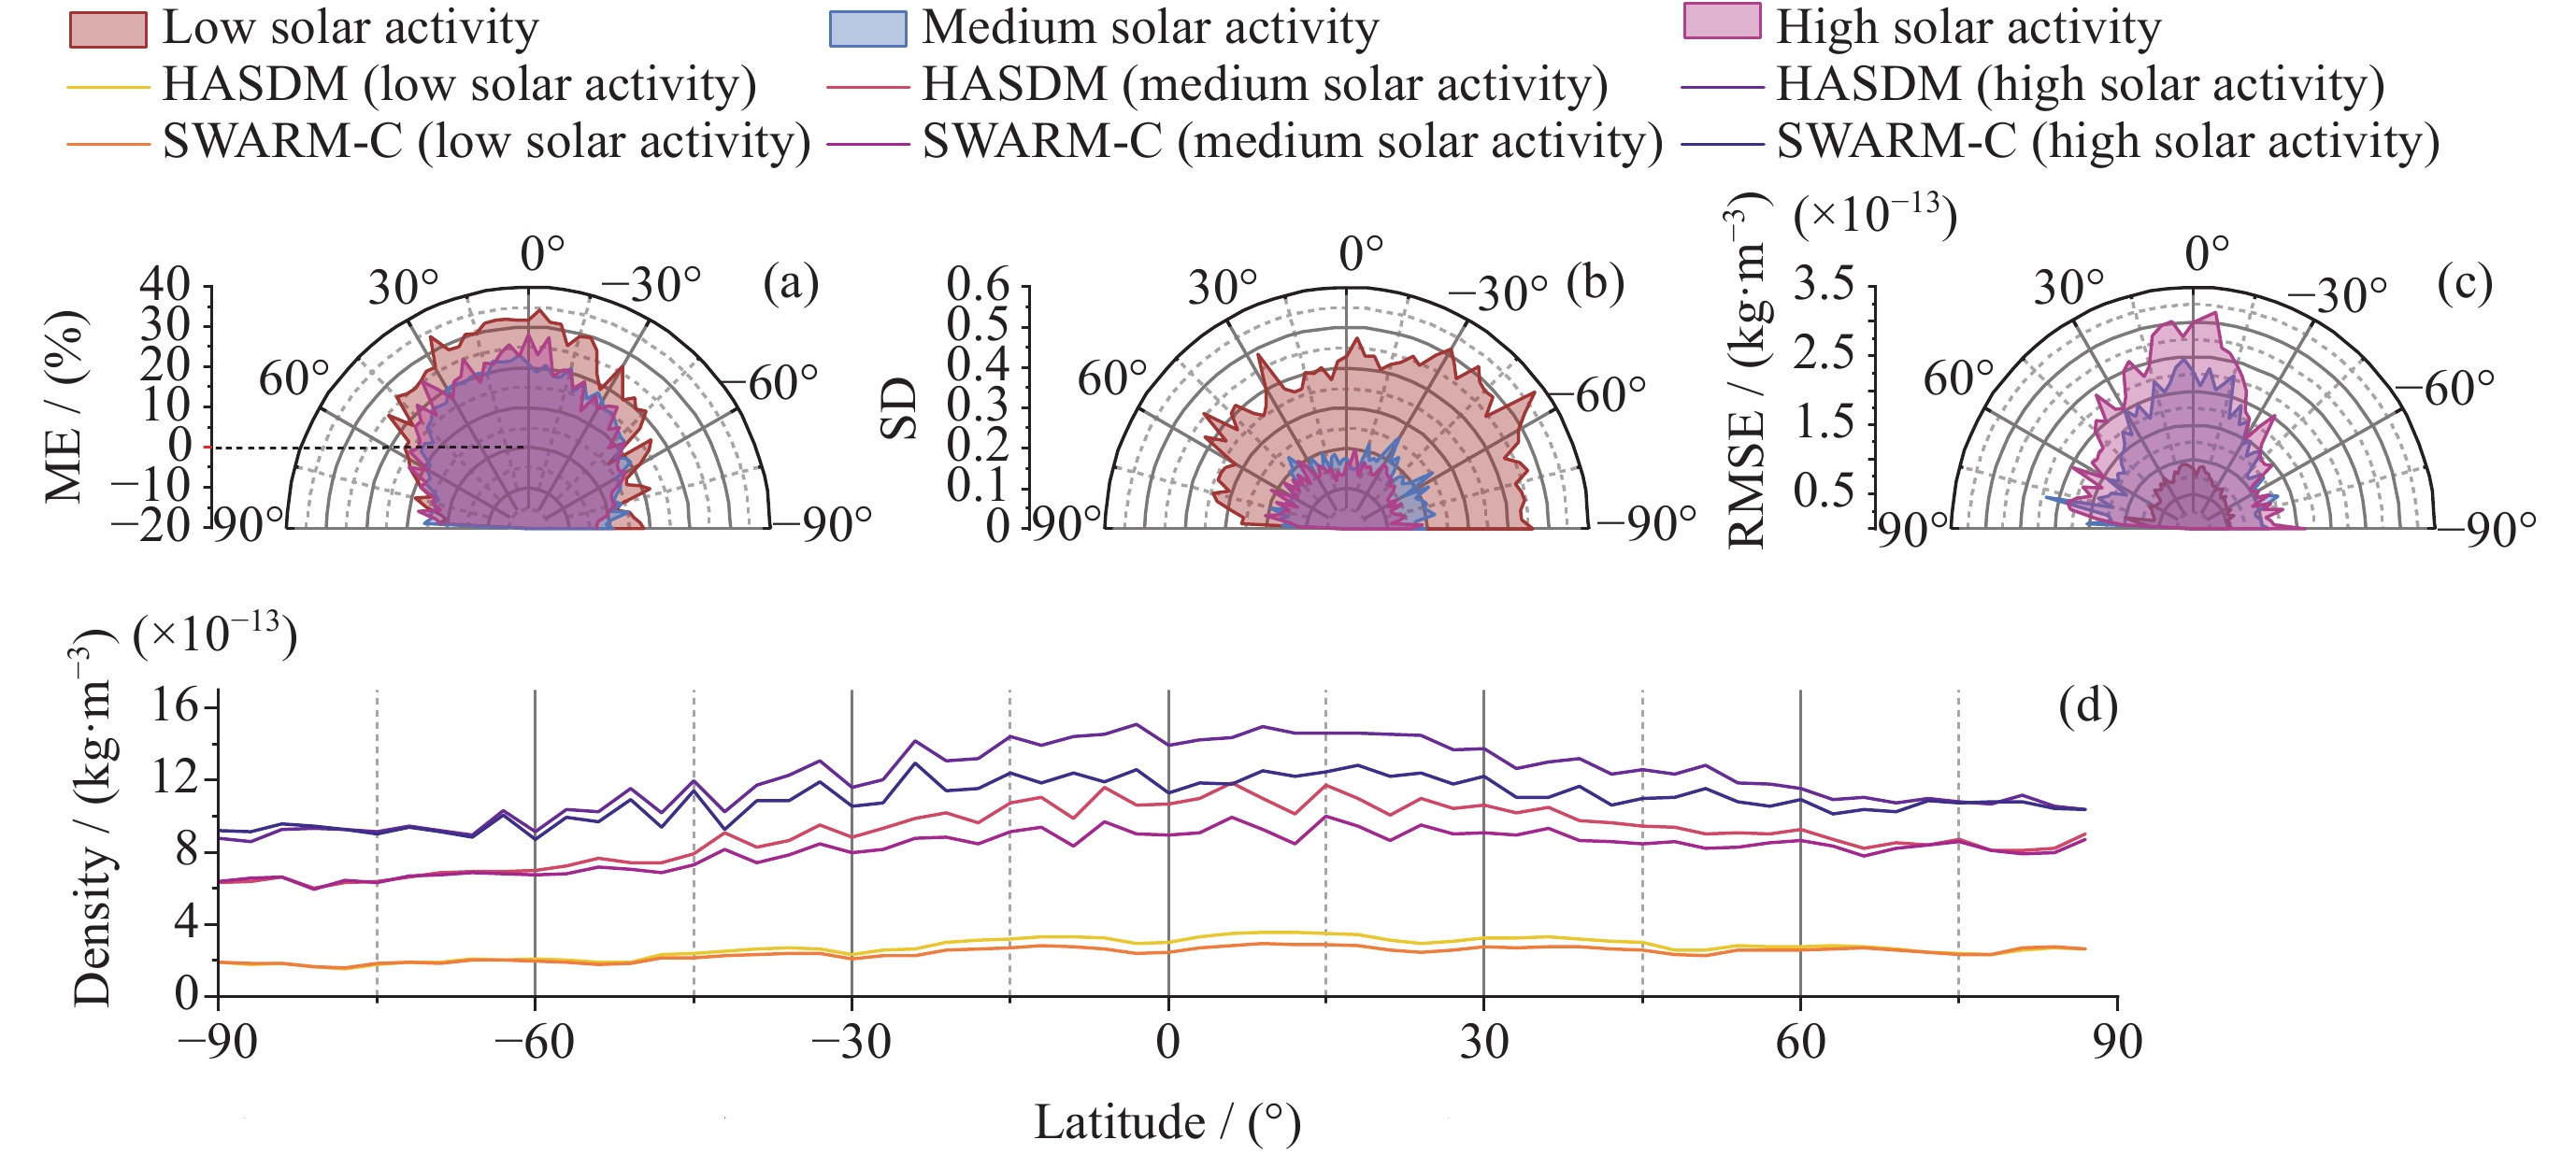
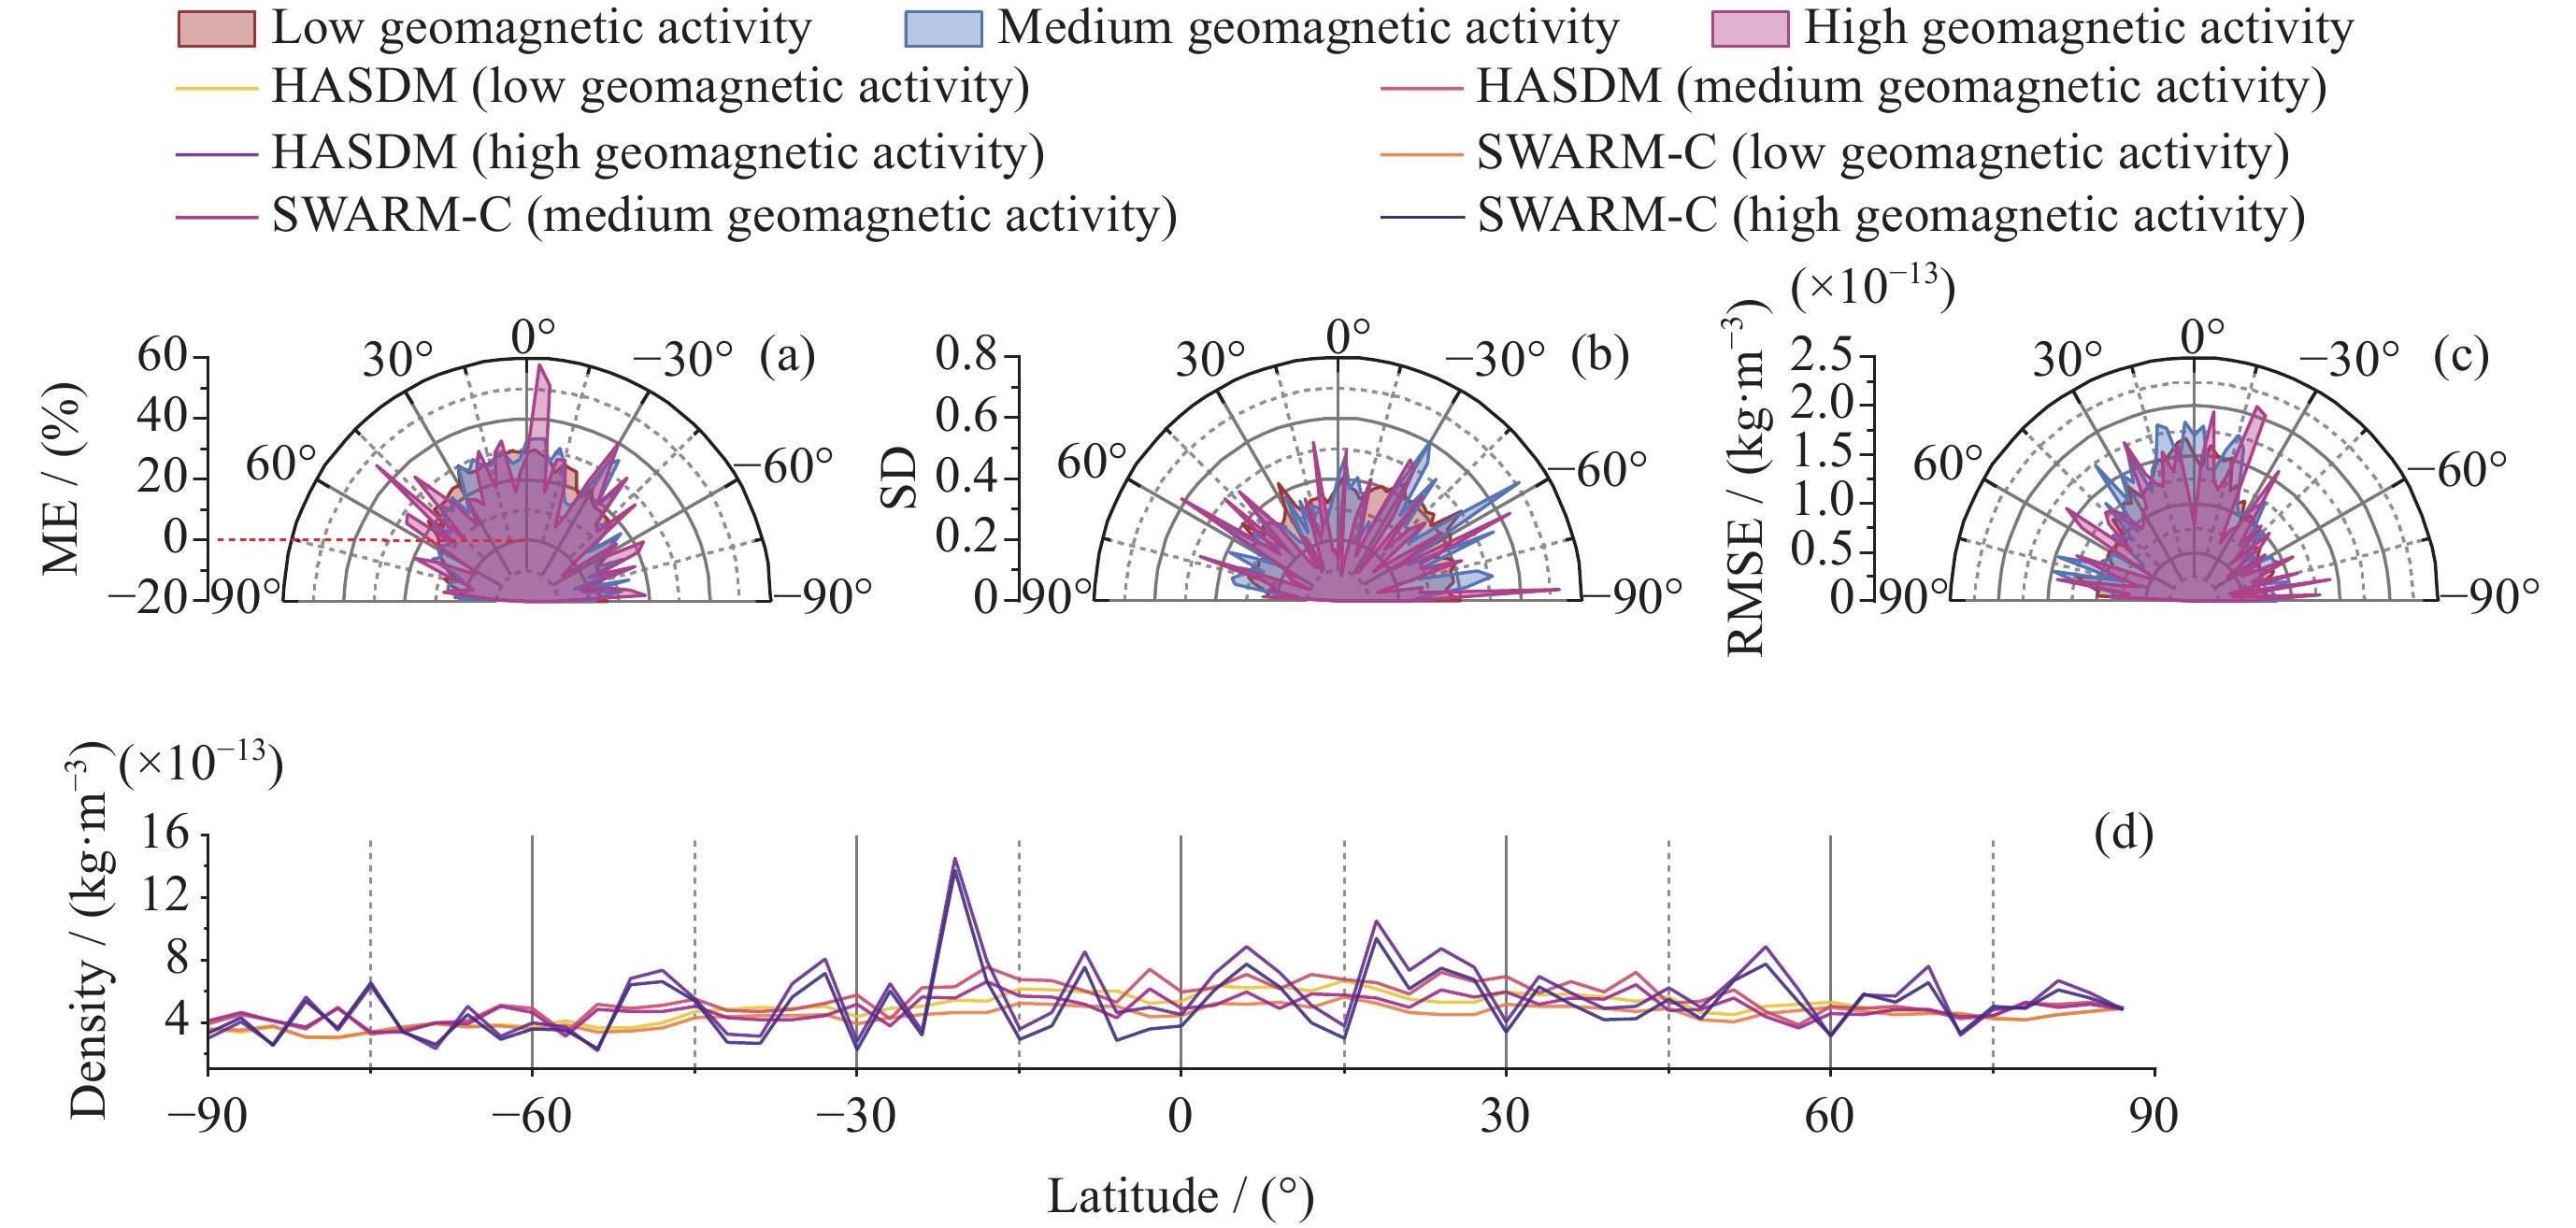
摘要: 准确计算大气密度对卫星及空间碎片的精密轨道预报至关重要. 基于2014-2019年SWARM-C卫星加速度计反演的大气密度数据, 分析高精度大气模型(High Accuracy Satellite Drag Model, HASDM)的误差特性, 及其在不同空间环境下的性能差异. 结果显示, 太阳活动对HASDM影响显著, 中高太阳活动年模型平均偏差约为12.5%, 标准差约为0.2; 低太阳活动年偏差增大至约18.7%, 标准差增大至约0.4; 地磁活动期间, 模型整体偏差稳定在17%左右, 标准差约达0.4; 纬度分布上, 极区偏差最低, 为5%~10%, 但南极高纬标准差高于北极; 赤道区域偏差最大, 为20%~30%; 地方时分布上, 03:00-06:00 LST与18:00-24:00 LST的误差峰值达20%; 磁暴期间, HASDM在初相易高估密度, 主相误差波动剧烈, 恢复相逐渐趋稳. 本研究为改进大气密度模型的太阳活动参数化和区域性校准提供了关键依据.Abstract: Accurate thermosphere density modeling is a prerequisite for reliable orbit prediction of satellites and space debris, particularly under the growing demands of modern space traffic management in low Earth orbit. This study systematically evaluates the performance of the High Accuracy Satellite Drag Model (HASDM) using thermosphere density data retrieved from SWARM-C satellite accelerometer measurements spanning the period 2014-2019. The analysis investigates model bias and variability in response to different solar and geomagnetic activity levels, as well as latitude and local time dependencies. Results indicate that solar activity exerts a marked influence on model performance: during moderate to high solar activity years, HASDM exhibits a mean bias of approximately 12.5% with a standard deviation near 0.2, whereas under low solar activity conditions, the bias increases to 18.7% and the standard deviation rises to 0.4. During geomagnetic disturbances, the model maintains an average bias about 17%, though with an elevated standard deviation, particularly during the main phase of storms. In terms of spatial distribution, polar regions demonstrate the lowest bias (5%~10%), with relatively larger variability in the southern hemisphere; conversely, equatorial regions present the highest biases, ranging between 20% and 30%. The diurnal pattern further reveals peak modeling errors during 03:00-06:00 LST and 18:00-24:00 LST, highlighting limitations in representing nighttime density variations. Additionally, during geomagnetic storms, HASDM tends to overestimate density in the initial phase, displays significant fluctuations in the main phase, and gradually stabilizes during recovery. These findings highlight systematic deficiencies in existing empirical parameterizations and suggest the necessity of incorporating enhanced solar-geophysical proxies and regionally adaptive corrections.
-
Key words:
- HASDM /
- SWARM /
- Orbital atmosphere /
- Error characteristics /
- Model correction
-
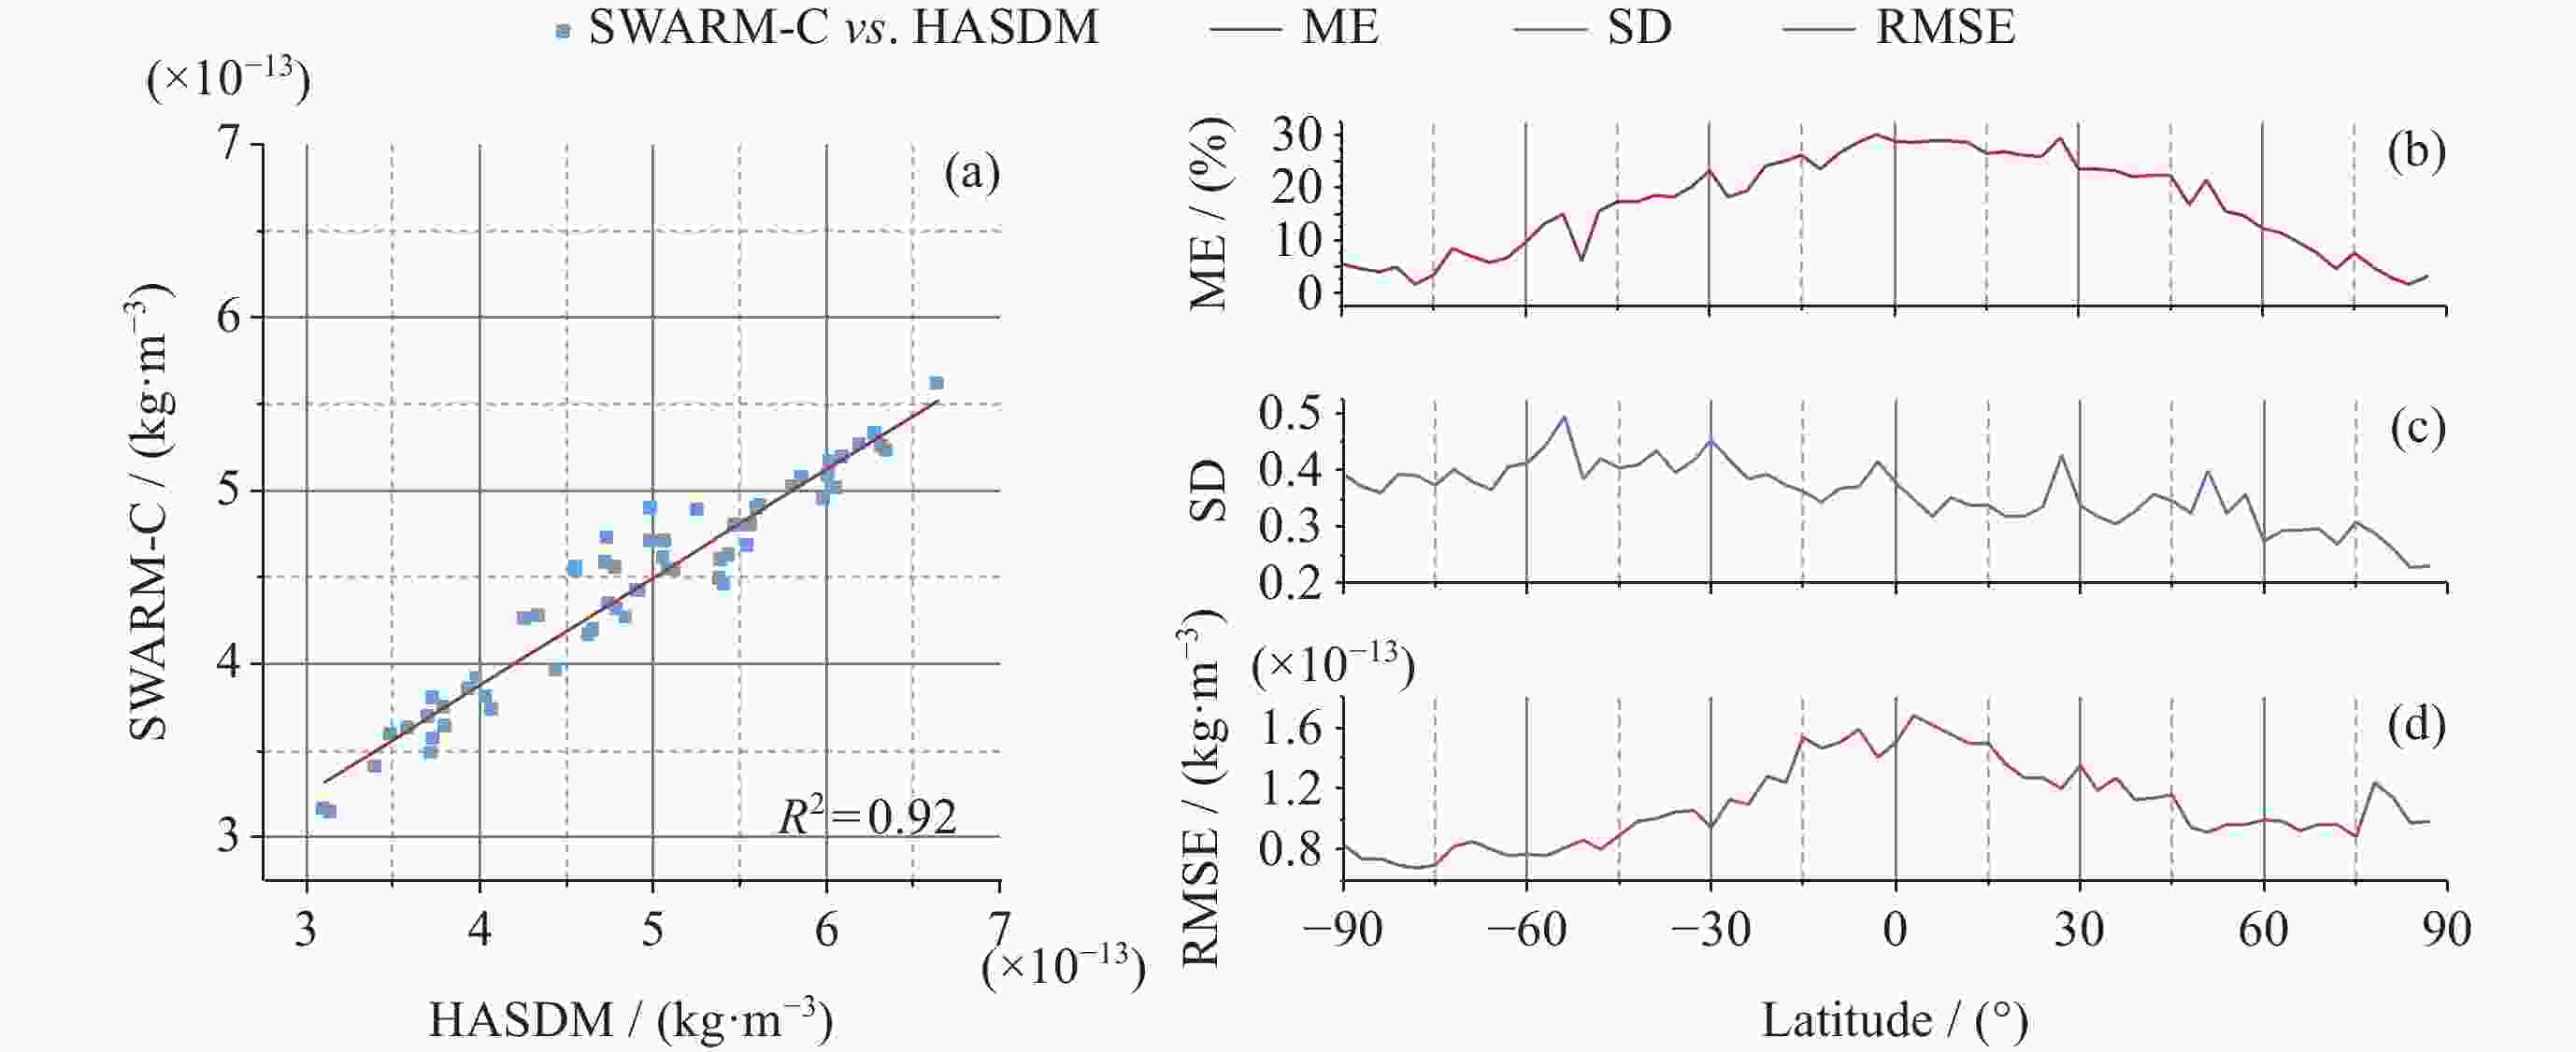
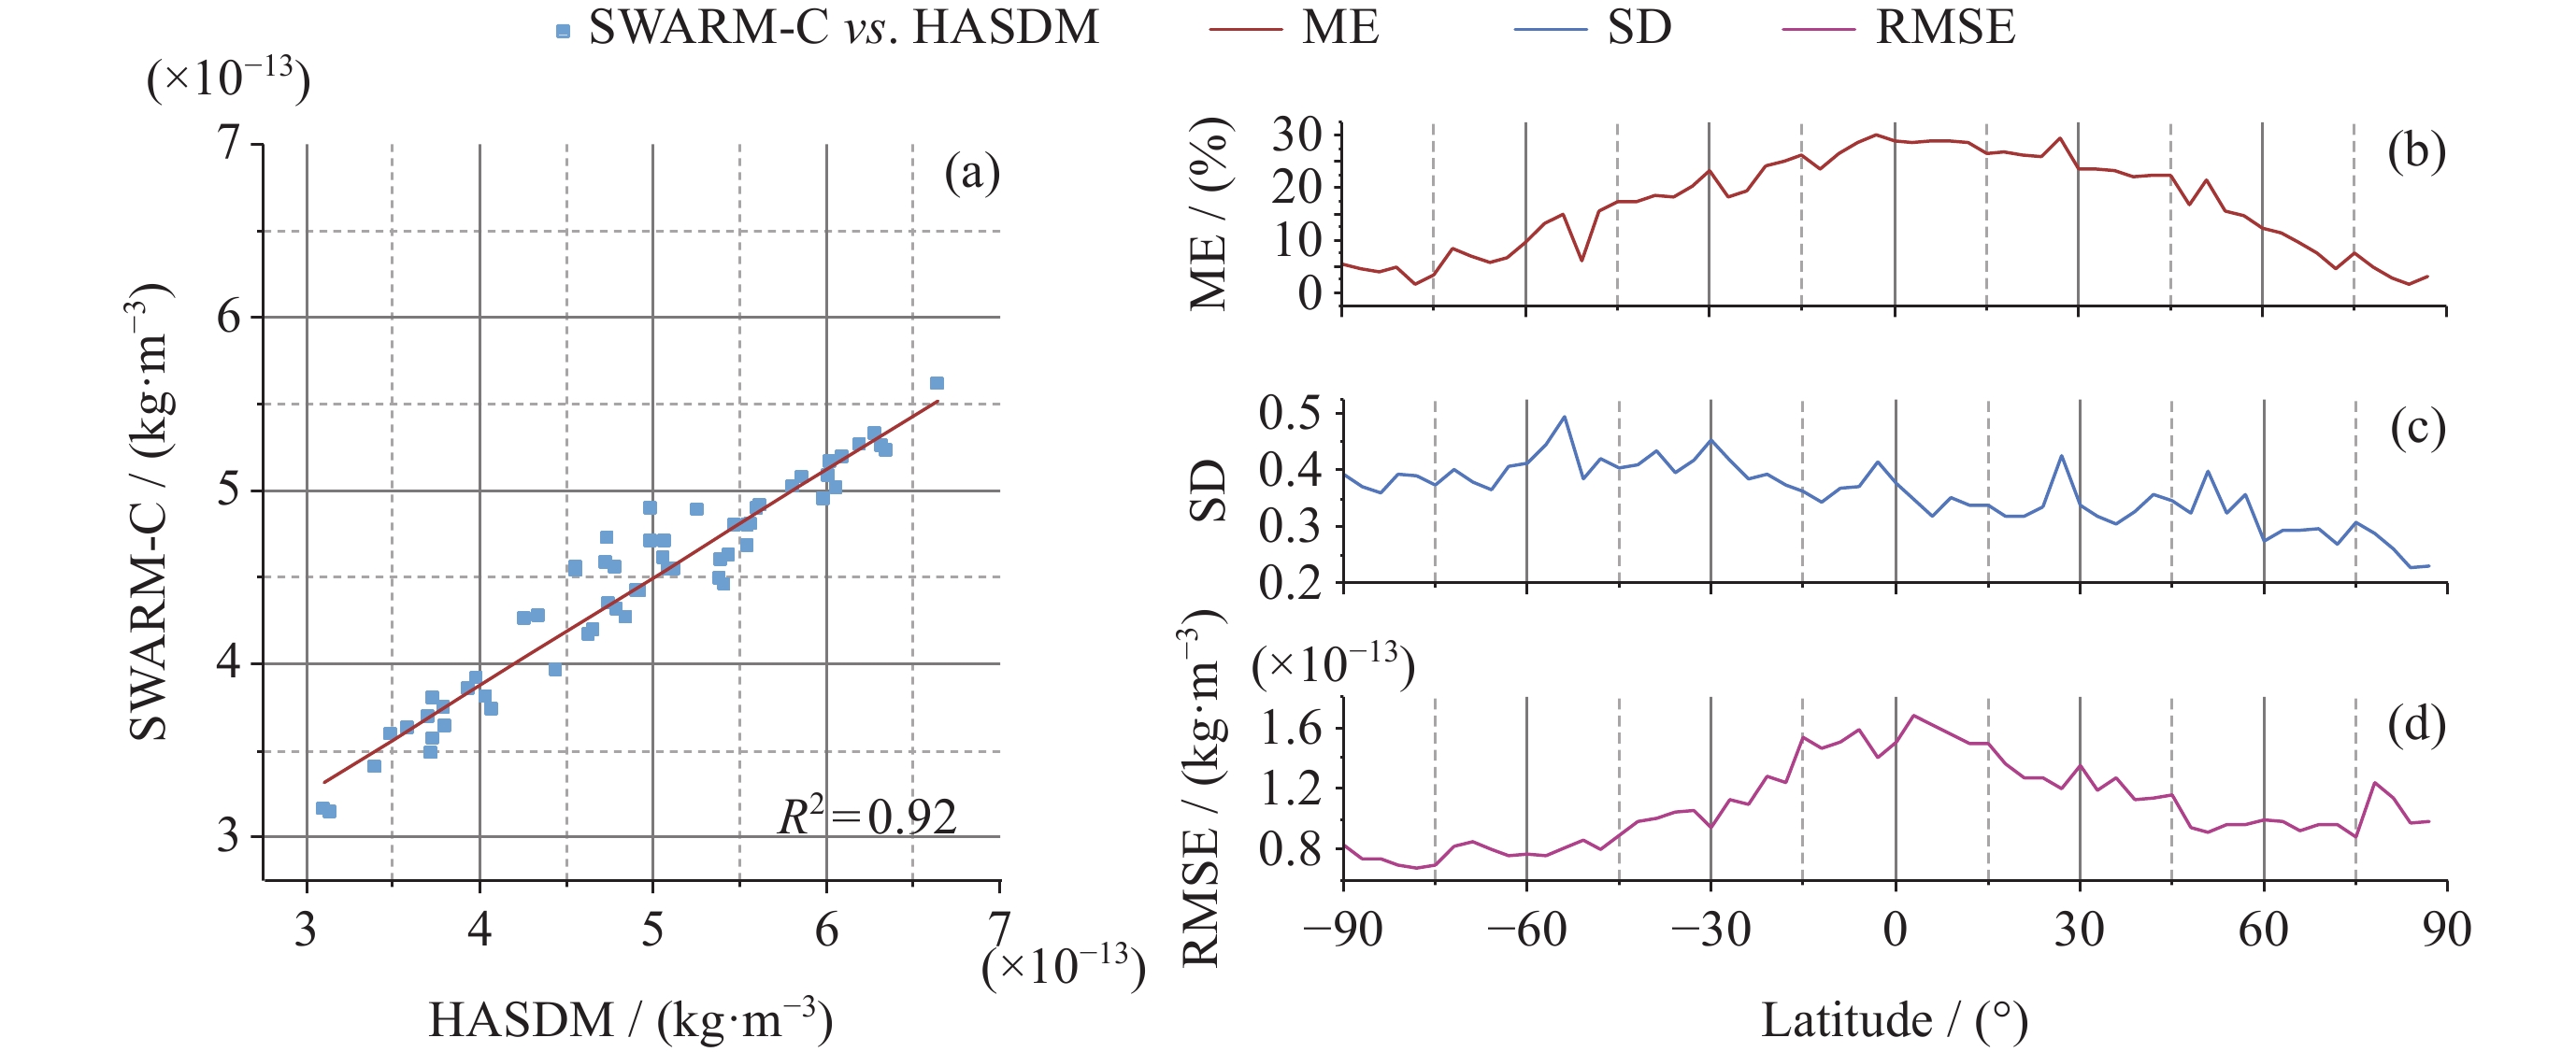
图 1 HASDM与SWARM-C在不同纬度的大气密度特征与误差
Figure 1. Atmospheric density characteristics and errors of HASDM and SWARM-C in different latitudes
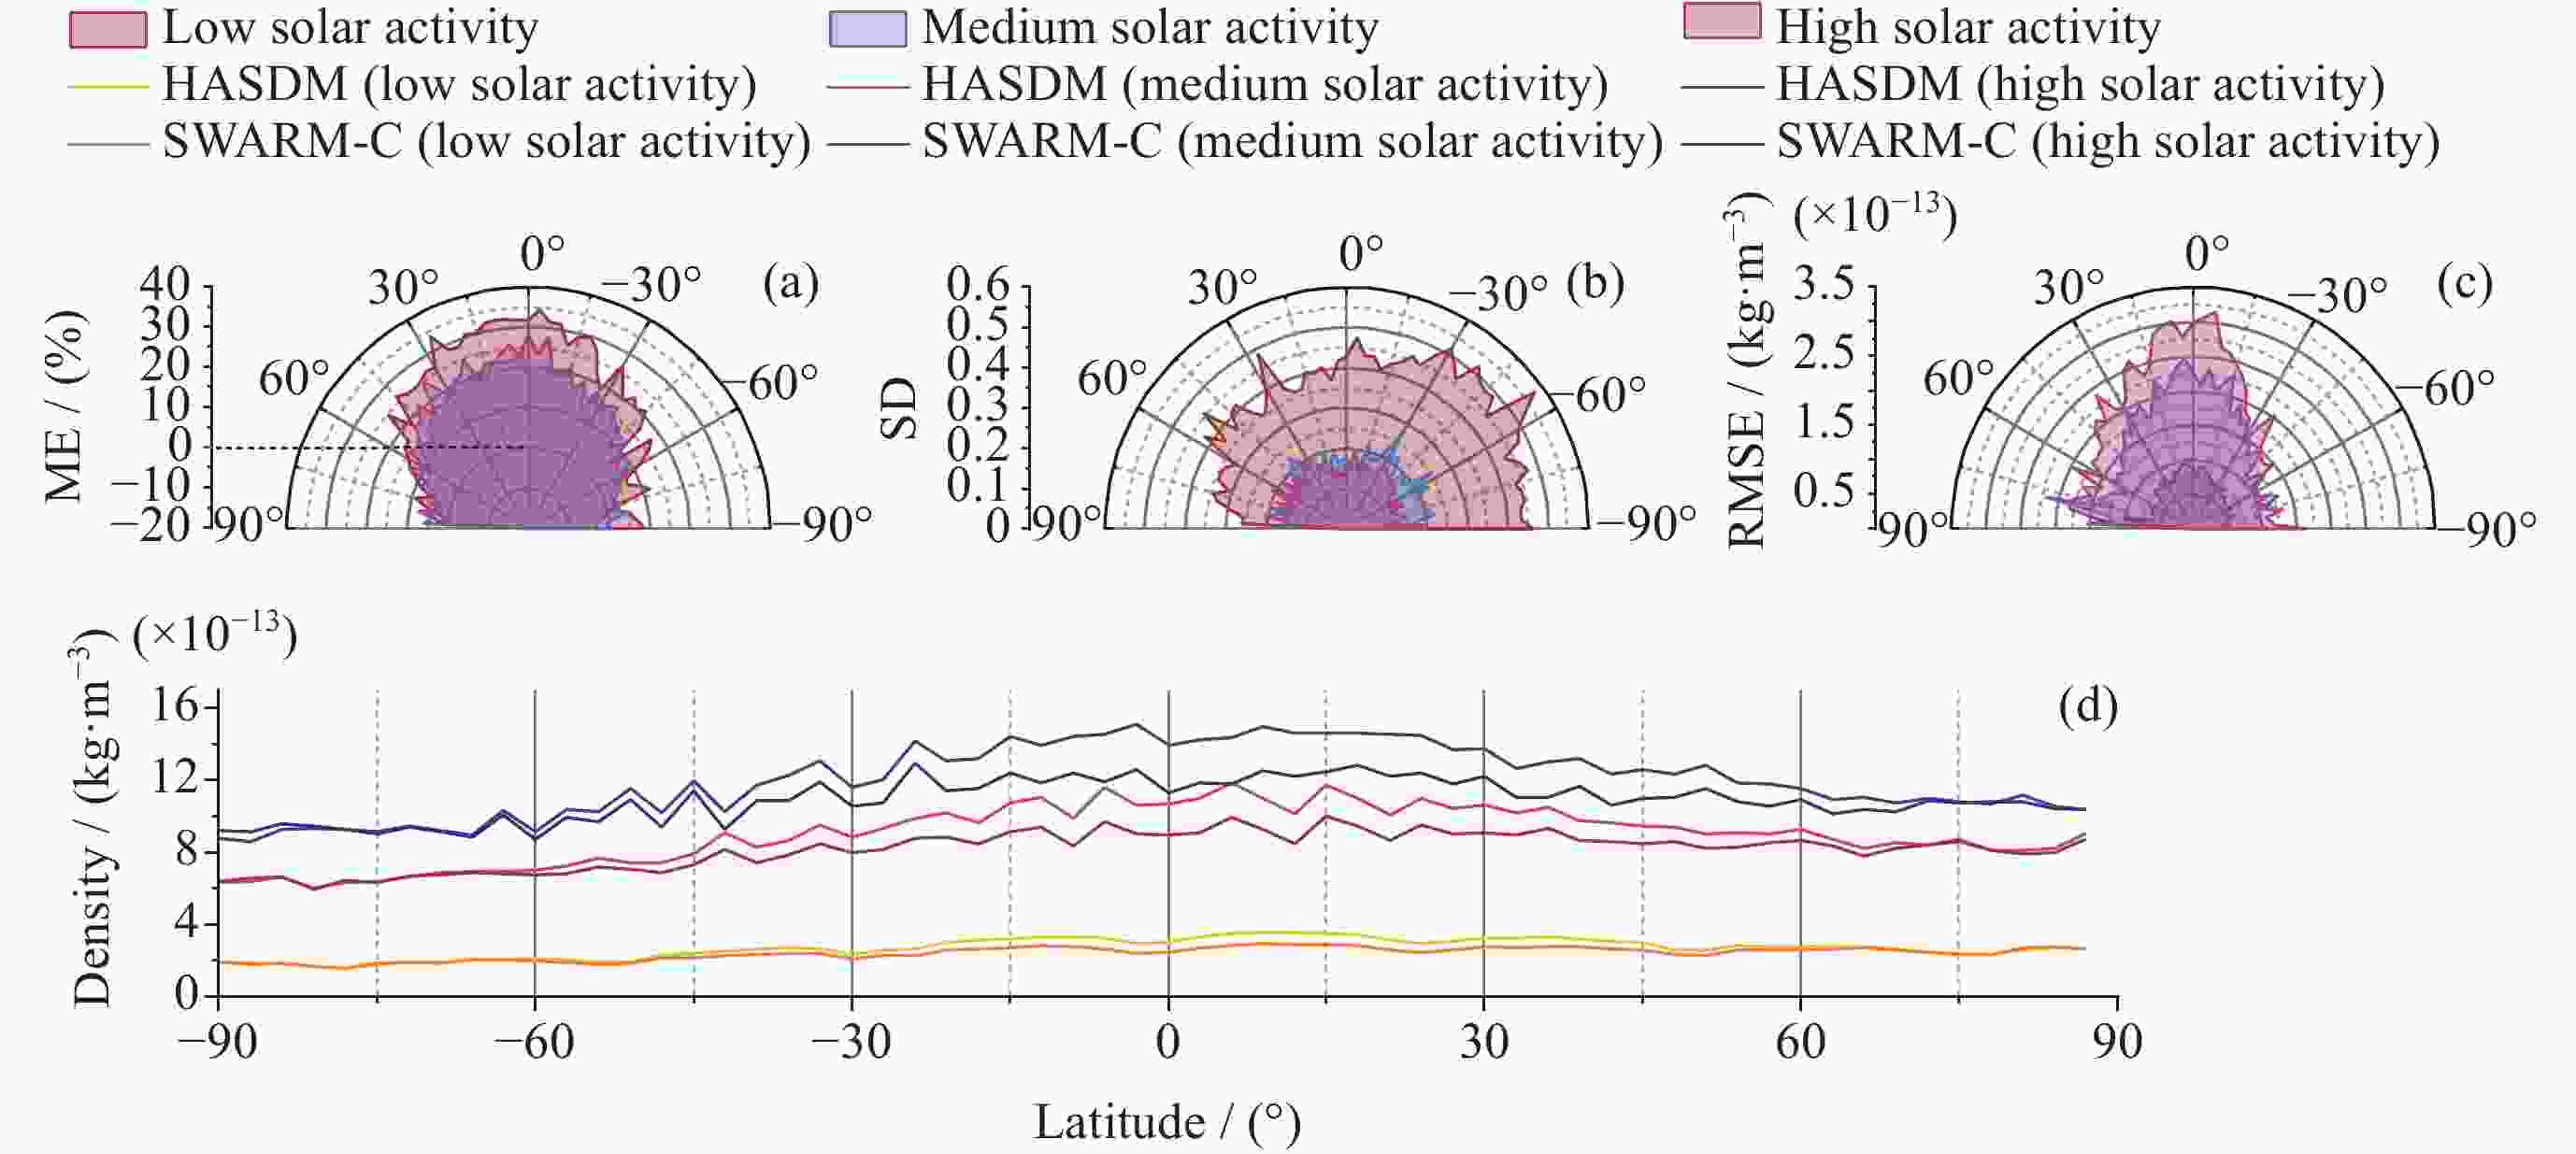
图 2 不同太阳活动条件下HASDM与SWARM-C的纬度误差与大气密度
Figure 2. Latitude error and atmospheric density between HASDM and SWARM-C under different solar activity levels
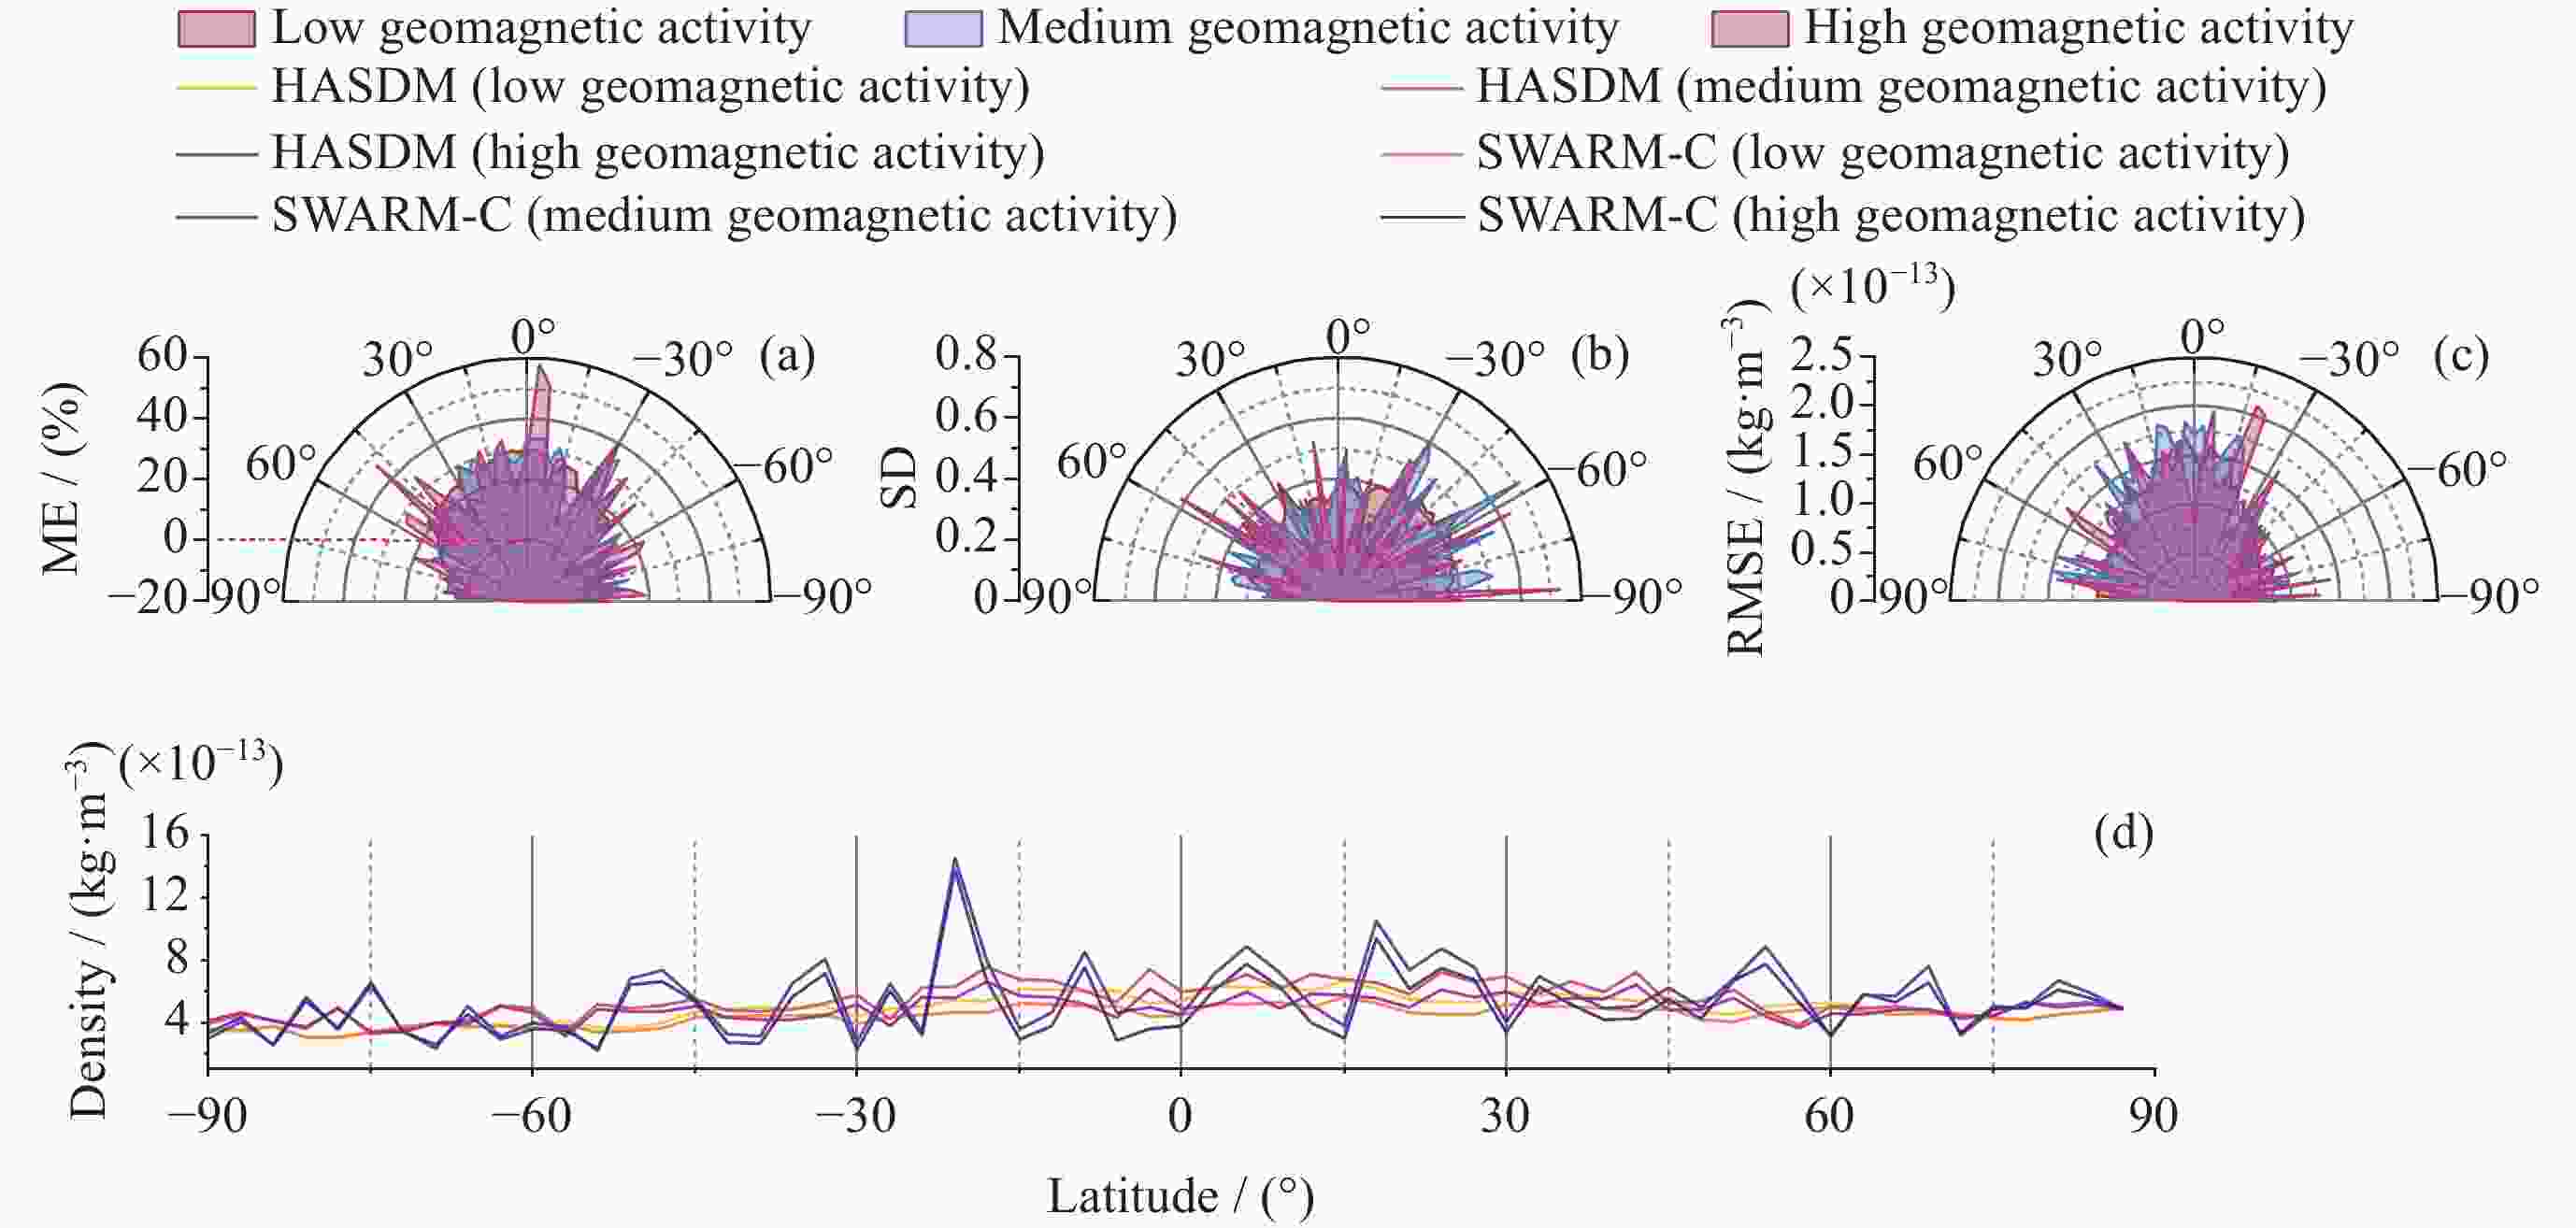
图 3 不同地磁活动条件下HASDM与SWARM-C的纬度误差与大气密度
Figure 3. Latitude error and atmospheric density between HASDM and SWARM-C under different geomagnetic activity levels
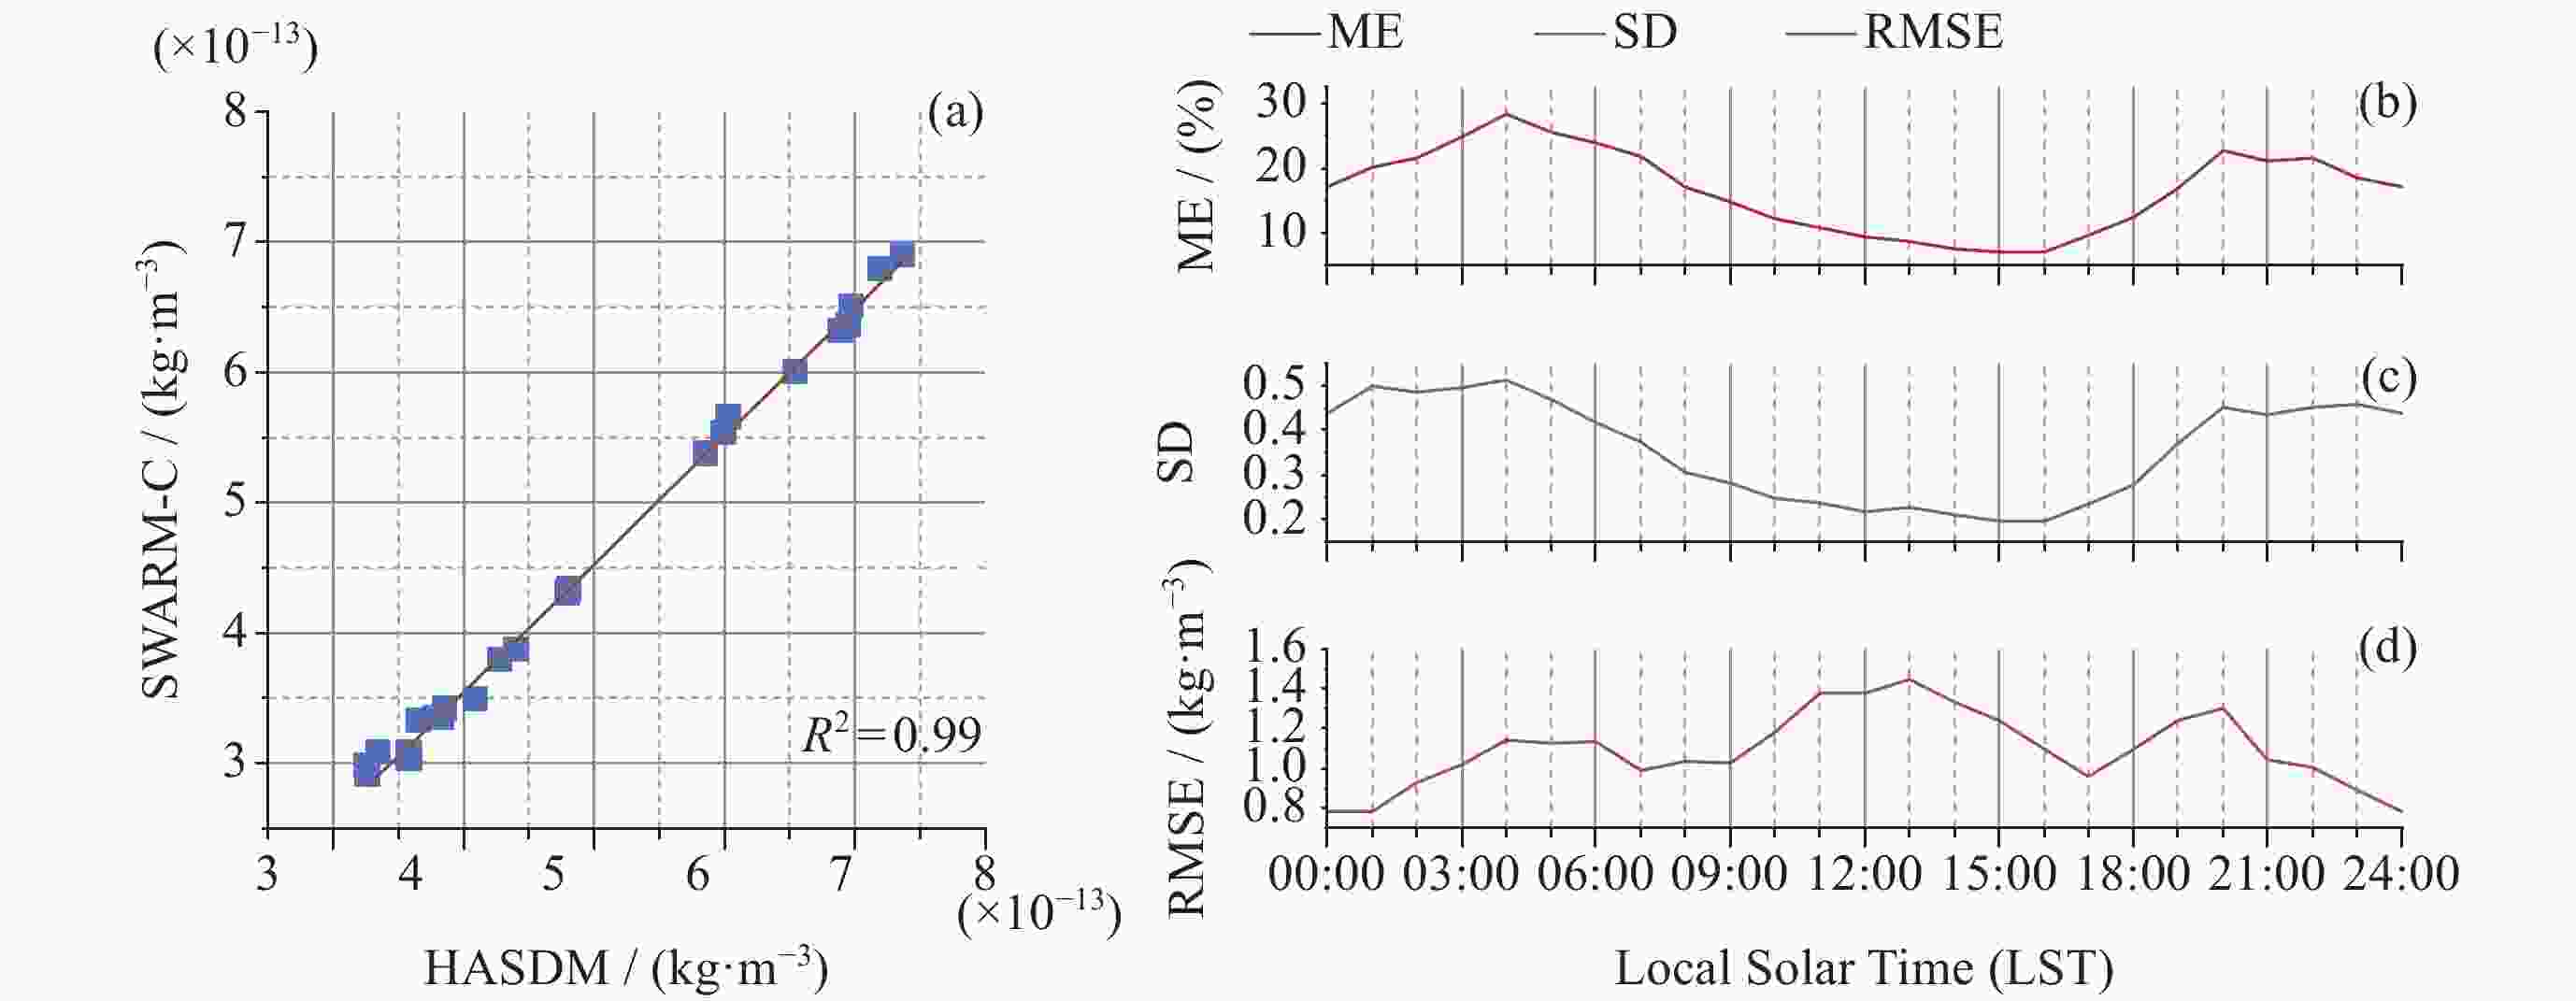
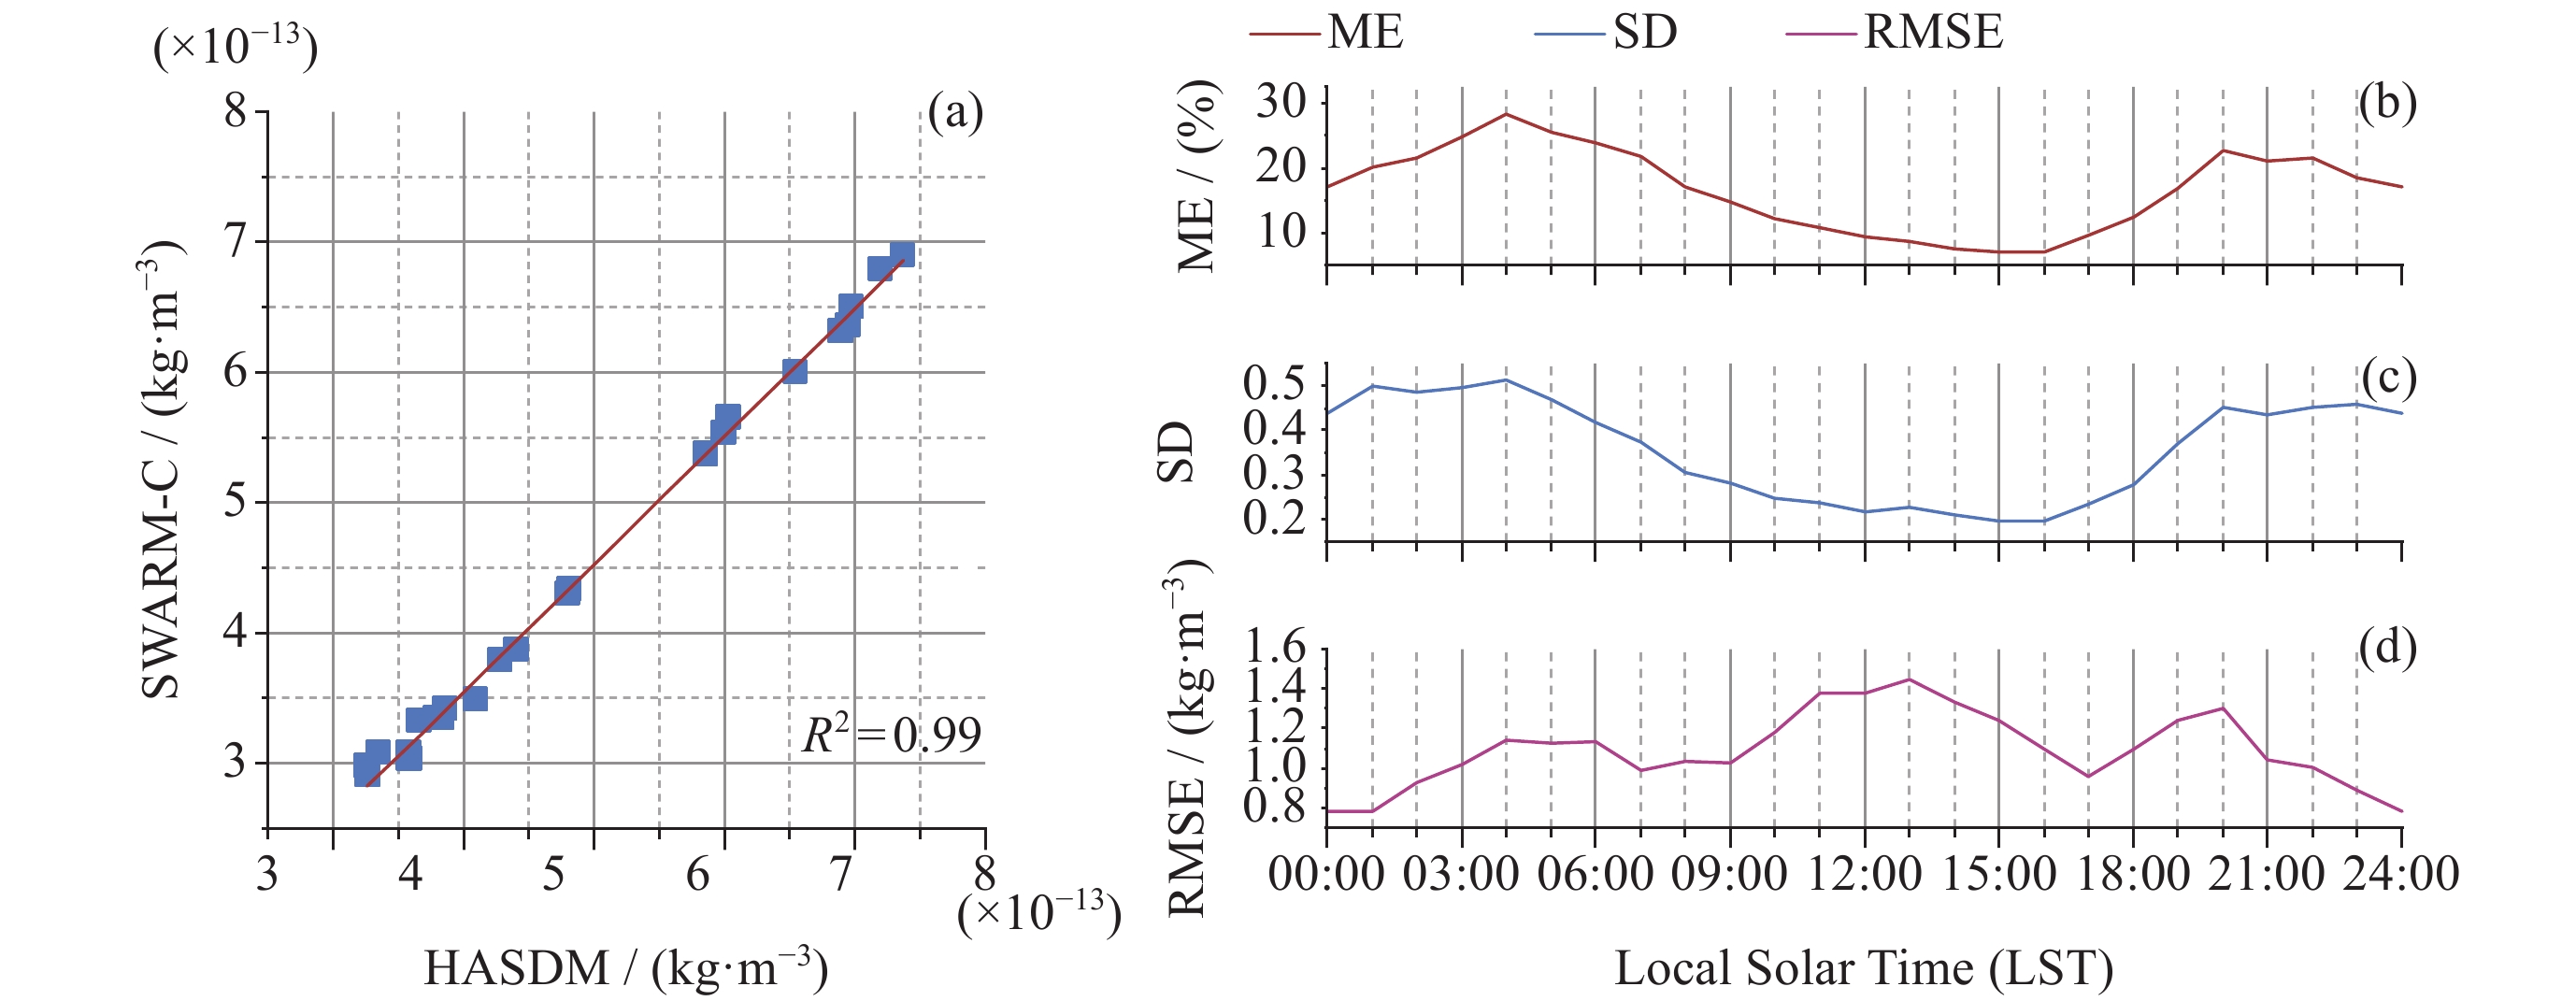
图 4 HASDM与SWARM-C在00:00-24:00 LST的大气密度分布与误差
Figure 4. Atmospheric density distribution and error of HASDM and SWARM-C during 00:00-24:00 LST

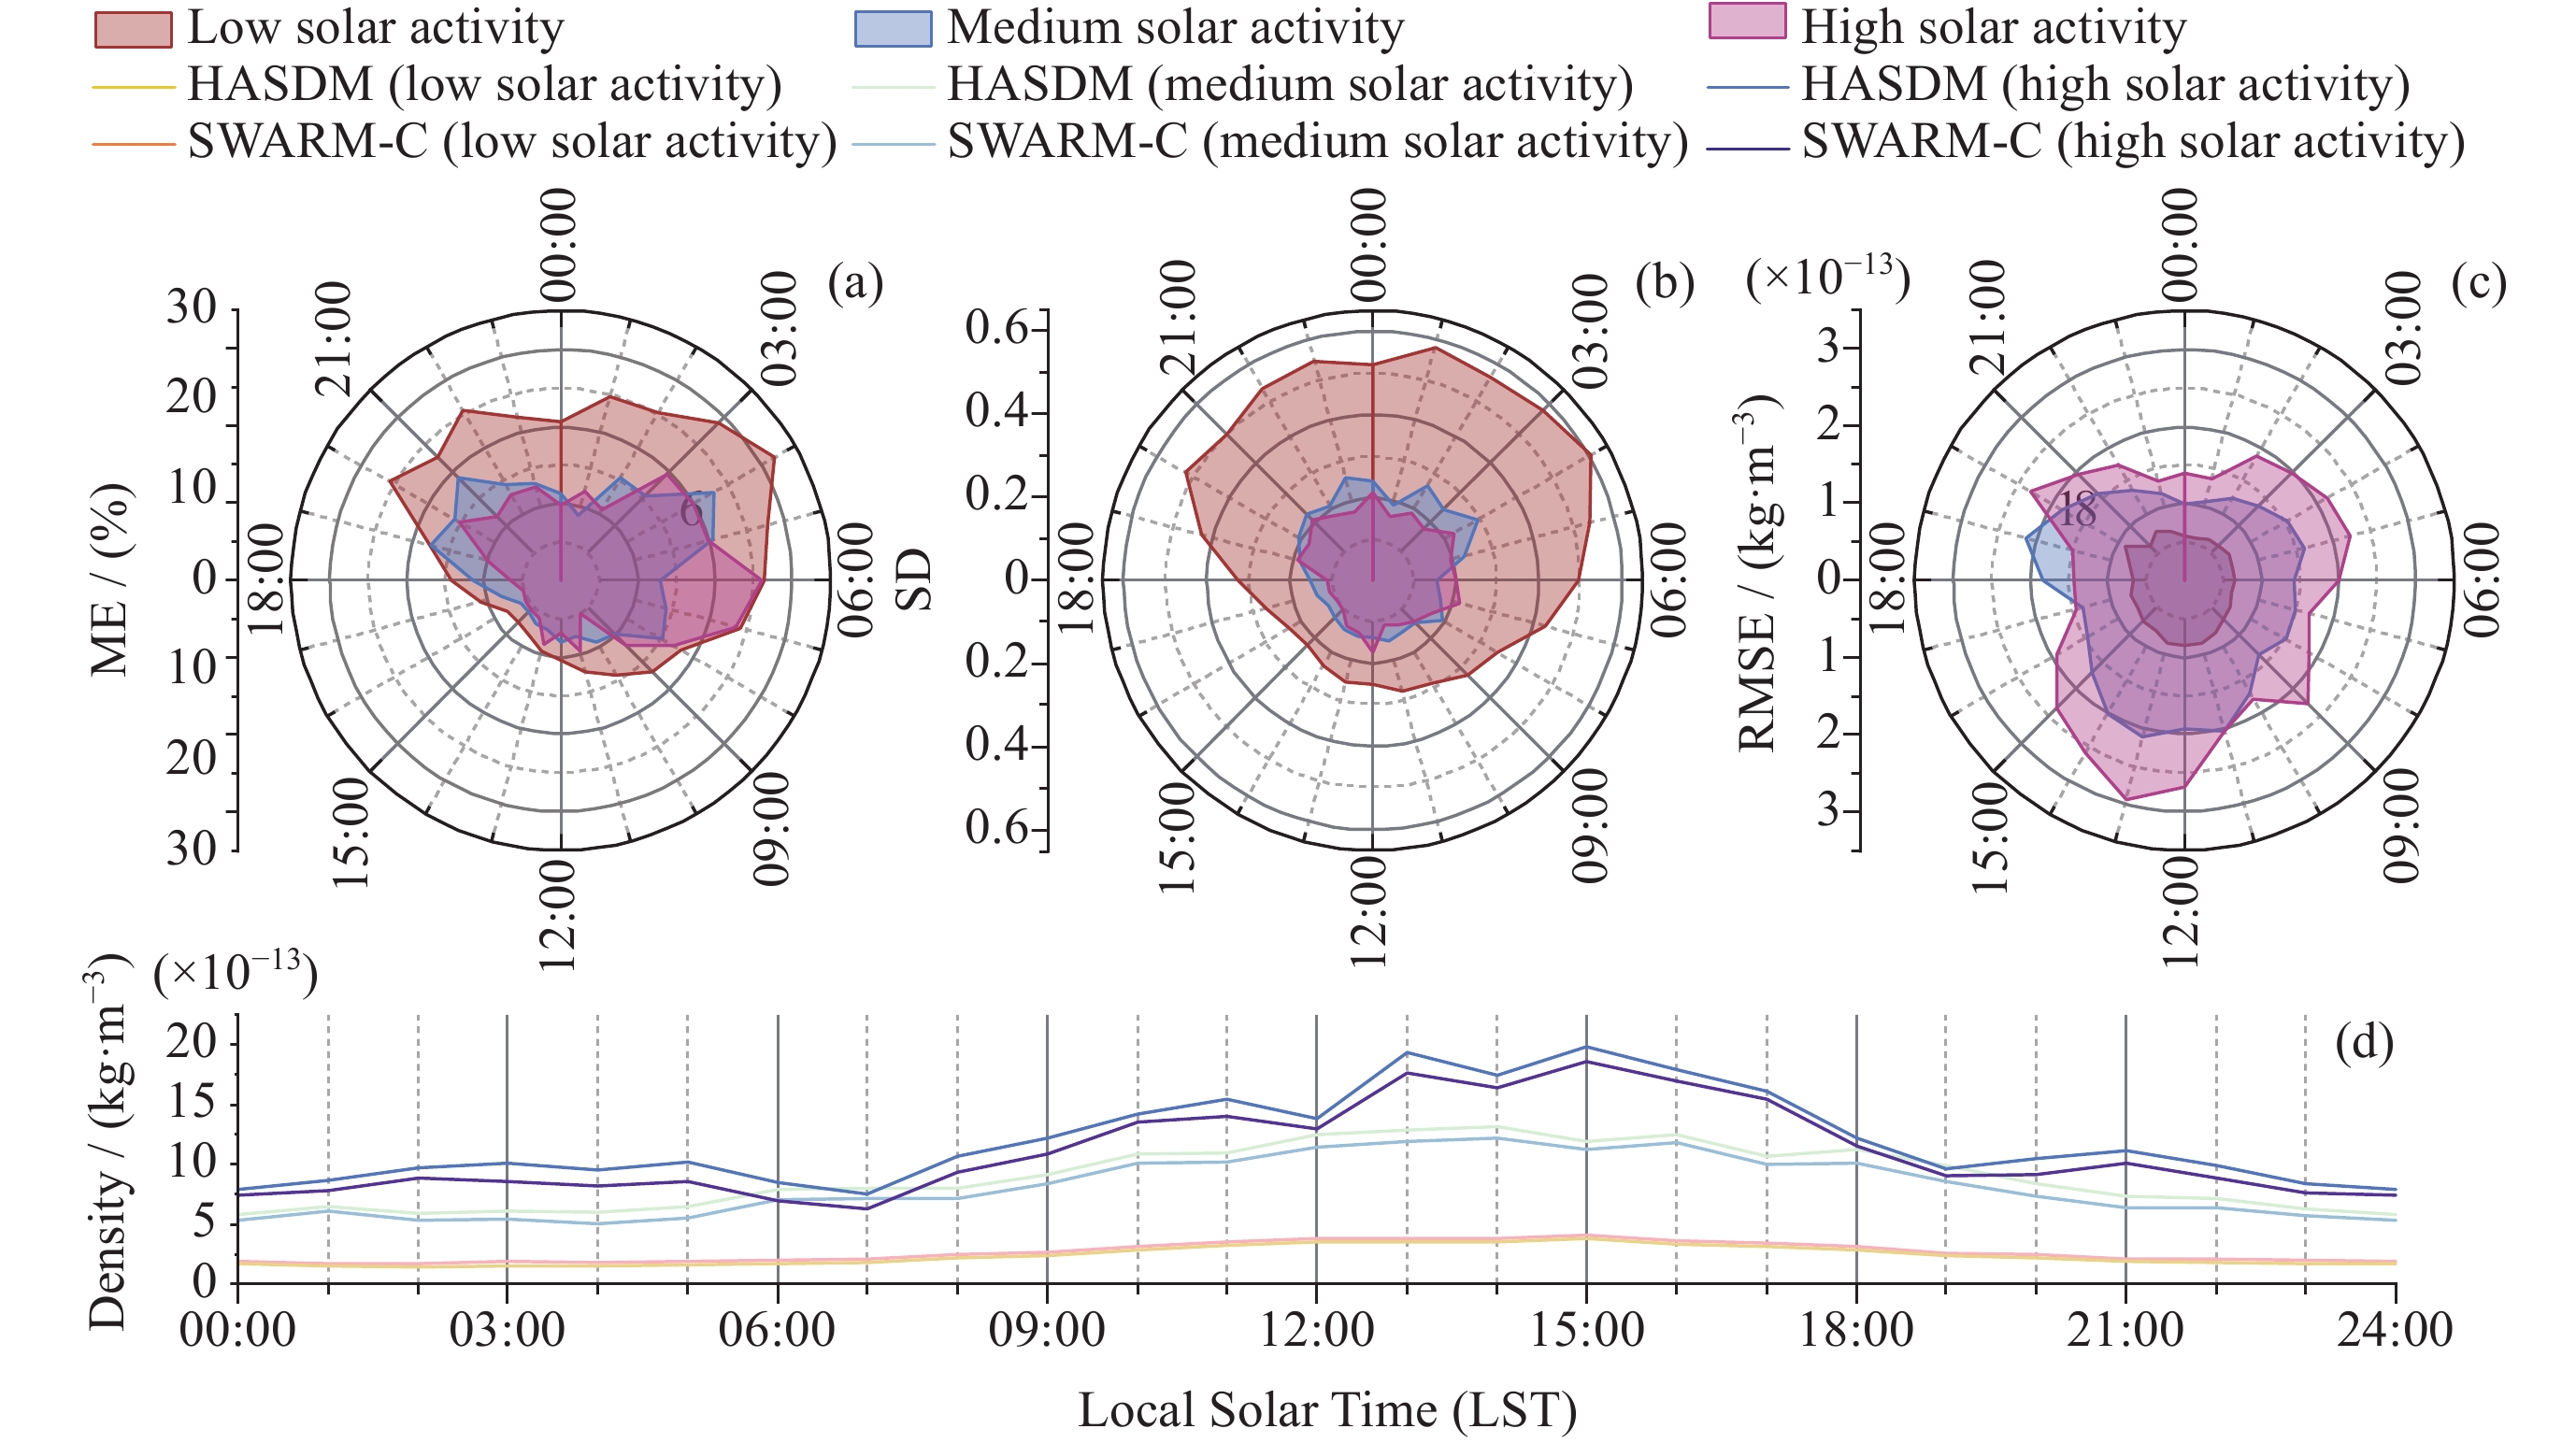
图 5 不同太阳活动条件下HASDM与SWARM-C不同LST的大气密度与误差
Figure 5. Atmospheric density and error of HASDM and SWARM-C at different LST under different solar activity levels
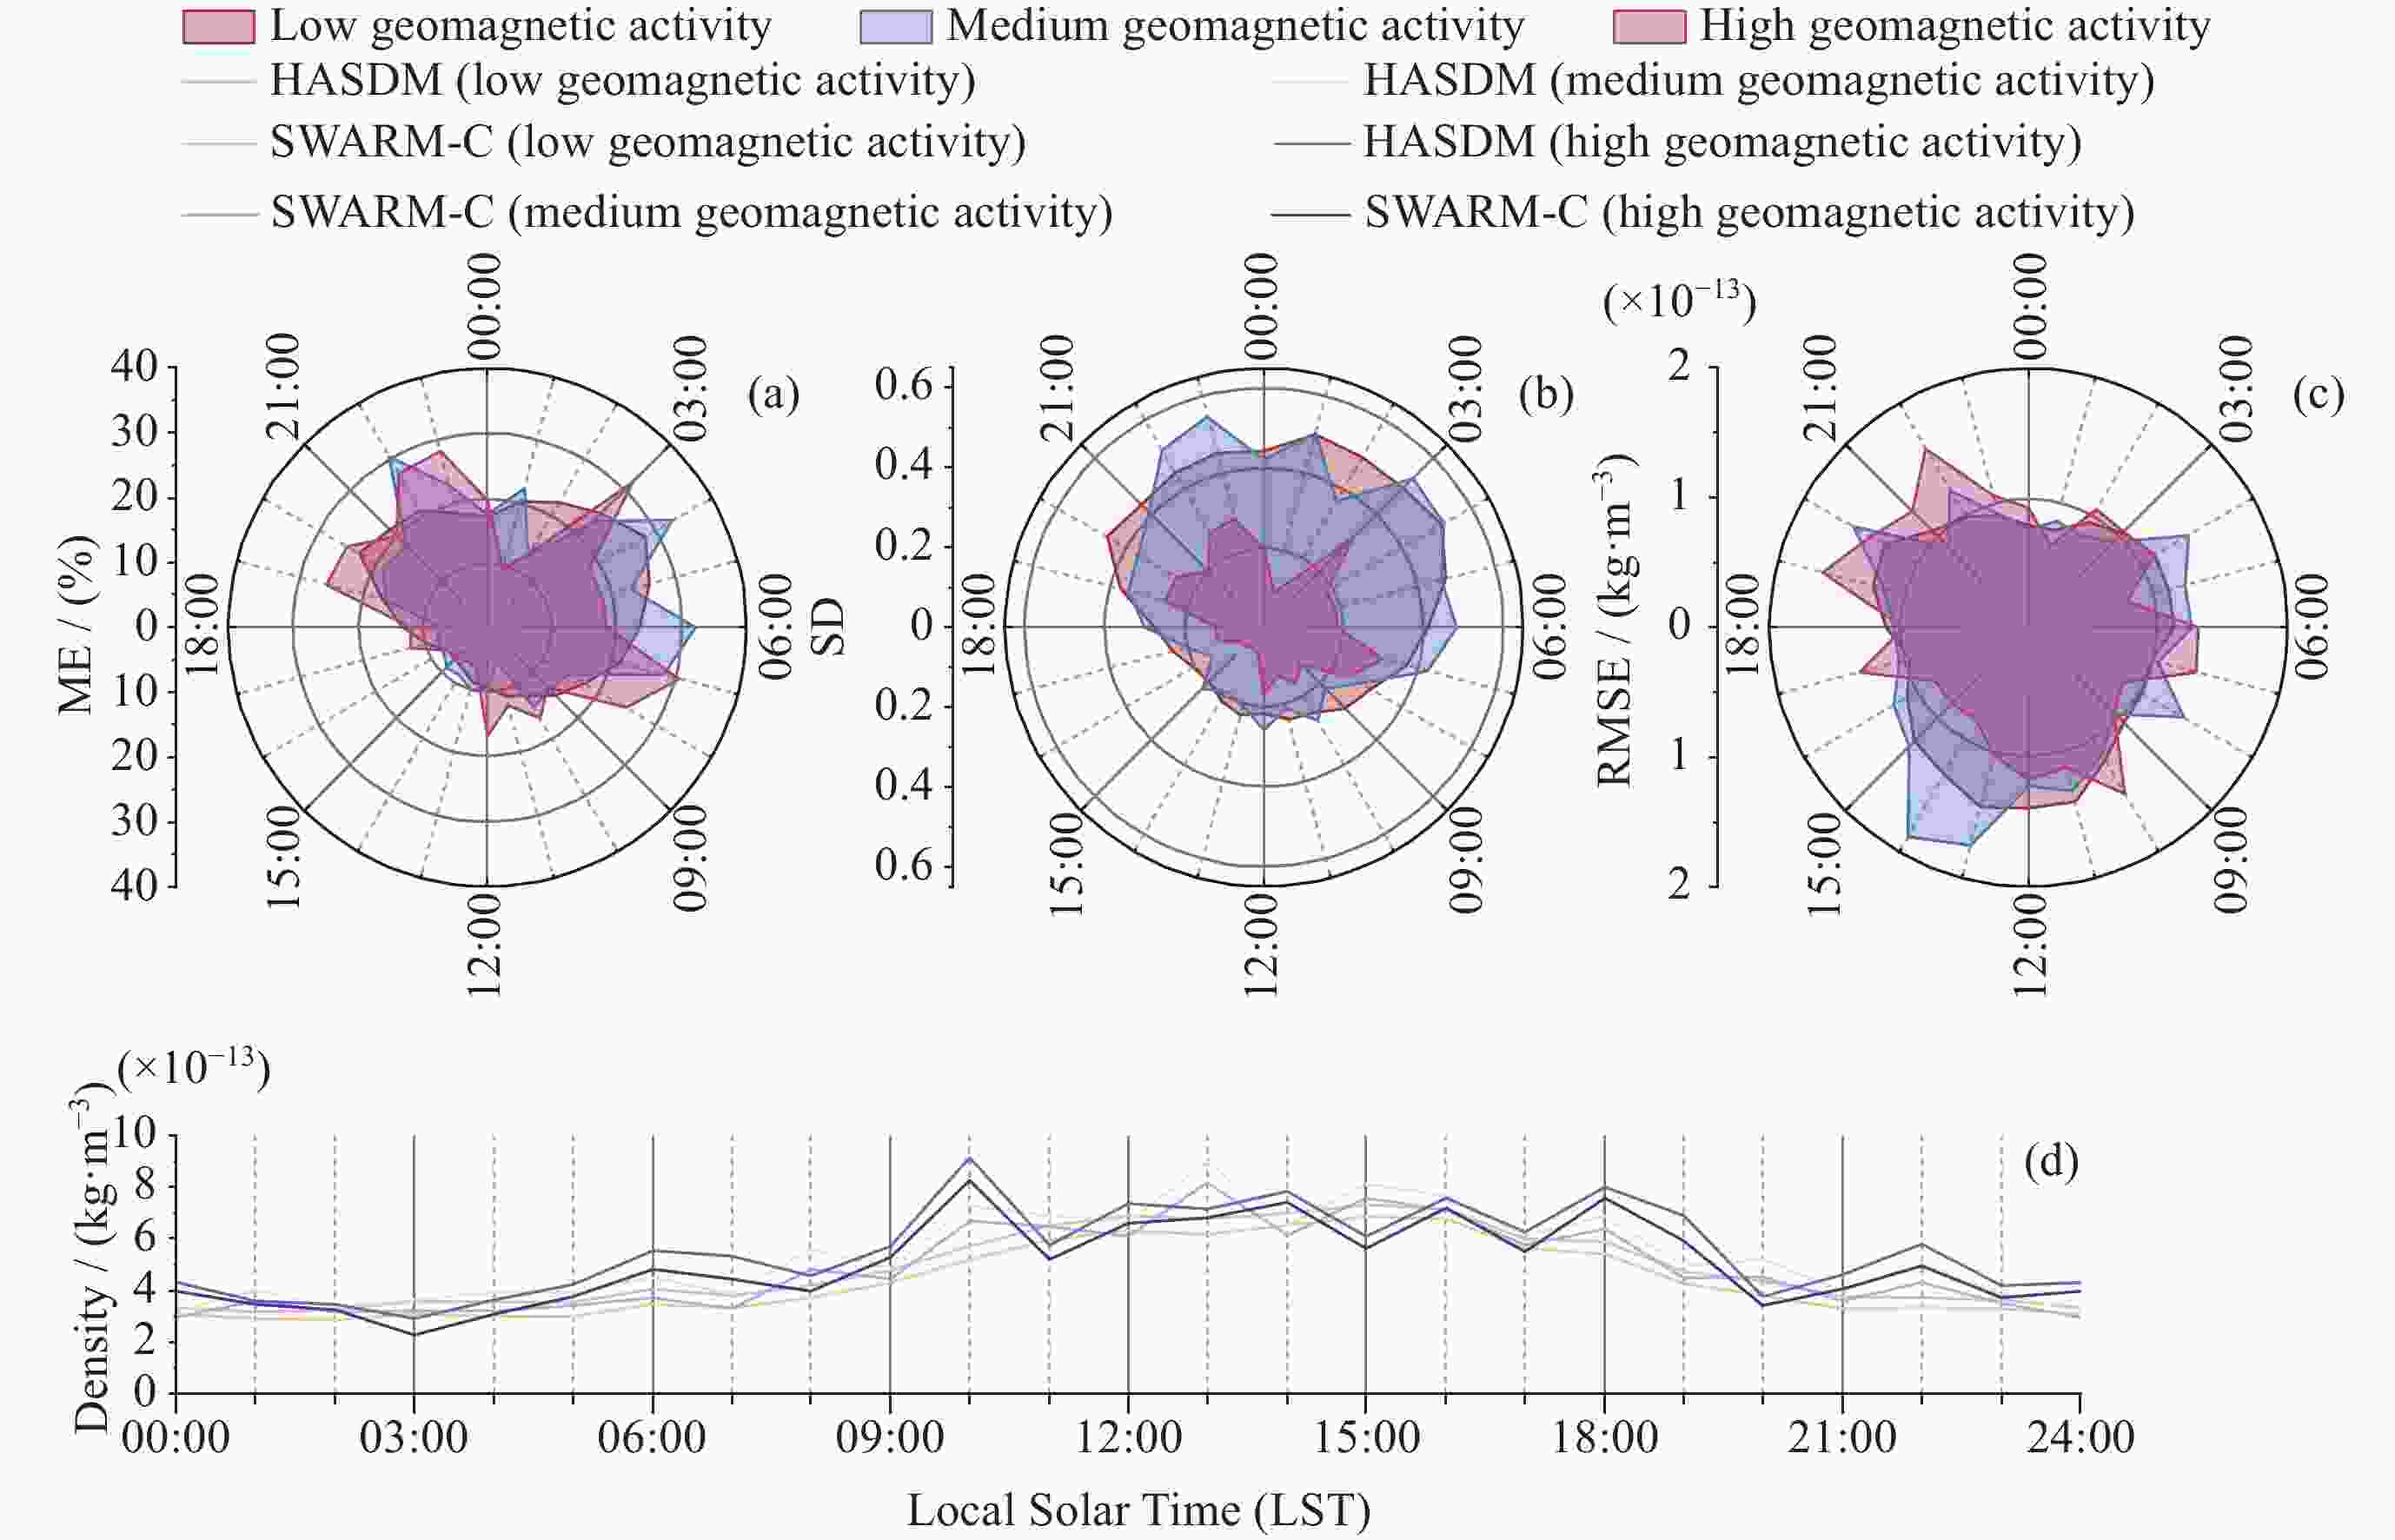
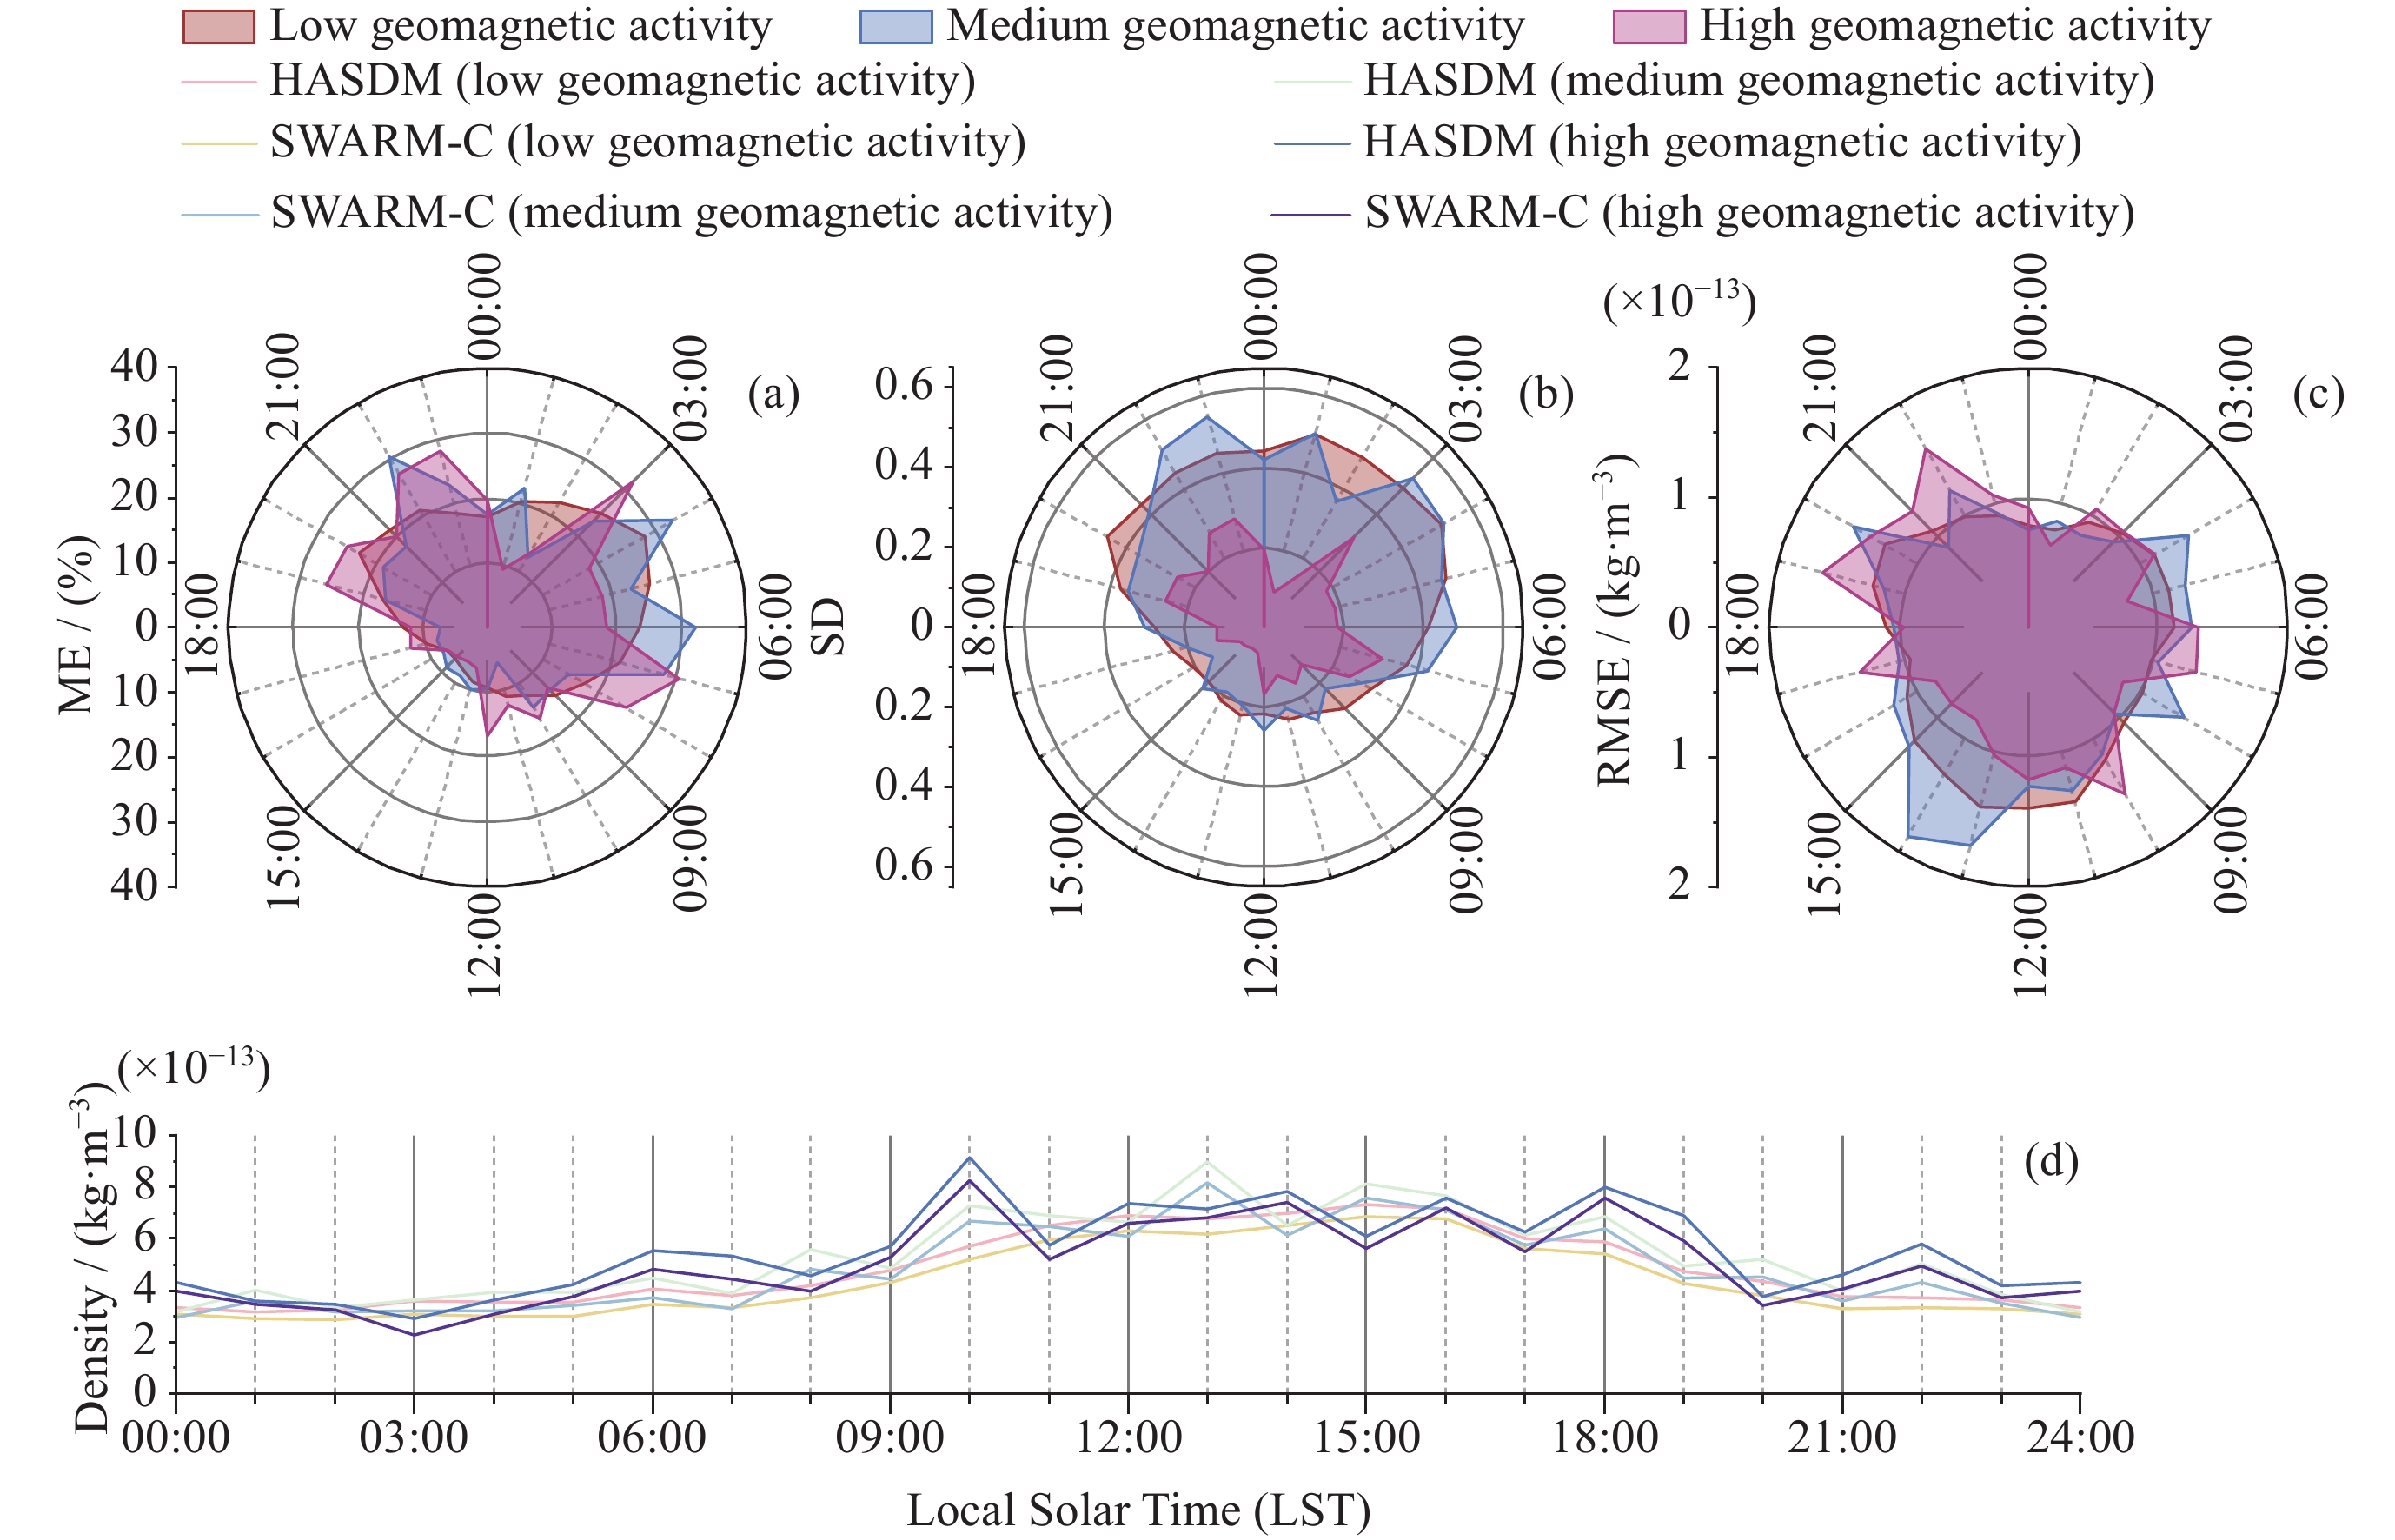
图 6 不同地磁活动条件下HASDM与SWARM-C在不同LST的大气密度与误差
Figure 6. Atmospheric density and error of HASDM and SWARM-C at different LST under different geomagnetic activity levels
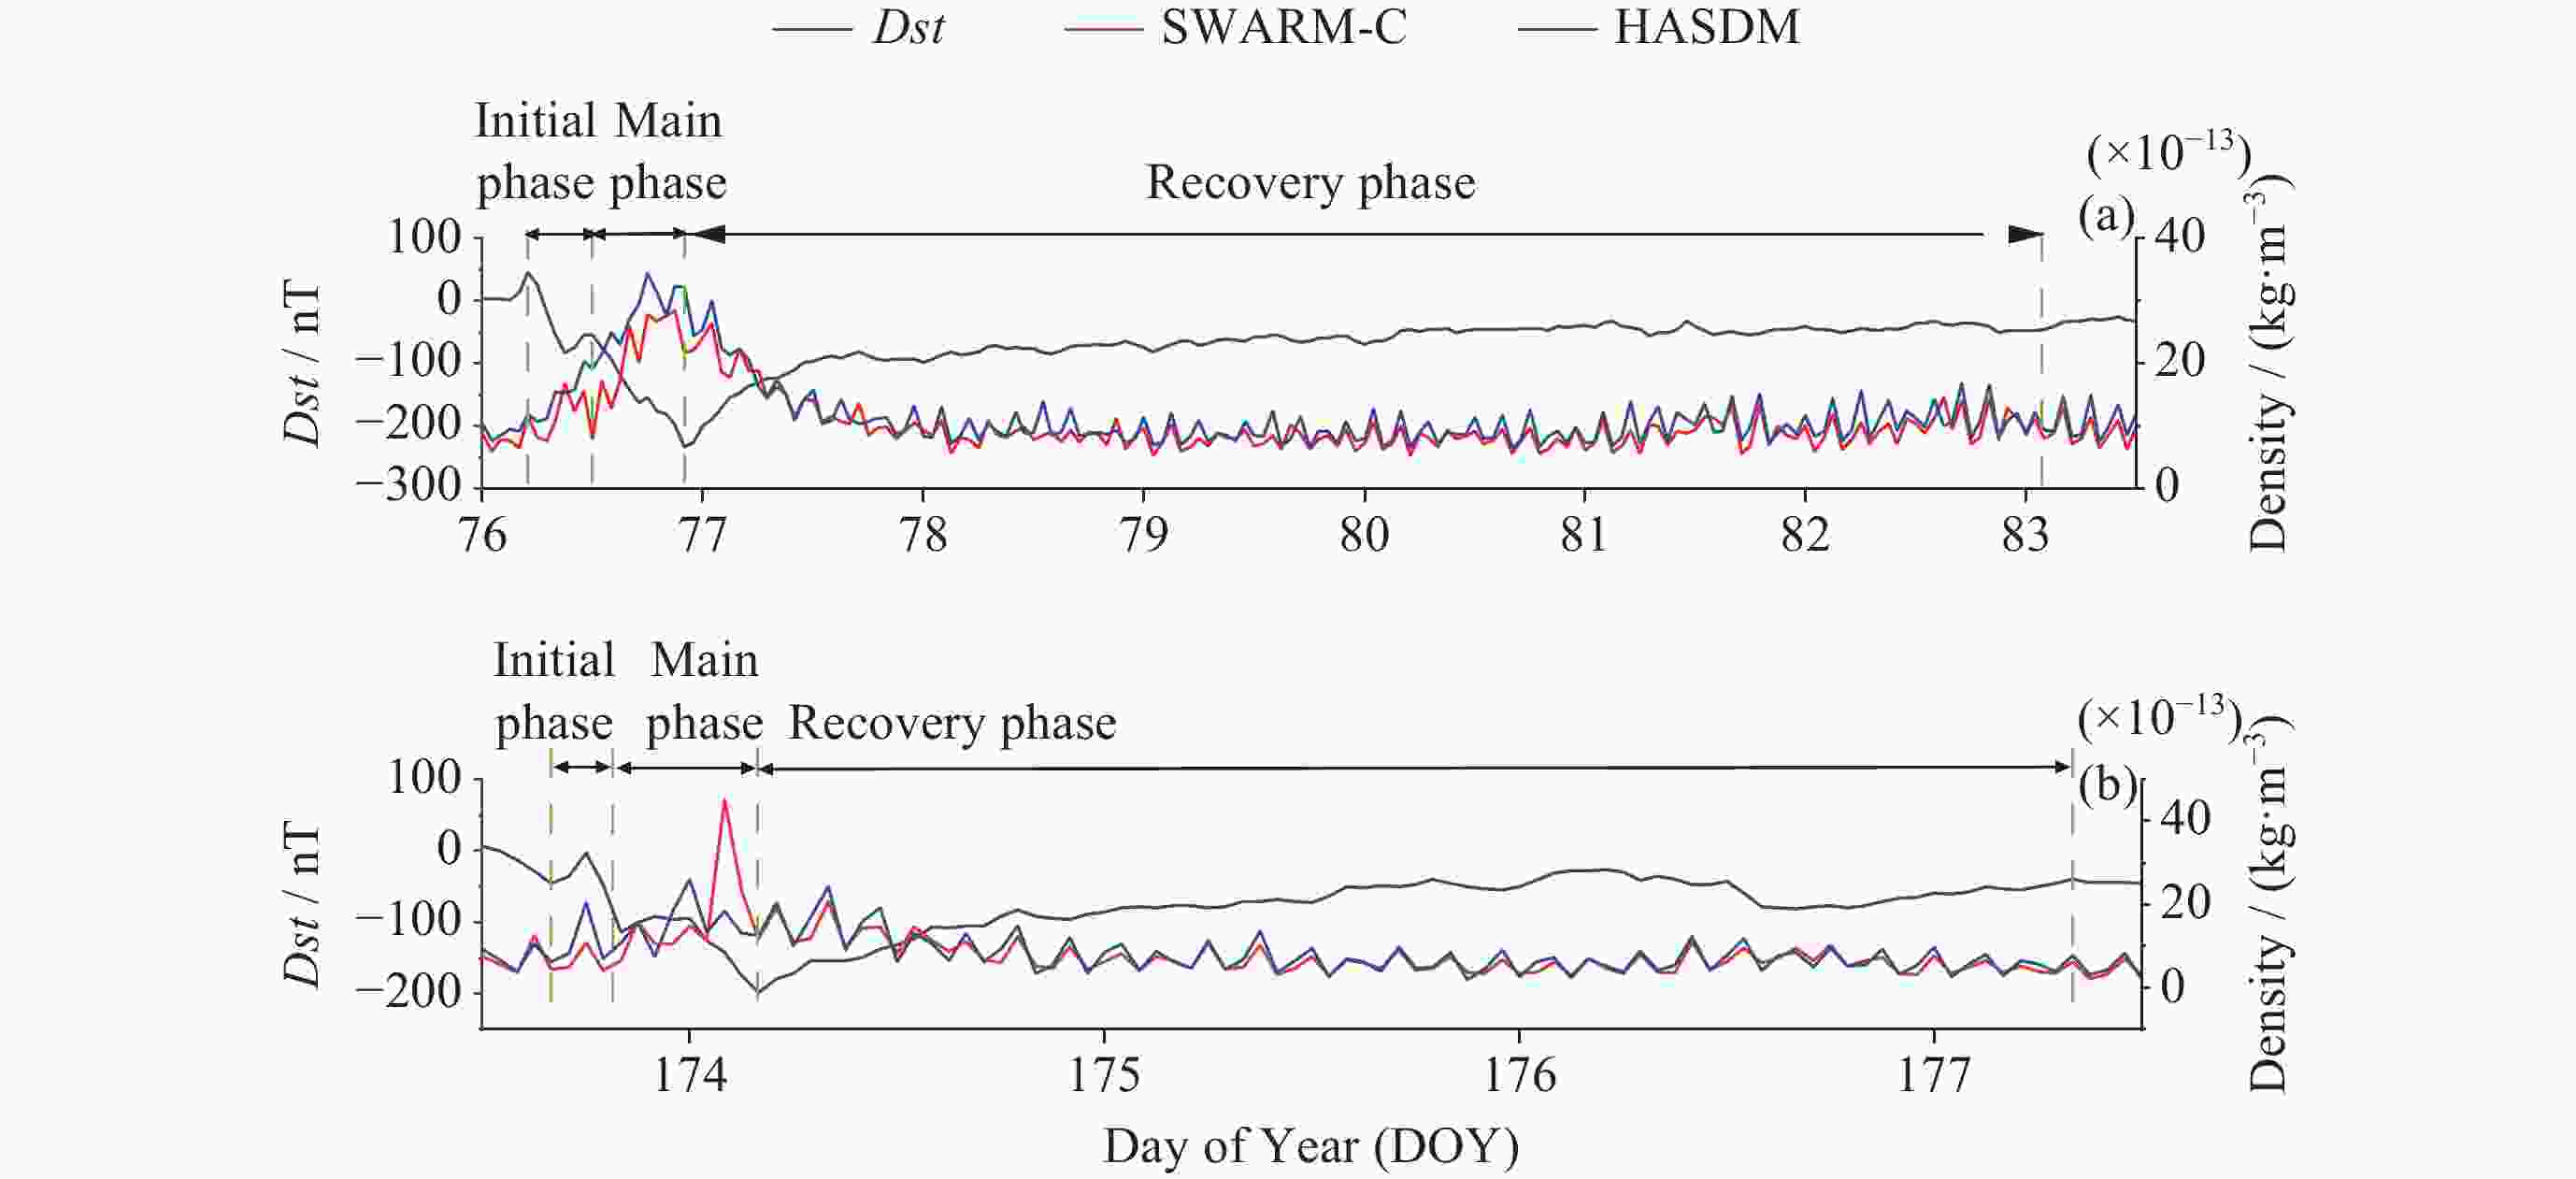
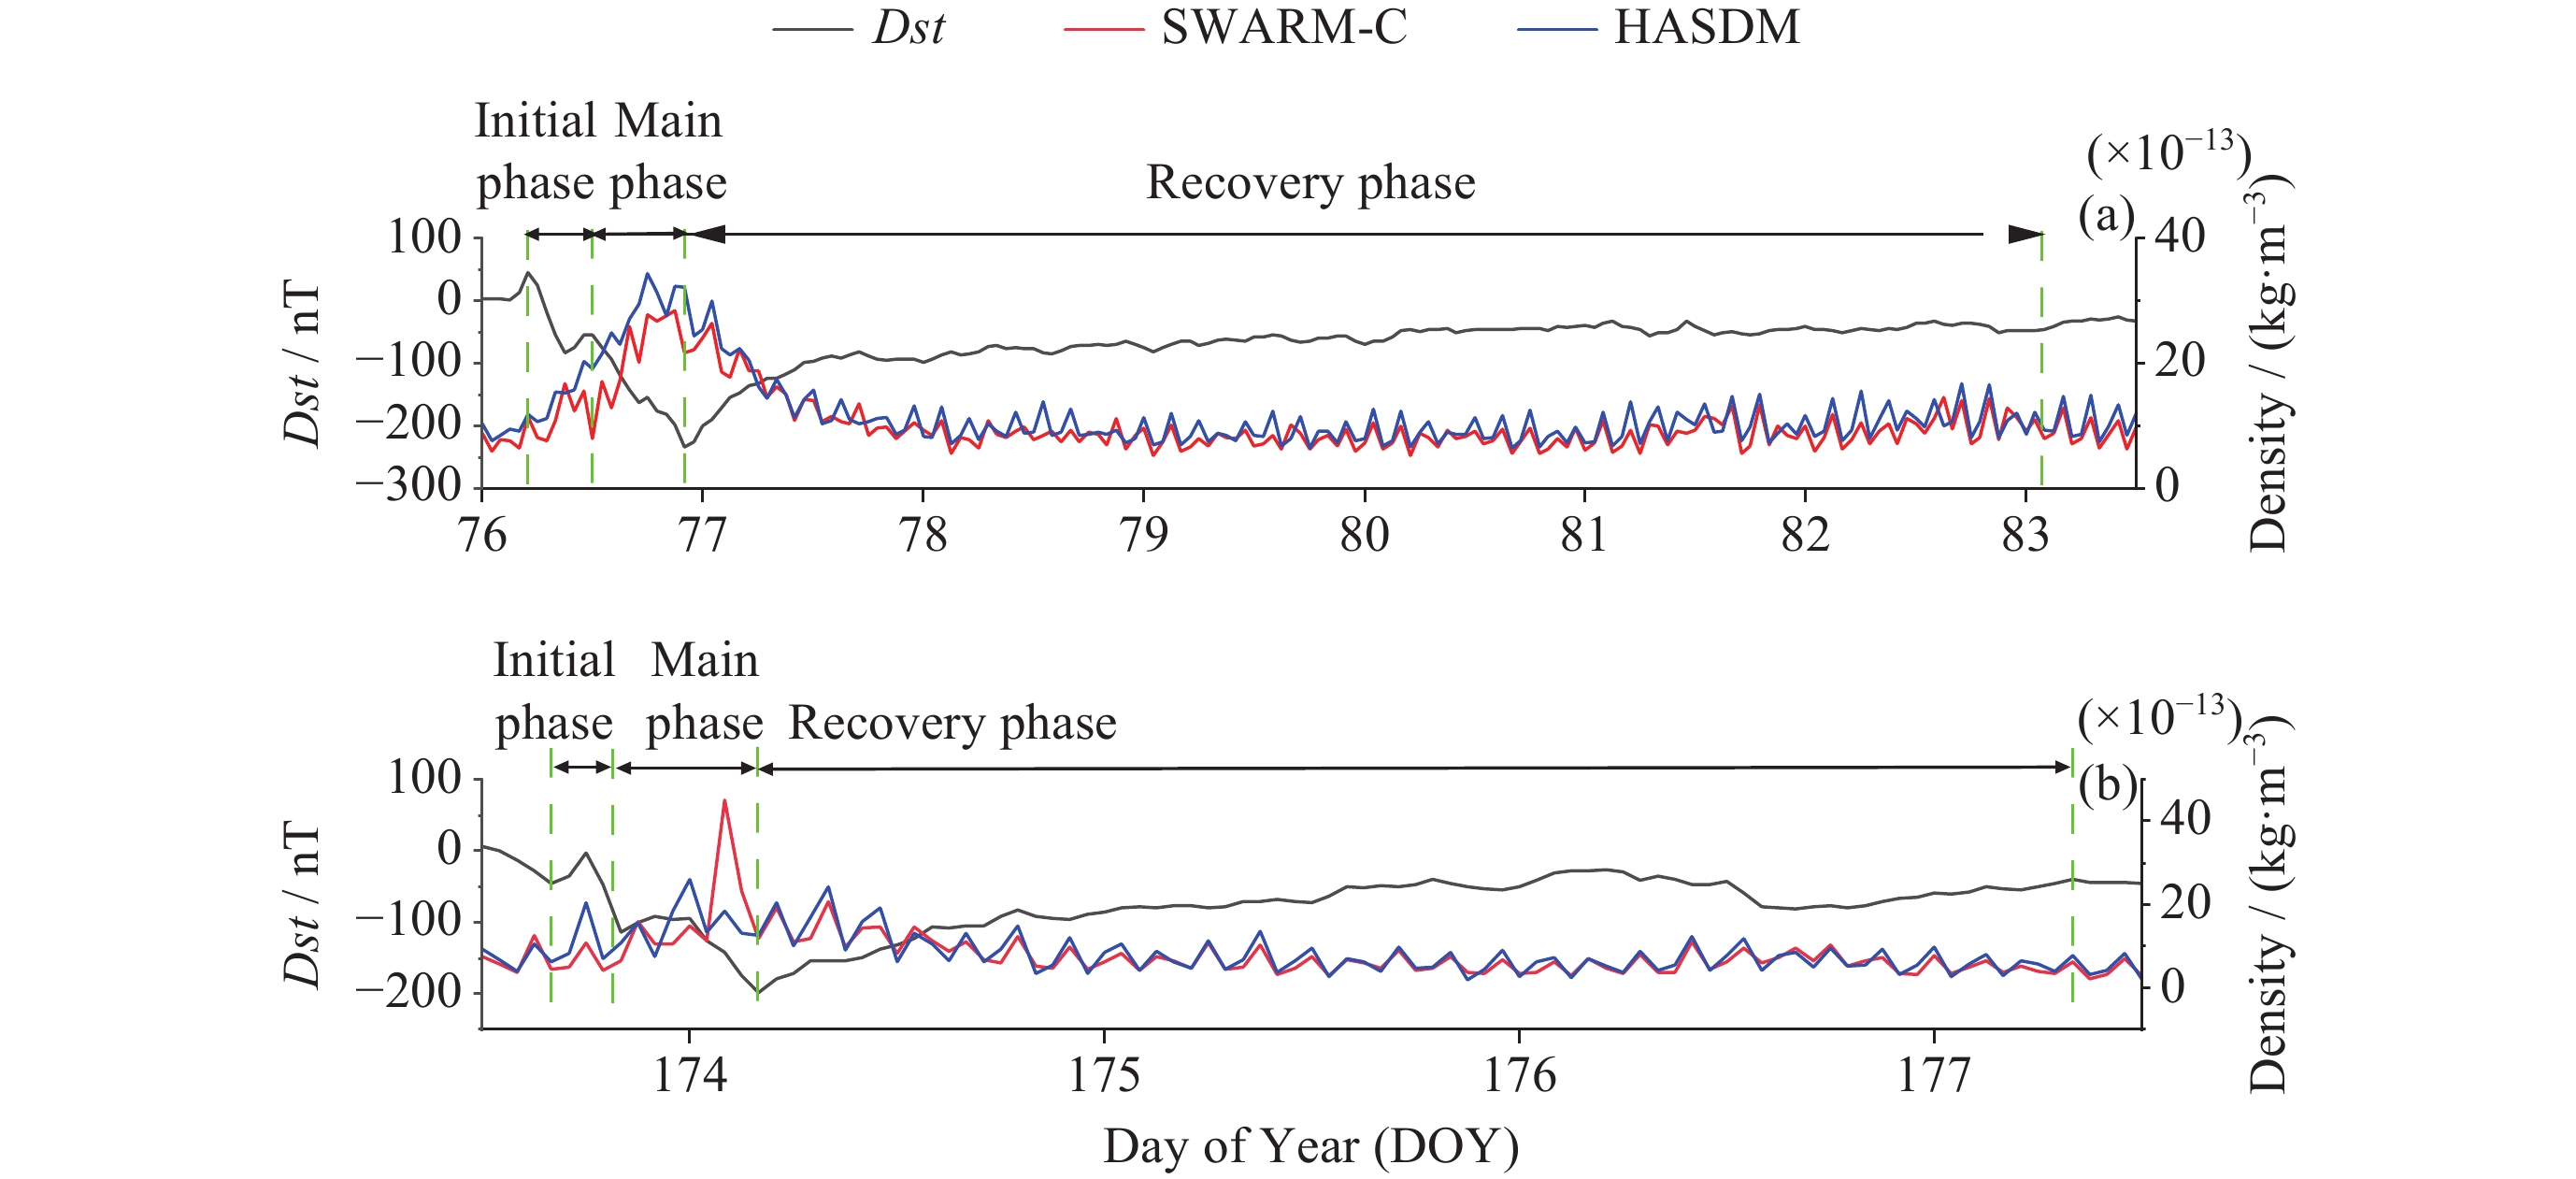
图 7 2015年观测到的两个典型磁暴事件Dst指数与大气密度随时间的变化
Figure 7. Variation of the Dst index and atmospheric density with DOY for the two typical geomagnetic storm events observed in 2015
表 1 不同太阳活动水平下HASDM与SWARM-C的ME, SD和RMSE
Table 1. ME, SD and RMSE of HASDM relative to SWARM-C under different solar activity levels
F10.7 太阳活
动水平$ \text{ME} $/
(%)$ \text{SD} $ $ \text{RMSE} $(×10–13)/
$ (\text{kg}\cdot {\mathrm{m}}^{-3}) $F10.7 $ \lt $ 100 低水平 18.72 0.434 0.711 100 $ \leq $ F10.7 $ \lt $ 150 中水平 12.19 0.197 1.593 150 $ \leq $ F10.7 高水平 12.83 0.177 1.951  下载: 导出CSV
表 2 不同地磁活动水平下HASDM与SWARM-C的ME, SD和RMSE
Table 2. ME, SD and RMSE of HASDM relative to SWARM-C under different geomagnetic activity levels
$ Ap $ 地磁活
动水平$ \text{ME} $/
(%)$ \text{SD} $ $ \text{RMSE} $ (×10–13)/
$ (\text{kg}\cdot {\mathrm{m}}^{-3}) $Ap $ \lt $ 20 低水平 16.64 0.375 1.114 20 $ \leq $ Ap $ \lt $ 50 中水平 16.83 0.377 1.956 50 $ \leq $ Ap 高水平 17.55 0.344 1.136
下载: 导出CSV
表 3 HASDM与SWARM-C在磁暴不同时期下 的ME, SD和RMSE
Table 3. ME, SD and RMSE of HASDM relative to SWARM-C during different phases of geomagnetic storm
2015年 (DOY) 磁暴时期 ME/(%) SD $ \text{RMSE} $(×10–13)/
$ (\text{kg}\cdot {\mathrm{m}}^{-3}) $76-83 初相 38.9 0.448 5.024 主相 30.7 0.270 6.901 恢复相 12.0 0.145 1.864 173-178 初相 53.7 0.310 4.699 主相 5.9 0.372 8.206 恢复相 9.7 0.312 1.424
下载: 导出CSV
-
[1] BOWMAN B, TOBISKA W K, MARCOS F, et al. A new empirical thermospheric density model JB2008 using new solar and geomagnetic indices[C]//AIAA/AAS Astrodynamics Specialist Conference and Exhibit. Honolulu: AIAA, 2008 [2] BRUINSMA S, BONIFACE C. The operational and research DTM-2020 thermosphere models[J]. Journal of Space Weather and Space Climate, 2021, 11: 47 doi: 10.1051/swsc/2021032 [3] PICONE J M, HEDIN A E, DROB D P, et al. NRLMSISE-00 empirical model of the atmosphere: statistical comparisons and scientific issues[J]. Journal of Geophysical Research: Space Physics, 2002, 107(A12): SIA 15-1-SIA 15-16 [4] DENG Y, FULLER-ROWELL T J, RIDLEY A J, et al. Theoretical study: influence of different energy sources on the cusp neutral density enhancement[J]. Journal of Geophysical Research: Space Physics, 2013, 118(5): 2340-2349 doi: 10.1002/jgra.50197 [5] FEDRIZZI M, FULLER-ROWELL T J, CODRESCU M V. Global joule heating index derived from thermospheric density physics-based modeling and observations[J]. Space Weather, 2012, 10(3): S03001 doi: 10.1029/2011sw000724 [6] BRUINSMA S L, FORBES J M. Anomalous behavior of the thermosphere during solar minimum observed by CHAMP and GRACE[J]. Journal of Geophysical Research: Space Physics, 2010, 115(A11): A11323 doi: 10.1029/2010ja015605 [7] SOLOMON S C, WOODS T N, DIDKOVSKY L V, et al. Anomalously low solar extreme-uLSTraviolet irradiance and thermospheric density during solar minimum[J]. Geophysical Research Letters, 2010, 37(16): L16103 doi: 10.1029/2010gl044468 [8] STORZ M F, BOWMAN B R, BRANSON M J I, et al. High Accuracy Satellite Drag Model (HASDM)[J]. Advances in Space Research, 2005, 36(12): 2497-2505 doi: 10.1016/j.asr.2004.02.020 [9] TOBISKA W K, BOWMAN B R, BOUWER S D, et al. The SET HASDM density database[J]. Space Weather, 2021, 19(4): e2020SW002682 doi: 10.1029/2020SW002682 [10] LICATA R J, MEHTA P M, TOBISKA W K, et al. Qualitative and quantitative assessment of the SET HASDM database[J]. Space Weather, 2021, 19(8): e2021SW002798 doi: 10.1029/2021SW002798 [11] BRUINSMA S L, DOORNBOS E, BOWMAN B R. Validation of GOCE densities and evaluation of thermosphere models[J]. Advances in Space Research, 2014, 54(4): 576-585 doi: 10.1016/j.asr.2014.04.008 [12] BRUINSMA S, SIEMES C, EMMERT J T, et al. Description and comparison of 21st century thermosphere data[J]. Advances in Space Research, 2023, 72(12): 5476-5489 doi: 10.1016/j.asr.2022.09.038 [13] 苗娟, 刘四清, 李志涛, 等. 热层大气密度变化特征与太阳辐射和地磁指数的相关性分析[J]. 载人航天, 2012, 18(5): 24-30 doi: 10.3969/j.issn.1674-5825.2012.05.008MIAO Juan, LIU Siqing, LI Zhitao, et al. Correlation of thermosphere density variation with different solar and geomagnetic indices[J]. Manned Spaceflight, 2012, 18(5): 24-30 doi: 10.3969/j.issn.1674-5825.2012.05.008 [14] 翁利斌, 方涵先, 季春华, 等. 基于卫星加速度数据反演的热层大气密度与NRLMSISE-00模式结果的比较研究[J]. 空间科学学报, 2012, 32(5): 713-719WENG Libin, FANG Hanxian, JI Chunhua, et al. Comparison between the CHAMP/STAR derived thermospheric density and the NRLMSISE-00 model[J]. Chinese Journal of Space Science, 2012, 32(5): 713-719 [15] 陈旭杏, 胡雄, 肖存英, 等. NRLMSISE-00大气模型与GRACE和CHAMP卫星大气密度数据的对比分析[J]. 空间科学学报, 2013, 33(5): 509-517 doi: 10.11728/cjss2013.05.509CHEN Xuxing, HU Xiong, XIAO Cunying, et al. Comparison of the thermospheric densities between GRACE/CHAMP satellites data and NRLMSISE-00 model[J]. Chinese Journal of Space Science, 2013, 33(5): 509-517 doi: 10.11728/cjss2013.05.509 [16] 刘卫, 王荣兰, 刘四清, 等. 典型热层密度模式误差分析[J]. 空间科学学报, 2017, 37(5): 538-546LIU Wei, WANG Ronglan, LIU Siqing, et al. Error analysis of typical atmospheric density model[J]. Chinese Journal of Space Science, 2017, 37(5): 538-546 [17] NAZARENKO A I, CEFOLA P J, YURASOV V. Estimating atmosphere density variations to improve LEO orbit prediction accuracy[J]. Advances in the Astronautical Sciences, 1998, 99(2): 1235-1256 [18] MARCOS F A, RENDRA M J, GRIFFIN J M, et al. Precision low earth orbit determination using atmospheric density calibration[J]. The Journal of the Astronautical Sciences, 1998, 46(4): 395-409 doi: 10.1007/BF03546389 [19] TOBISKA W K, WOODS T, EPARVIER F, et al. The SOLAR2000 empirical solar irradiance model and forecast tool[J]. Journal of Atmospheric and Solar-Terrestrial Physics, 2000, 62(14): 1233-1250 doi: 10.1016/S1364-6826(00)00070-5 [20] TOBISKA W K, KNIPP D, BURKE W J, et al. The anemomilos prediction methodology for Dst[J]. Space Weather, 2013, 11(9): 490-508 doi: 10.1002/swe.20094 [21] OLSEN N, FRIIS-CHRISTENSEN E, FLOBERGHAGEN R, et al. The swarm Satellite Constellation Application and Research Facility (SCARF) and swarm data products[J]. Earth, Planets and Space, 2013, 65(11): 1189-1200 doi: 10.5047/eps.2013.07.001 [22] YIN L R, WANG L, TIAN J W, et al. Atmospheric density inversion based on Swarm-C satellite accelerometer[J]. Applied Sciences, 2023, 13(6): 3610-3622 doi: 10.3390/app13063610 [23] IORFIDA E, DARAS I, HAAGMANS R, et al. Swarm A and C accelerometers: data validation and scientific interpretation[J]. Earth and Space Science, 2023, 10(2): e2022EA002458 doi: 10.1029/2022EA002458 [24] YIN L R, WANG L, ZHENG W F, et al. Evaluation of empirical atmospheric models using Swarm-C satellite data[J]. Atmosphere, 2022, 13(2): 294-308 doi: 10.3390/atmos13020294 [25] SIEMES C, BORRIES C, BRUINSMA S, et al. New thermosphere neutral mass density and crosswind datasets from CHAMP, GRACE, and GRACE-FO[J]. Journal of Space Weather and Space Climate, 2023, 13: 16 doi: 10.1051/swsc/2023014 [26] WANG Hongbo. The application of satellite borne accelerometer data to the study of upper atmosphere[J]. Acta Astronomica Sinica, 2010, 51(4): 435-436 [27] TOBISKA W K, BOUWER S D, BOWMAN B R. The development of new solar indices for use in thermospheric density modeling[J]. Journal of Atmospheric and Solar-Terrestrial Physics, 2008, 70(5): 803-819 doi: 10.1016/j.jastp.2007.11.001 [28] HUTCHINSON J A, WRIGHT D M, MILAN S E. Geomagnetic storms over the last solar cycle: a superposed epoch analysis[J]. Journal of Geophysical Research: Space Physics, 2011, 116(A9): A09211 doi: 10.1029/2011ja016463 [29] YOKOYAMA N, KAMIDE Y. Statistical nature of geomagnetic storms[J]. Journal of Geophysical Research: Space Physics, 1997, 102(A7): 14215-14222 doi: 10.1029/97JA00903 -
-

 下载:
下载:

计量
- 文章访问数: 893
- HTML全文浏览量: 354
- PDF下载量: 98
-
被引次数:
0(来源:Crossref)
0(来源:其他)

