


2024年5月空间天气事件的太阳行星际传播分析
doi: 10.11728/cjss2026.01.2025-0024 cstr: 32142.14.cjss.2025-0024
-
 刘晓迪 女, 2000年10月出生于河南省濮阳市, 现为中国科学院国家空间科学中心2022级硕士研究生, 主要研究方向为空间天气领域的可视分析应用. E-mail: 2512548127@qq.com
 -
 钟鼎坤 男, 1979年8月出生于广东省韶关市, 现为中国科学院国家空间科学中心副研究员, 硕士生导师, 主要研究方向为空间天气科学数据管理和可视分析. E-mail: dkzhong@spaceweather.ac.cn
-
 向长青 男, 1968年8月出生于湖北省宜昌市, 现为中国科学院国家空间科学中心副研究员, 主要研究方向为空间物理、空间天气数值建模. E-mail: cqxiang@swl.ac.cn
作者简介:
通讯作者:
Analysis of Solar Interplanetary Propagation of Space Weather Events in May 2024
-
摘要: 综合运用多种观测手段, 对2024年5月8日至11日源于AR 13664太阳活动区7个前向全晕日冕物质抛射(CME)事件的日地空间传播过程进行了分析. 这7个CME可分为两组, 第一组为发生于5月8日05:36 UT至5月9日09:24 UT的4个CME, 第二组为发生于5月9日18:52 UT至11日01:36 UT的3个CME. 利用日地关系观测台A星的日球层成像仪(STEREO A/HI)观测追踪这两组CME对应的高密度区域的时间–距角关系, 并采用固定Φ角拟合法及调和均值法推算这两组CME的最优传播方向及平均径向速度. 结果显示, 这两组CME的高密度区域在STEREO A/HI分别发生了混叠, 采用拟合得到的径向速度推算这两组CME到达地球轨道附近的时间与实际被WIND飞船就位观测到的开始时间的最小差值分别约为0.5 h和3 h. 结果表明,这两组CME在日地传播过程中, 后面快速的CME追上了前面稍慢的CME, 从而形成两个复杂喷出物, 产生了异常强烈的地磁暴.Abstract: A variety of observations are employed to conduct a preliminary analysis of the propagation in solar-interplanetary space of seven earth-directed full-halo Coronal Mass Ejections (CME) originating from the solar Active Region (AR) 13664 from 8 to 11 May 2024. These seven CME can be divided into two groups. The first group consists of four CME that occurred during the period from 05:36 UT on 8 May to 09:24 UT on 9 May, and the second group consists of three CME that occurred during the period from 18:52 UT on 9 May to 01:36 UT on 11 May. We utilize the heliospheric imager on the Solar Terrestrial Relations Observatory A (STEREO A/HI) to observe and track the time-elongation relationships of the high density regions corresponding to these two groups of CME, and apply the fixed Φ-angle fitting method and the harmonic mean fitting method to calculate the most probable propagation directions and average radial velocities of these two groups of CME. The results show that the high-density regions associated with these two groups of CME are respectively overlapped in the field of view of STEREO A/HI. The minimum differences between the two group CME’ arrival times near the Earth’s orbit calculated from the fitting radial velocities and the actual start times observed in situ by the WIND spacecraft are 0.5 hours and 3 hours respectively. These results indicate that during the solar-terrestrial propagation of these two groups of CME, the fast CME behind catch up with the slower CME ahead, thus, the two groups of CME form two complex ejecta and generate the extremely intense geomagnetic storm.
-
Key words:
- Coronal Mass Ejection (CME) /
- Radio bursts /
- J-map /
- Fixed Φ-angle fitting method /
- Harmonic mean method
-

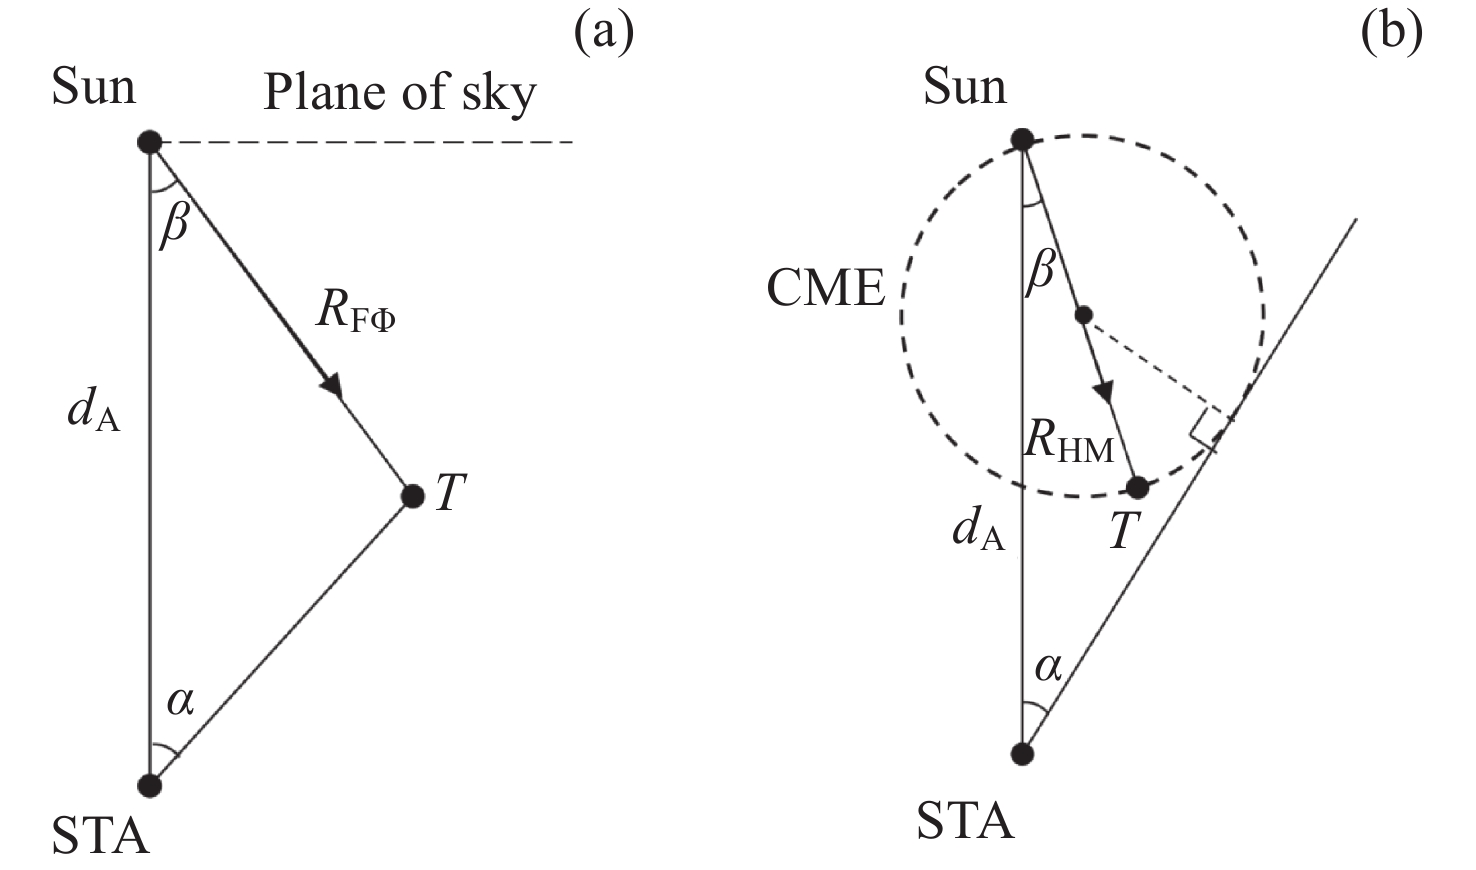
图 1 FΦ 方法 (a) 和 HM 方法 (b) 几何原理. Sun 和 STA 分别表示太阳和 STEREO A 飞船的位置, dA表示 STA 飞船日心距, Sun 到 T 表示 CME 主传播方向, α和β分别表示 STA 对 CME 前沿的观测距角和主传播方向的夹角(β逆时针为正), RFΦ和RHM表示两种方法中 T 的日心距
Figure 1. Geometric principles of the FΦ fitting method (a) and HM fitting method (b). Sun and STA denote the positions of the Sun and the STEREO A spacecraft respectively, dA represents the heliocentric distance of the STA. The direction from the Sun to T represents the propagation direction of the CME. α is the elongation of the CME front by STA, β is the angle between the STA and the CME propagation direction, whose counterclockwise rotation is regarded as positive RFΦ and RHM represent the heliocentric distances of T in the two methods
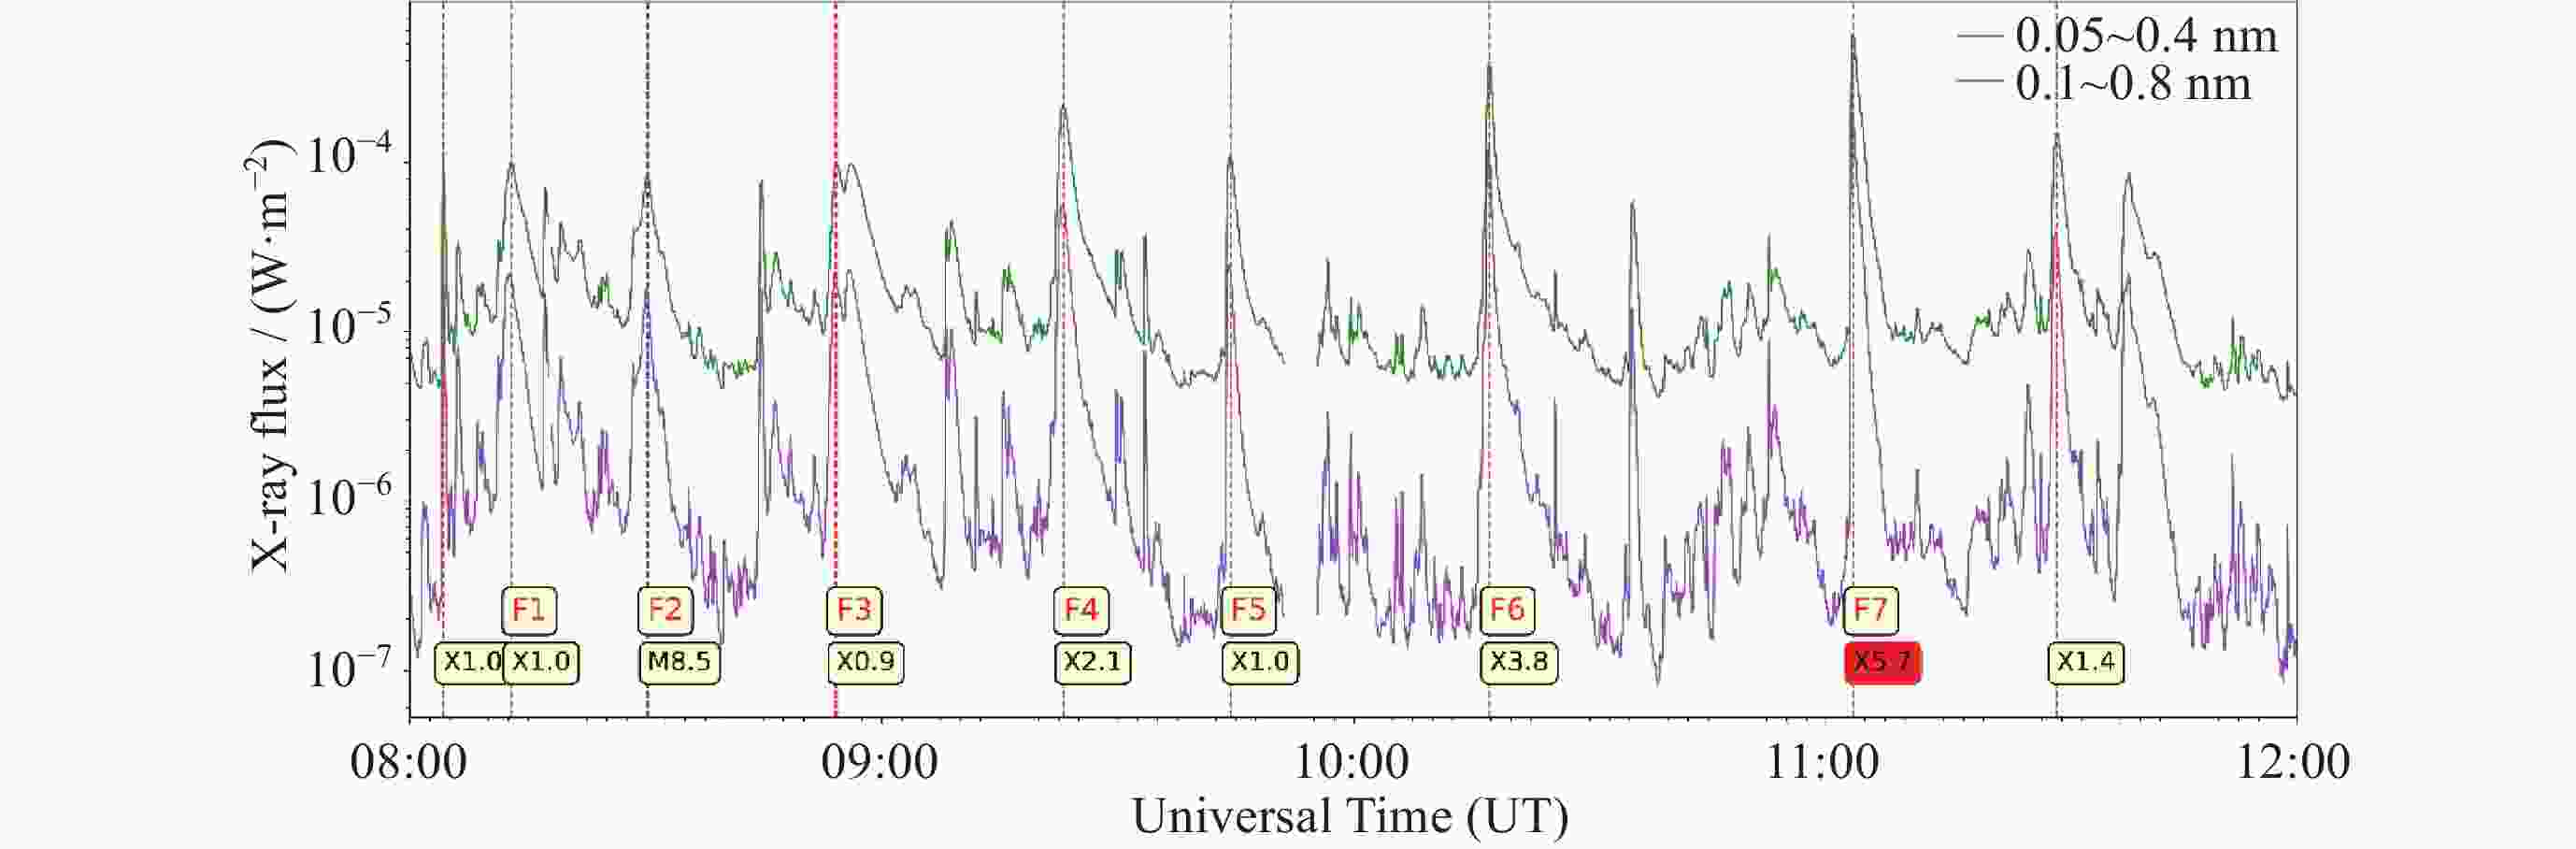
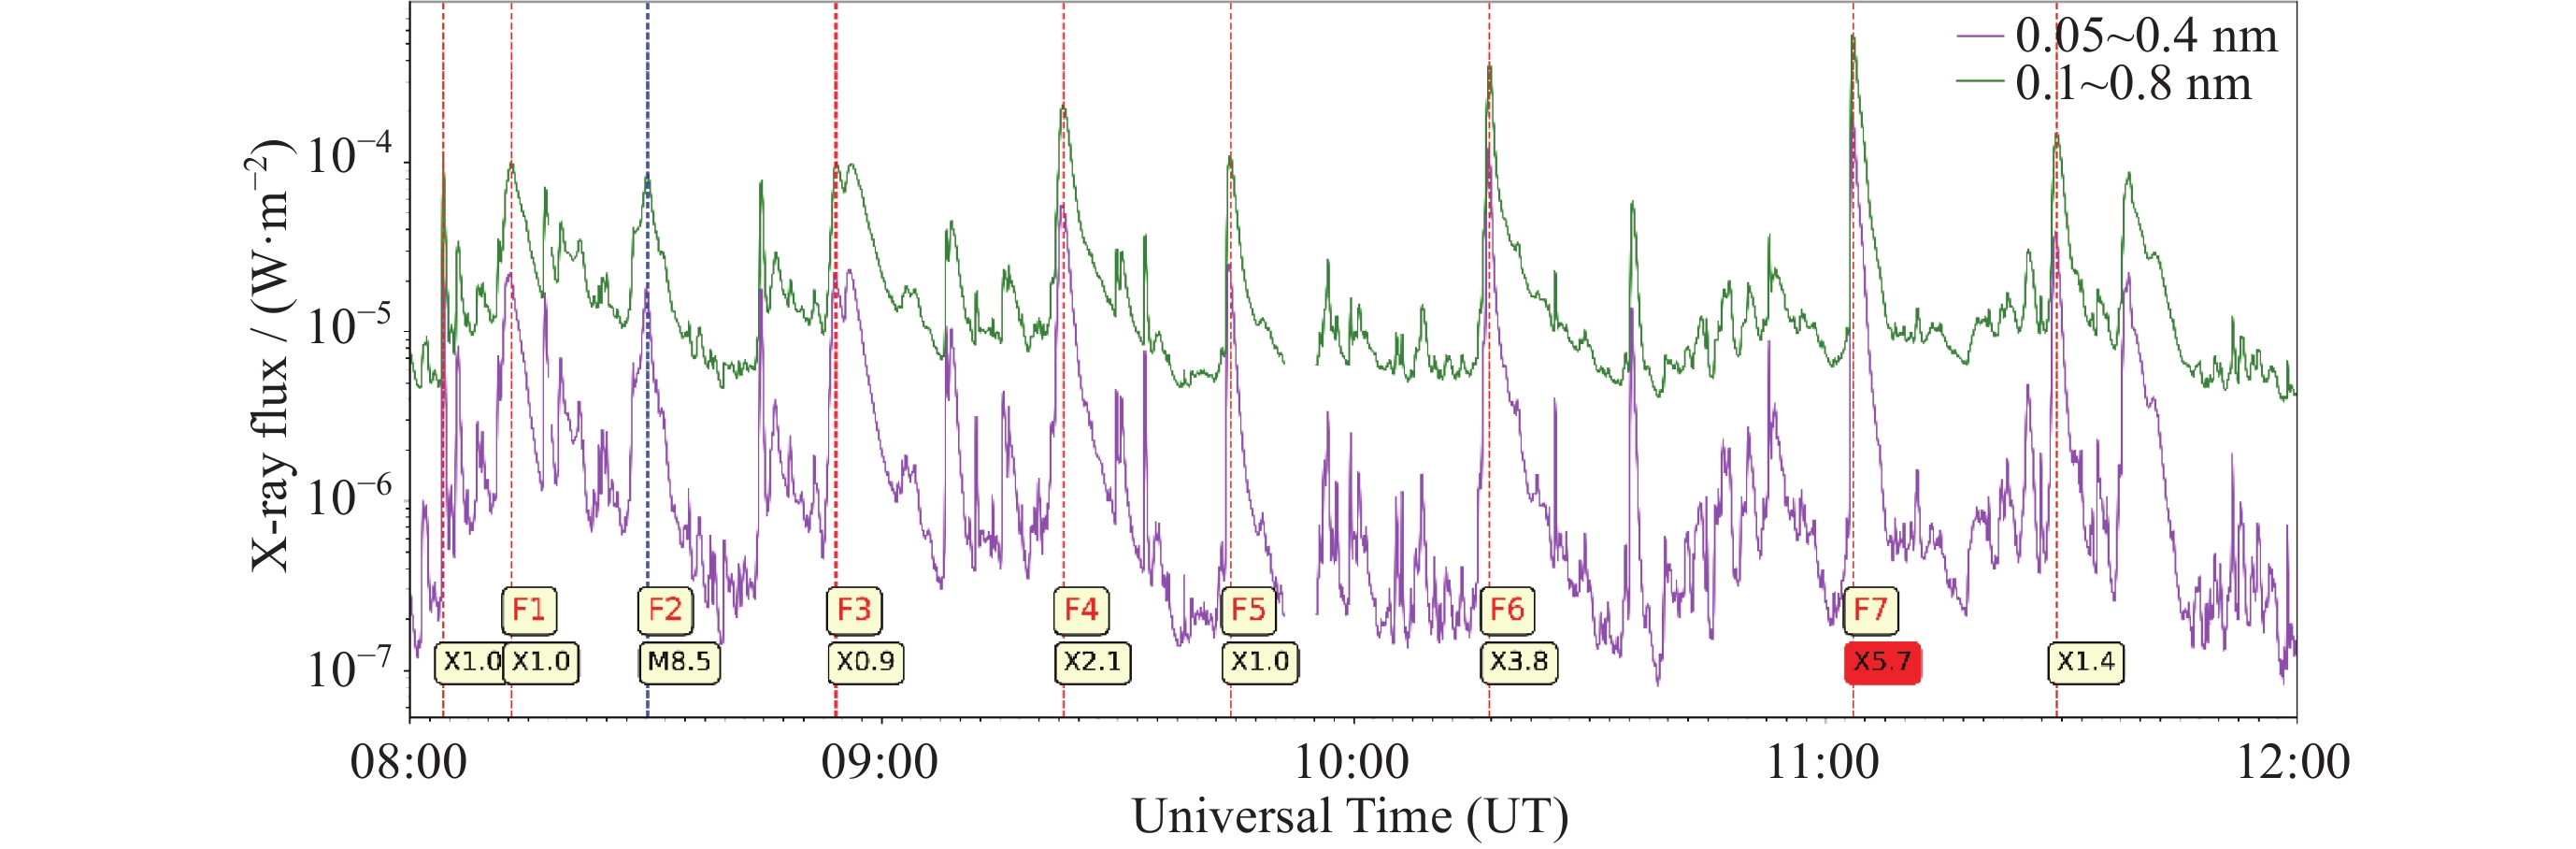
图 2 2024 年 5 月 8-11 日 X 射线流量变化 (红色虚线为 X 级耀斑事件, 蓝色虚线表示 M 级耀斑)
Figure 2. Variation of X-ray flux from 8 to 11 May 2024 (The red line indicates the X-class flare event, and the blue line indicates the M-class flare)
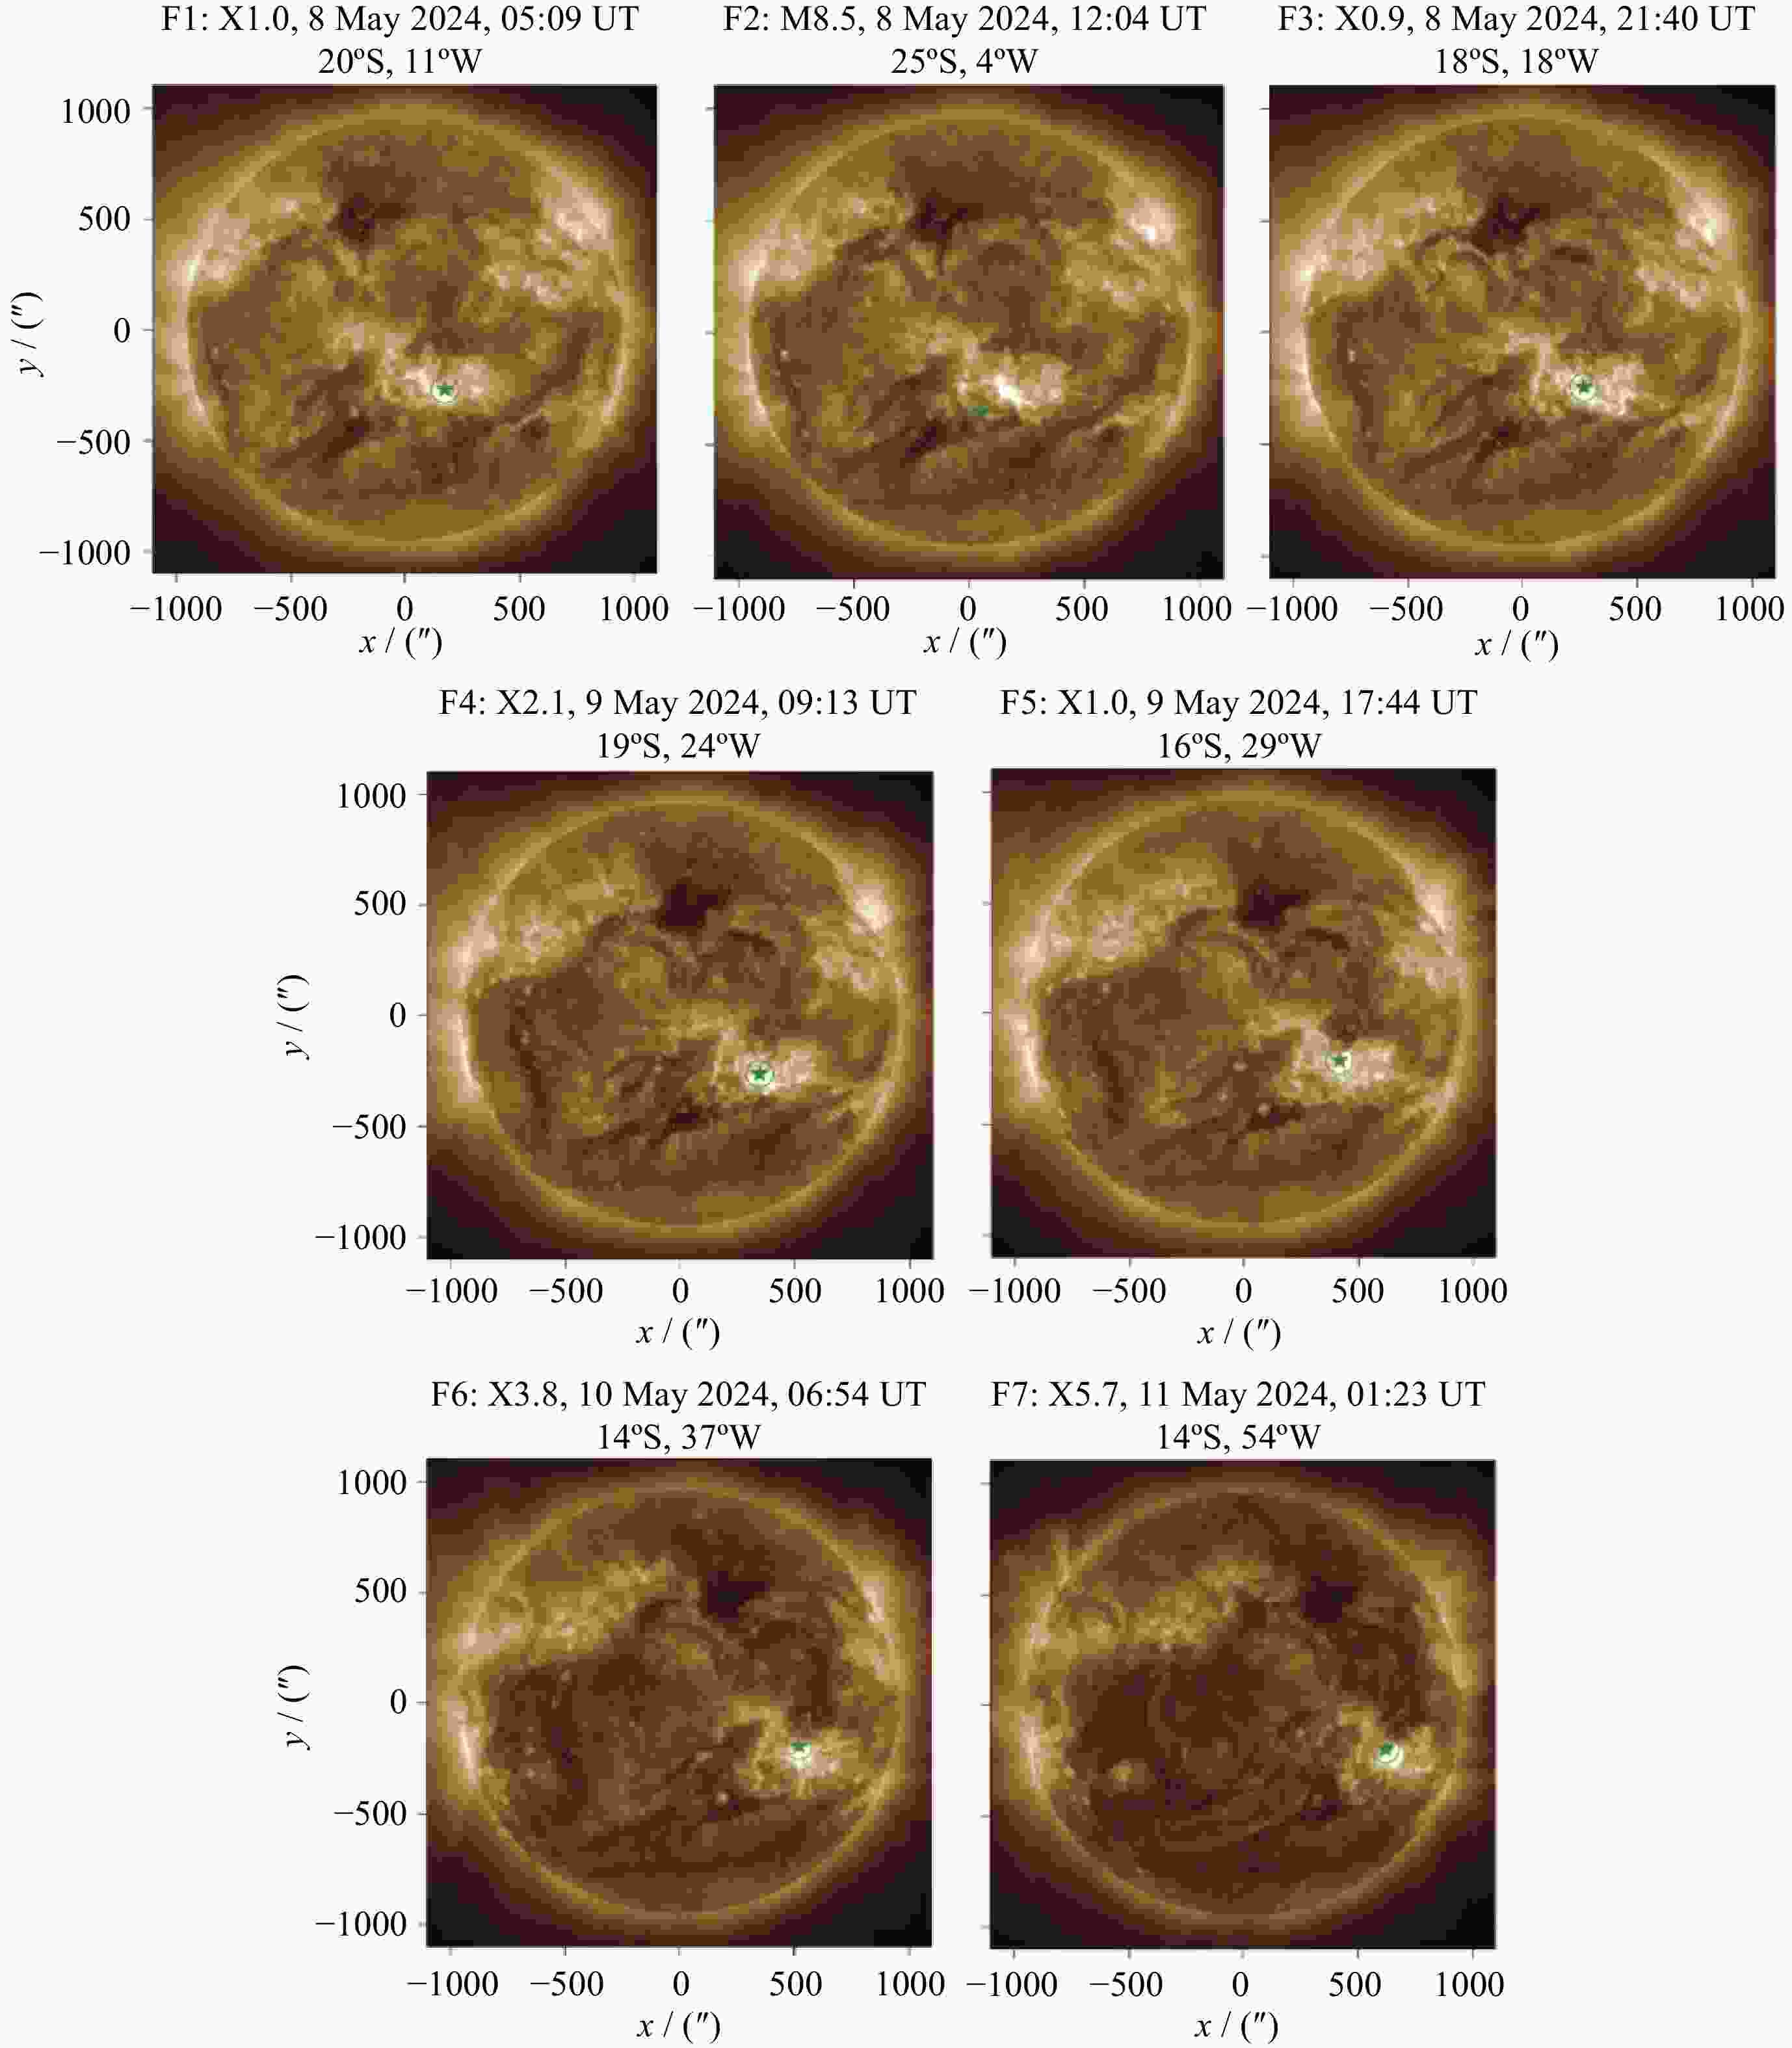
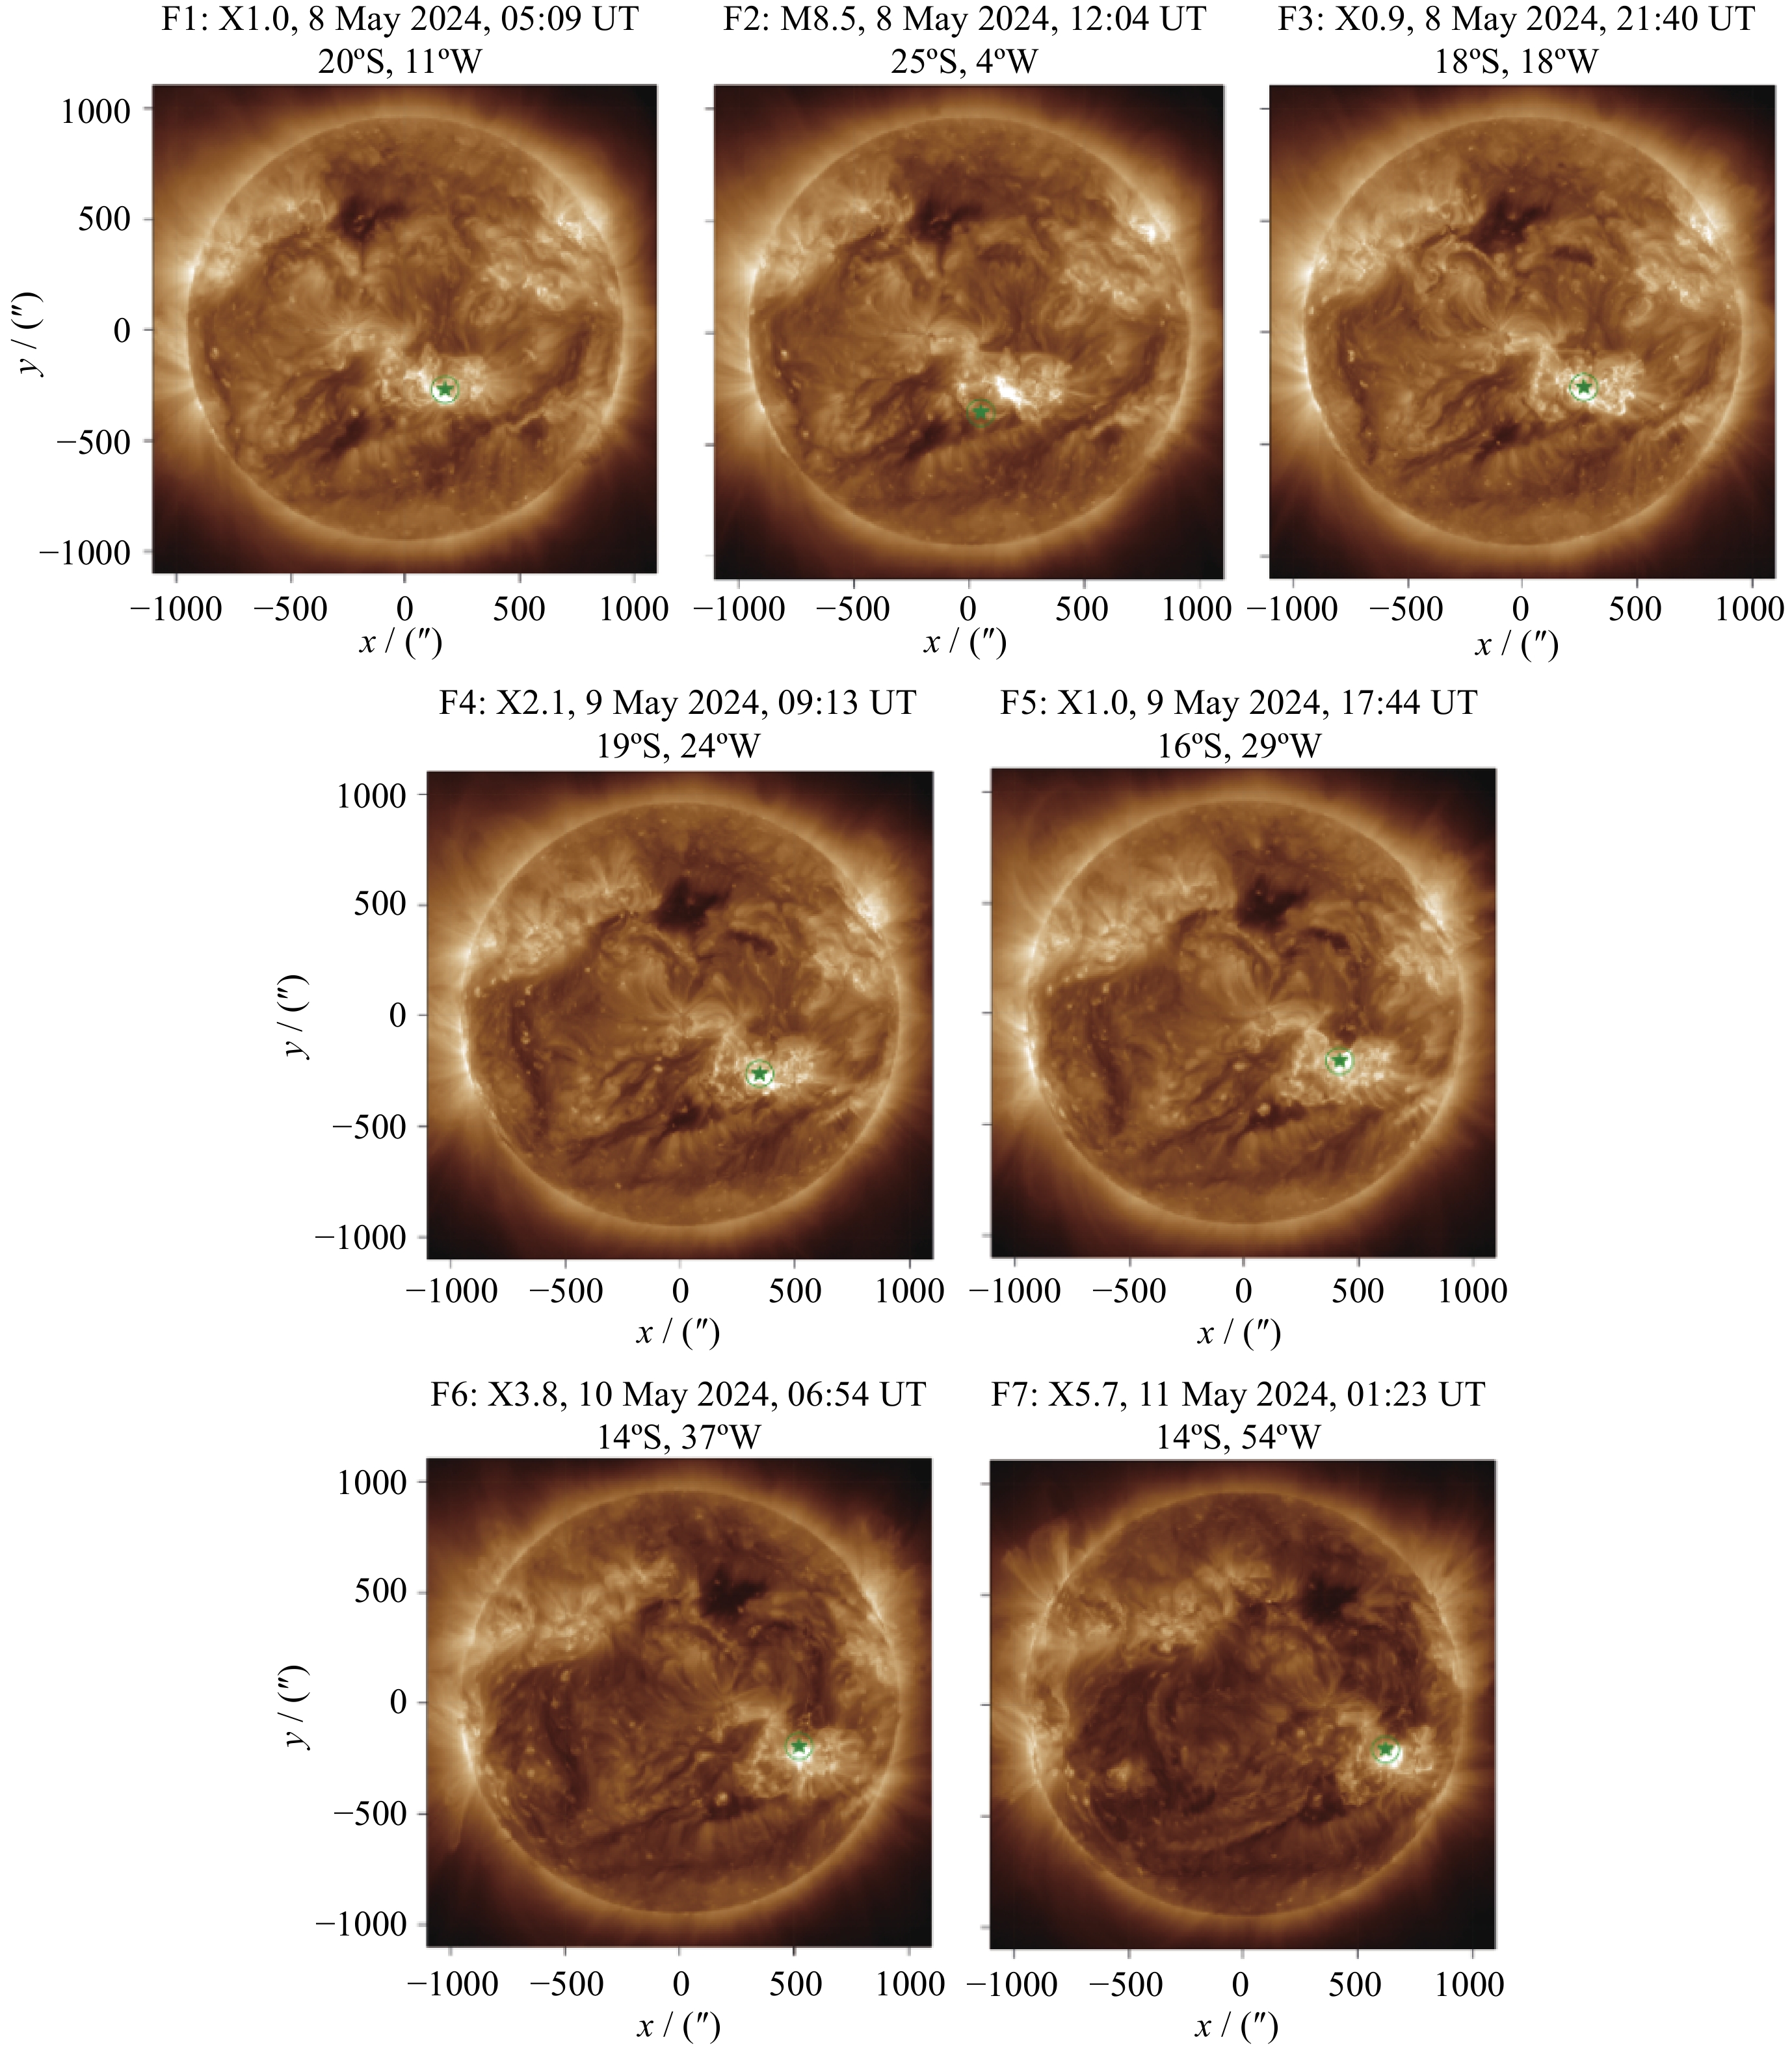
图 3 GOES 18/SUVI 195Å 波段观测的太阳紫外图像 (绿色星号表示每个耀斑的位置)
Figure 3. Solar ultraviolet image observed by GOES 18/SUVI at 195 Å (Green asterisks indicate the position of each flare)
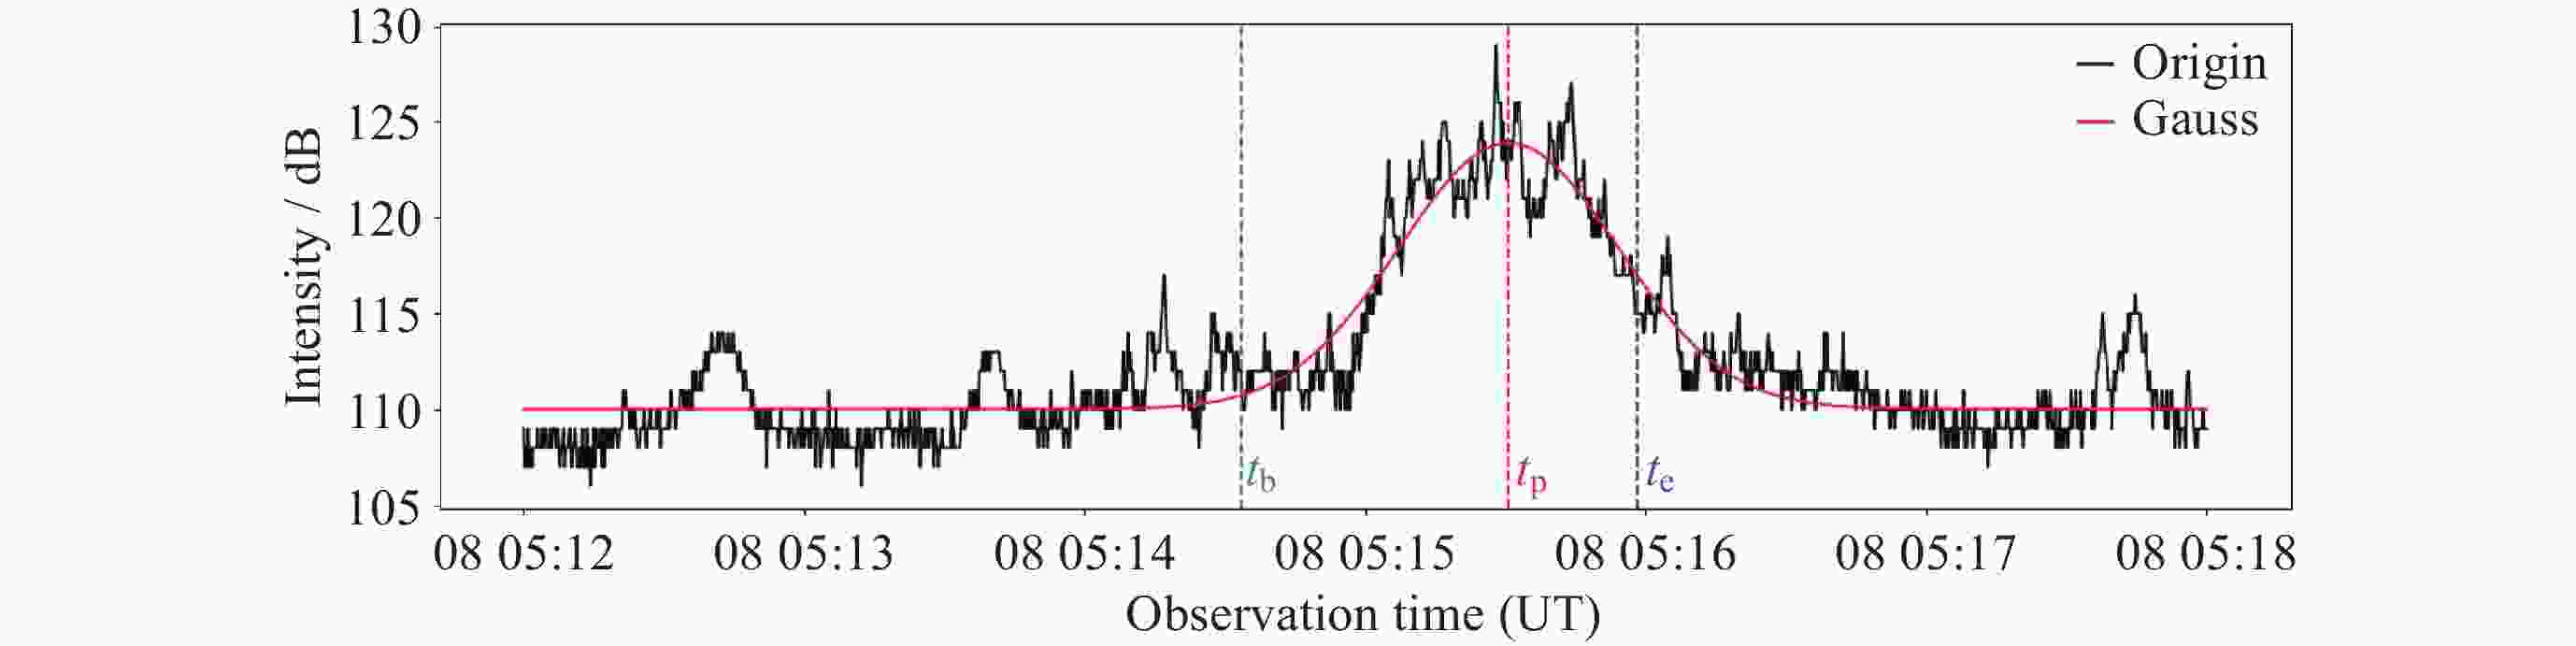
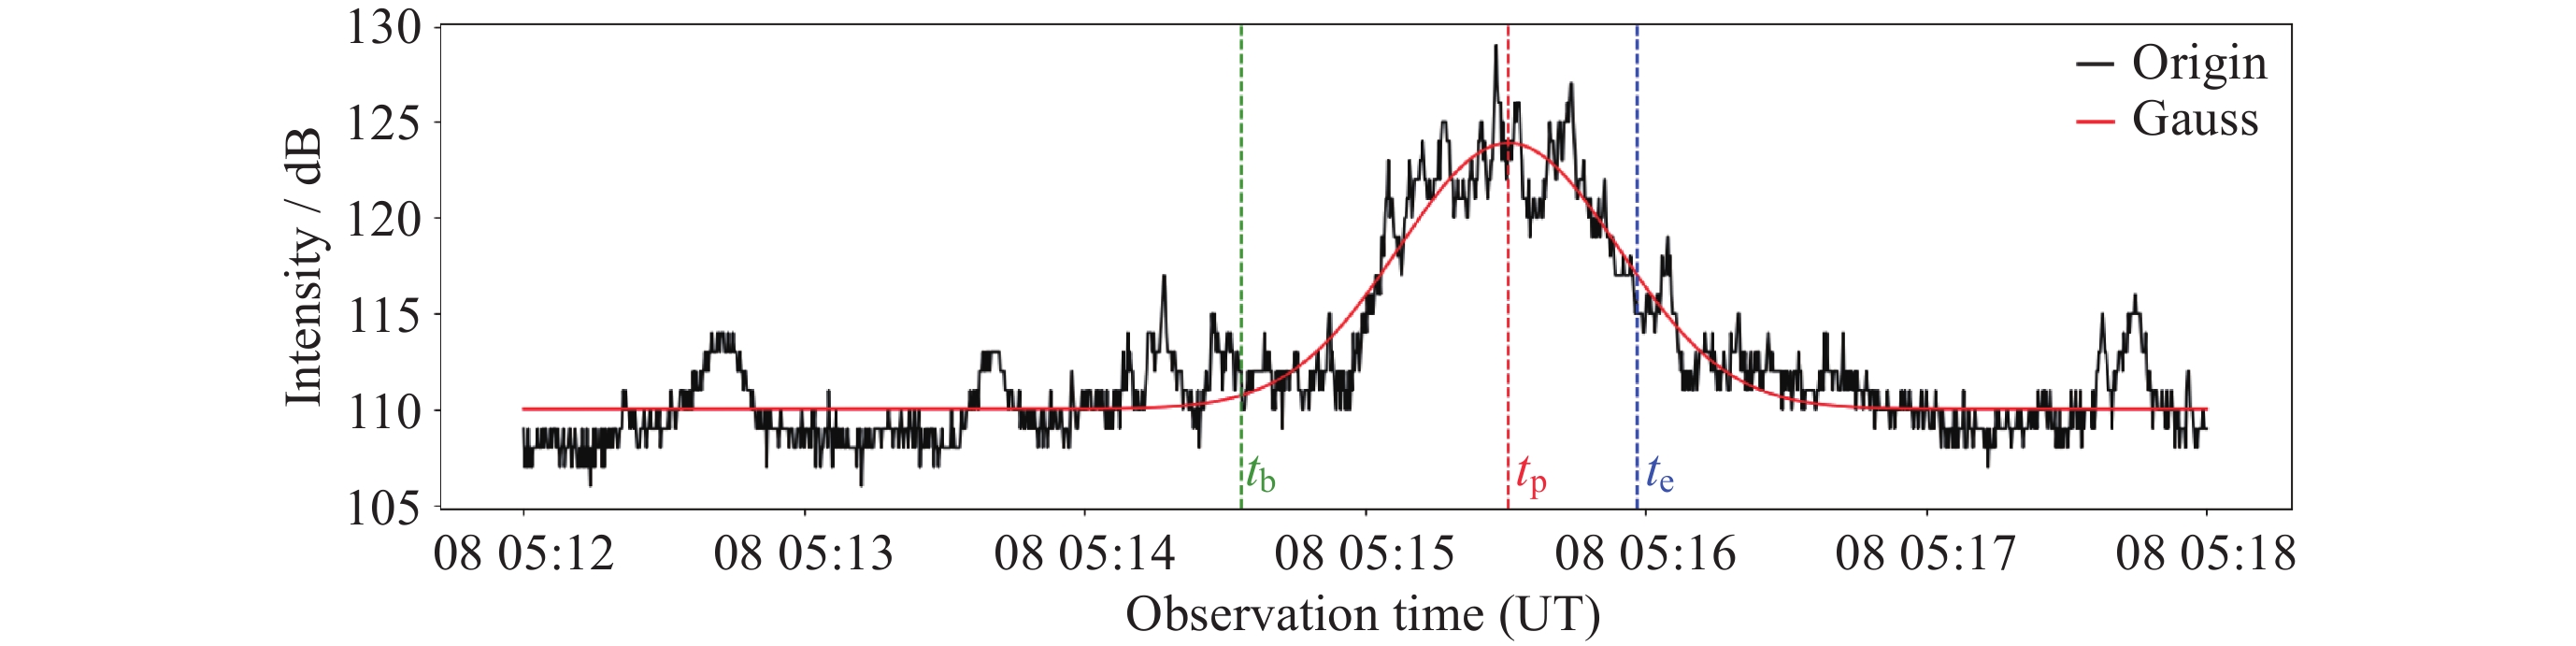
图 4 固定频率 117.88 MHz 的通量密度(黑色实线)随时间的变化曲线及高斯拟合曲线(红色实线)
Figure 4. Curve of the flux density (black solid line) at a fixed frequency of 117.88 MHz varying with time and the Gaussian fitting curve (red solid line)
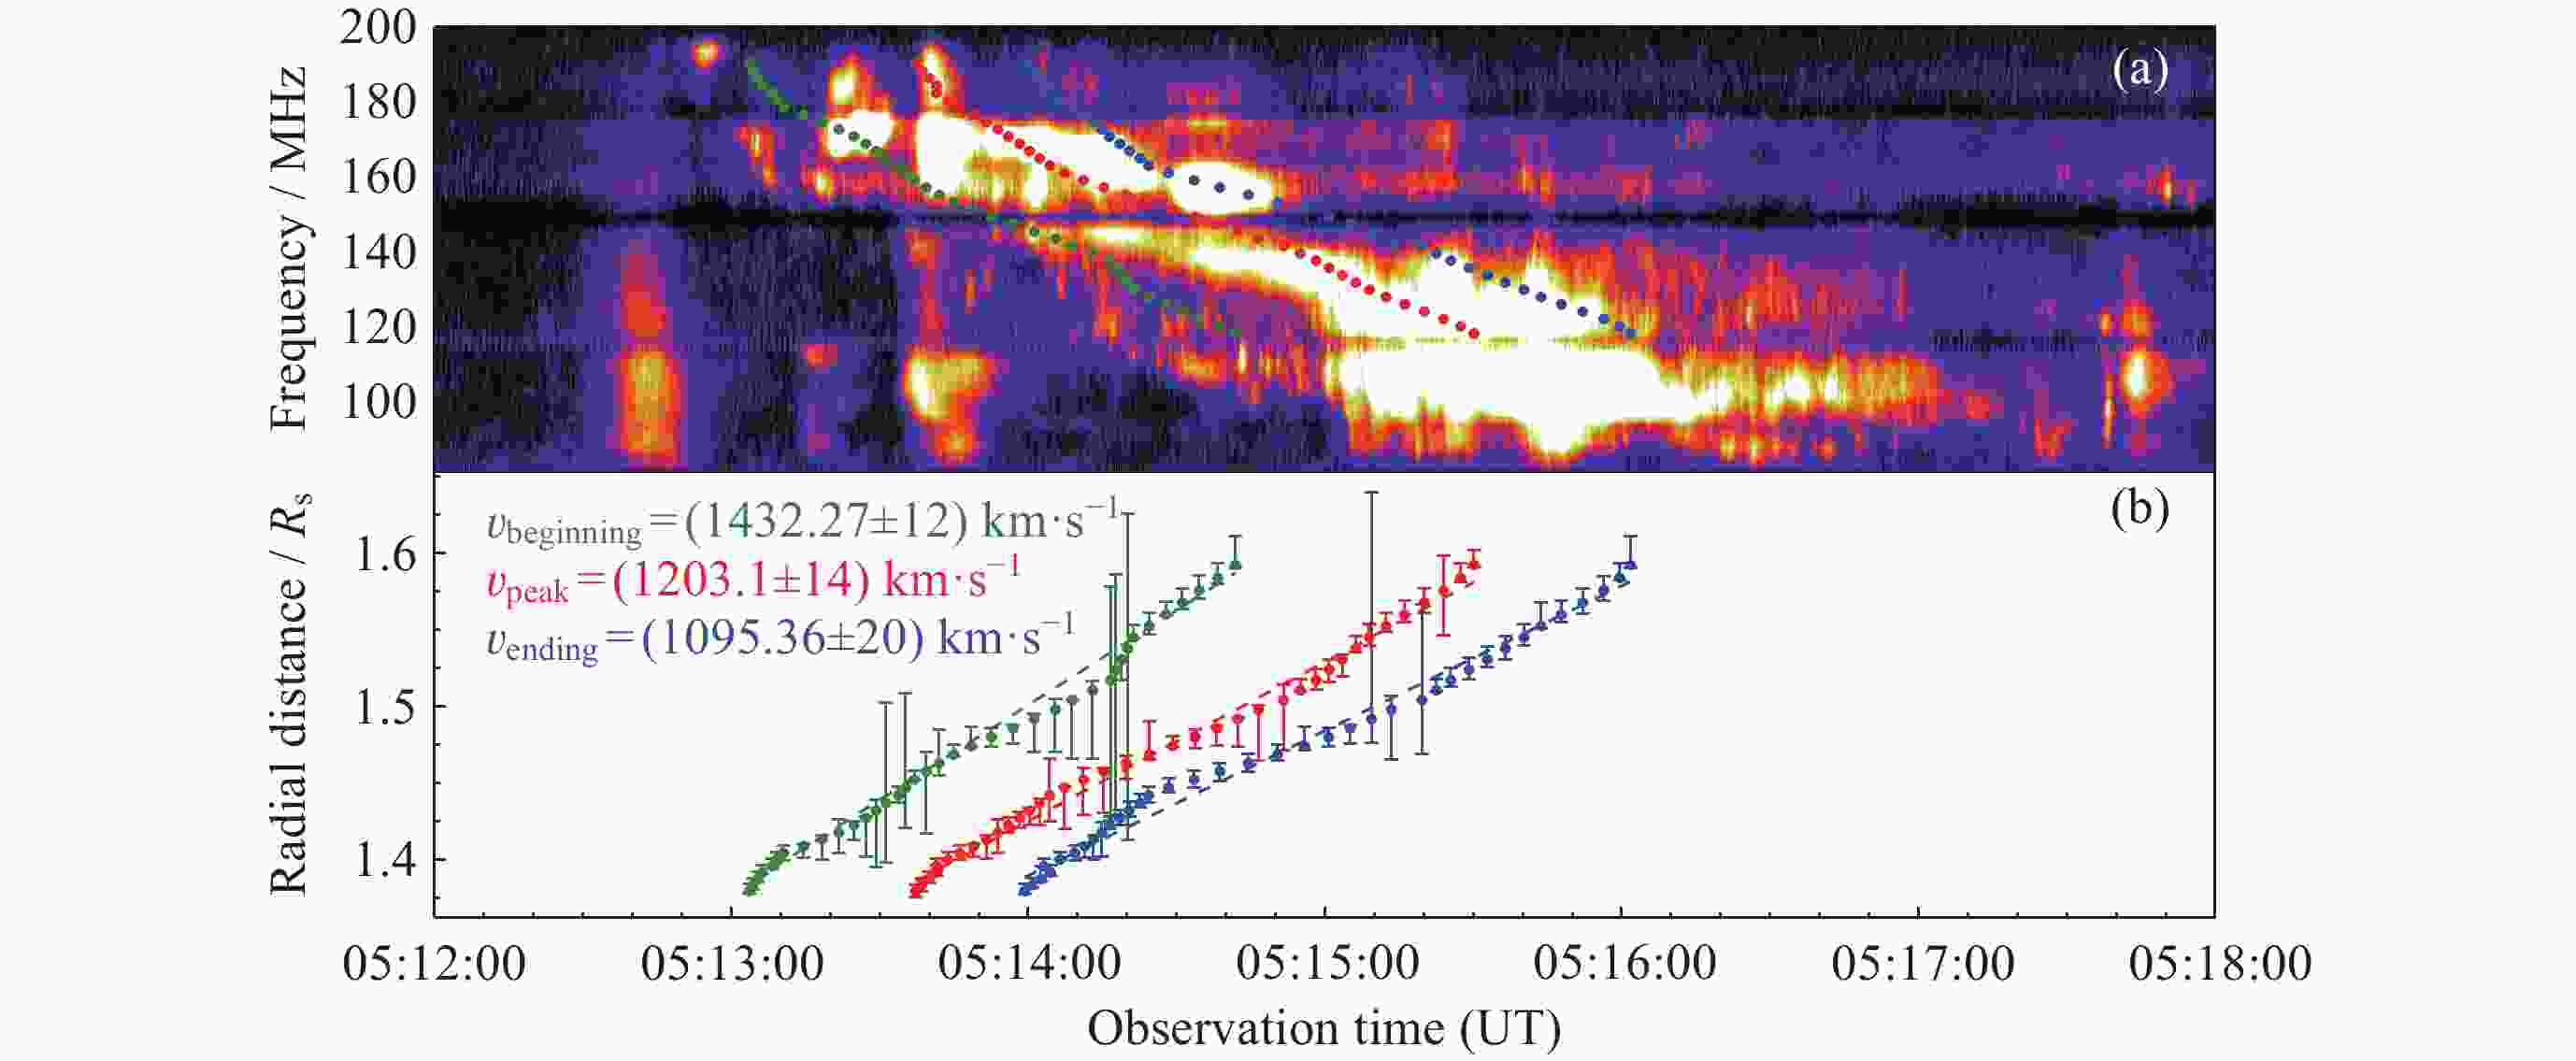
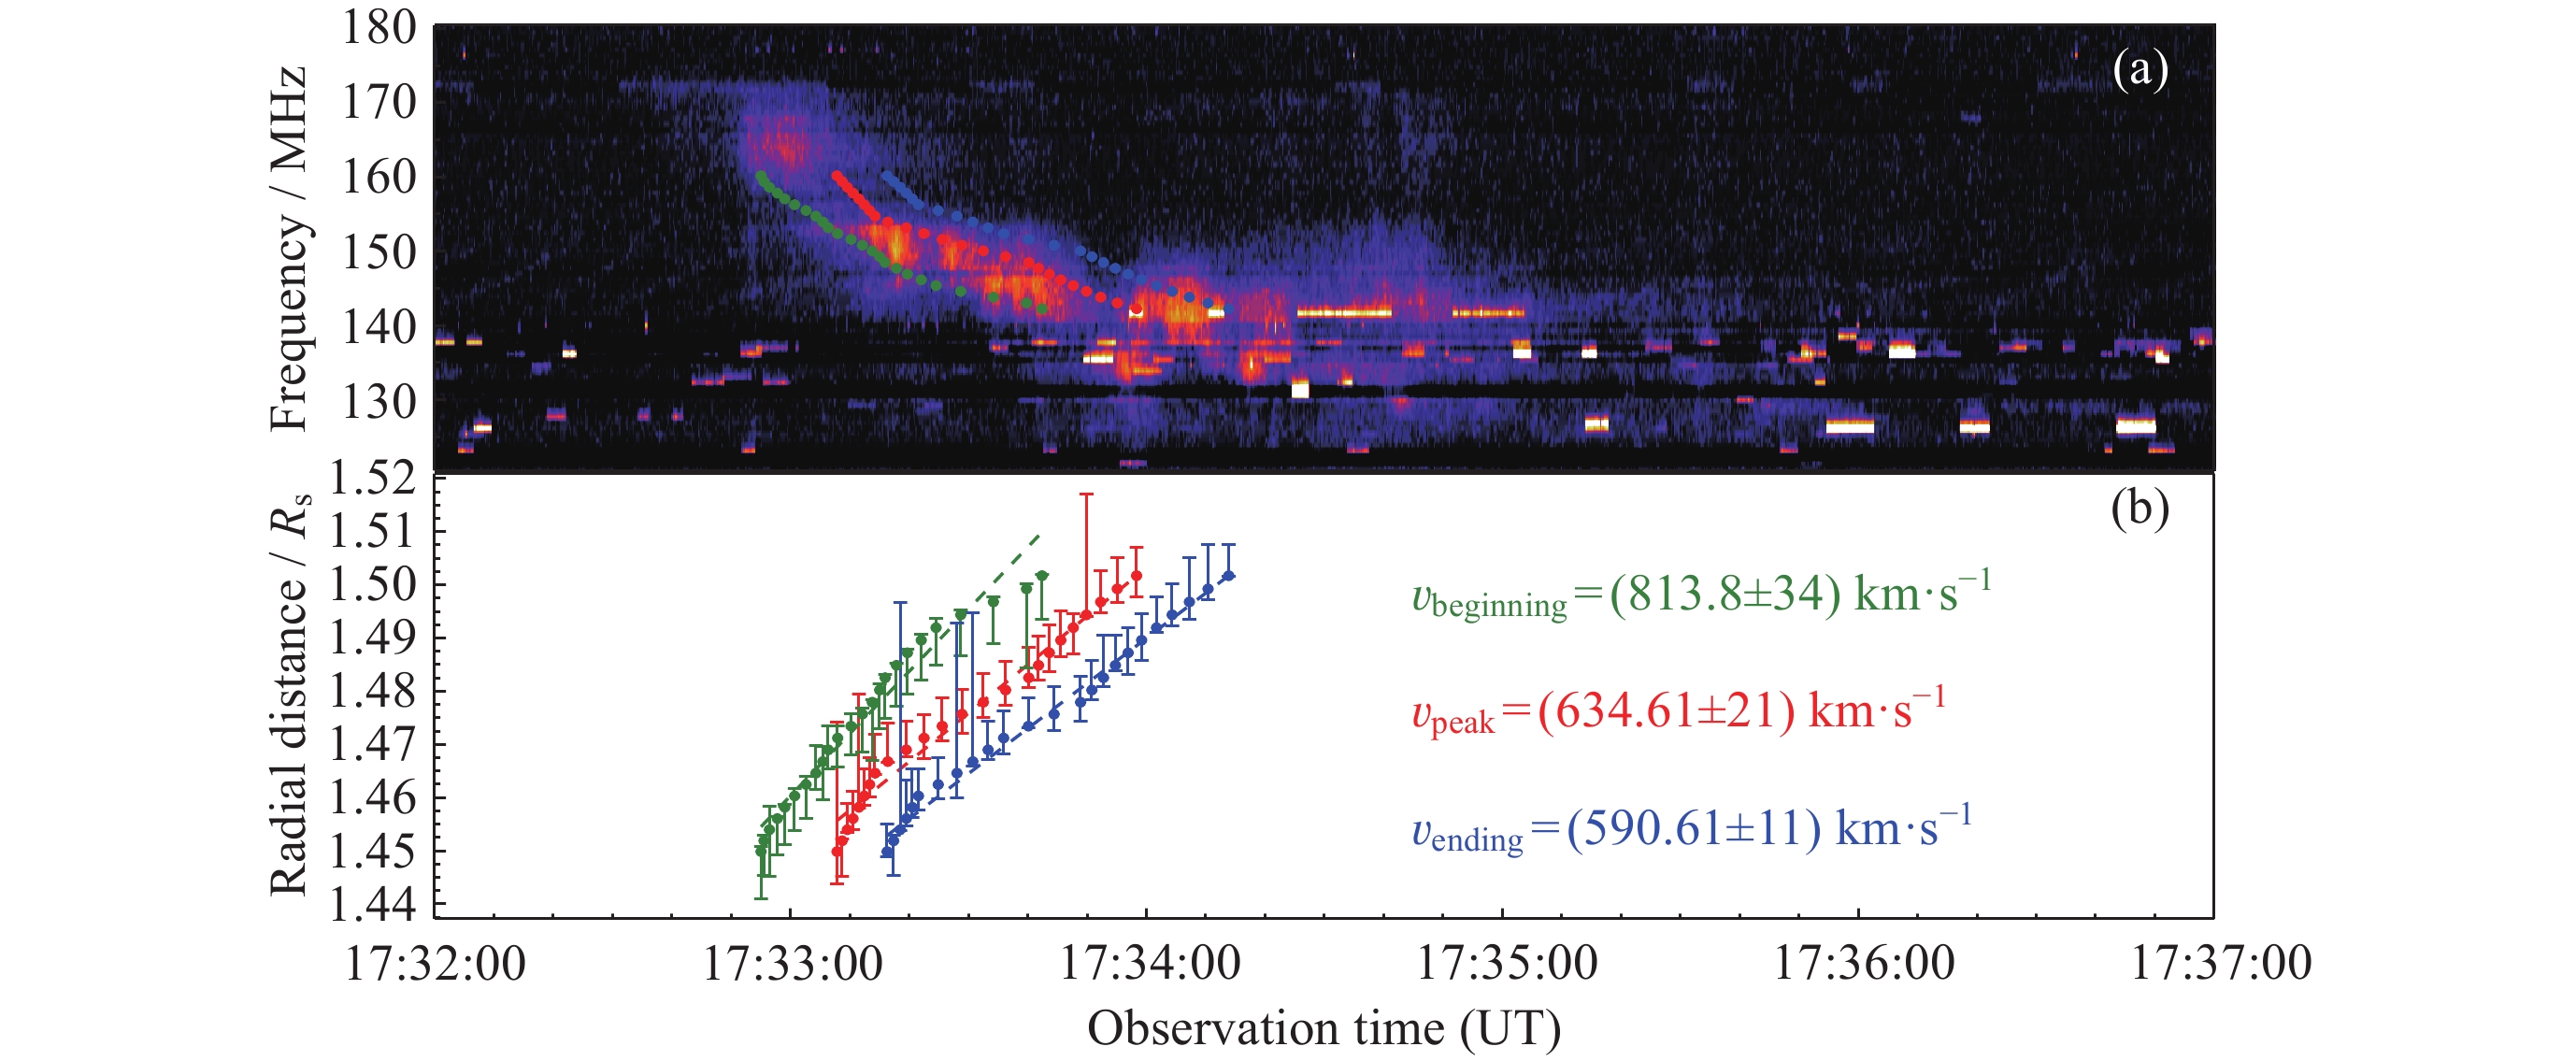
图 5 (a) 2024 年 5 月 8 日 HUMAIN 台站观测到的Ⅱ型射电暴动态射电频谱. (b)射电暴频谱 三个条带(起始沿、峰沿、终了沿)的射电源日心距离及其误差条随时间的变化和由频谱漂移得出的相应初始激波速度. 绿点、红点、蓝点分别代表频谱的起始沿、峰沿和终了沿
Figure 5. (a) Dynamic radio spectrum of a type II radio burst observed by the HUMAIN station on 8 May 2024. (b) Heliocentric distances of the three edges (beginning, peak, and ending) of the radio burst spectrum and their error bars as a function of time, along with the corresponding initial shock velocities derived from the spectral drift. Green, red, blue dots represent the beginning edge, peak edge, and ending edge of the spectrum, respectively
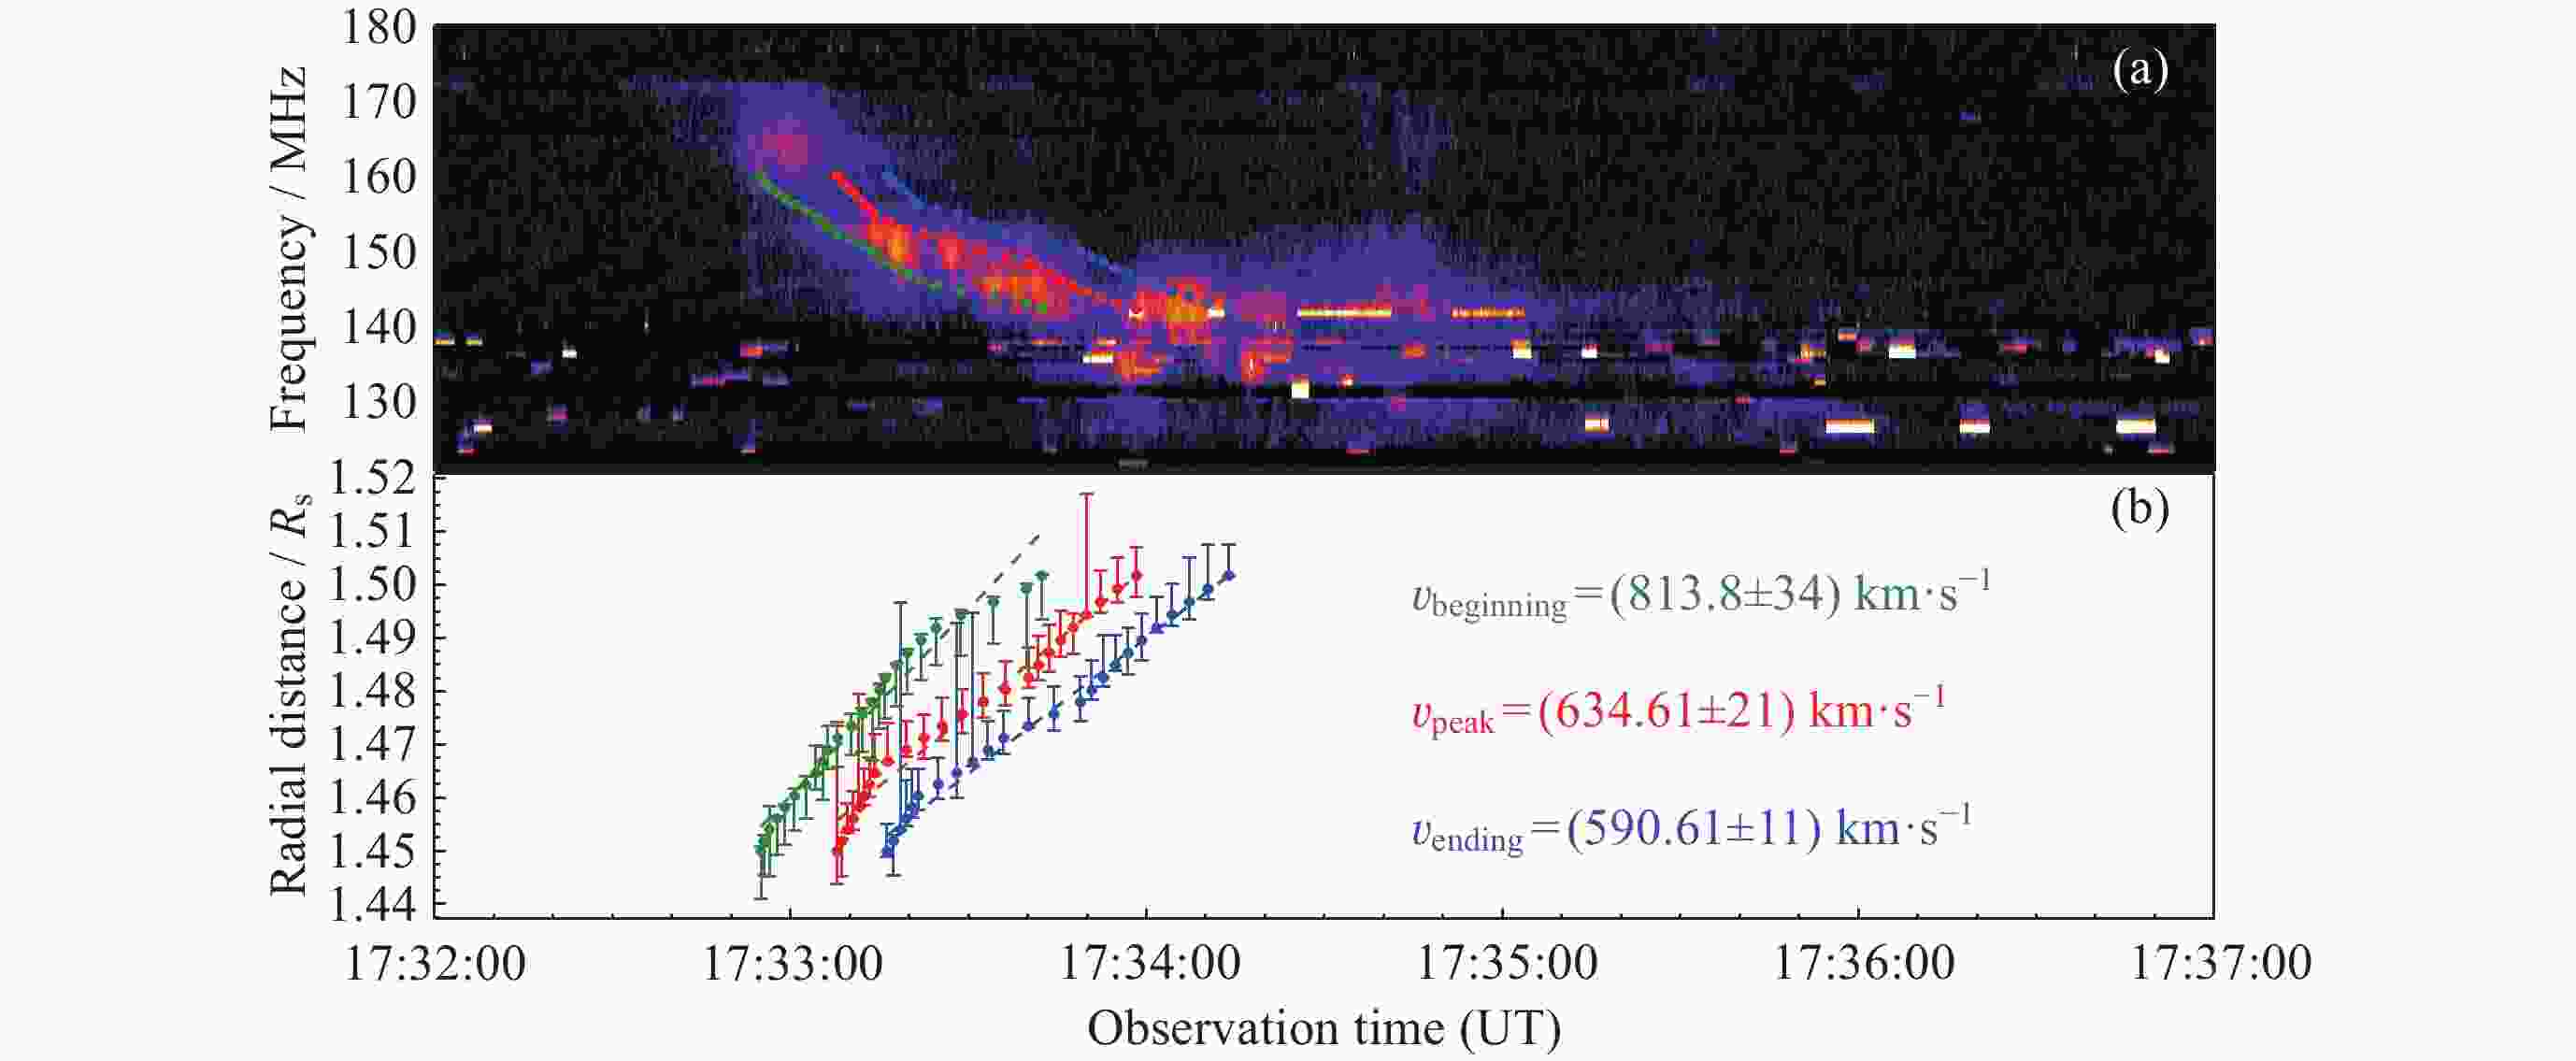
图 6 (a) 2024 年 5 月 9 日 HURBANOVO 台站观测到的Ⅱ型射电暴动态射电频谱. (b) 射电暴频谱的三个条带(起始沿、 峰沿、终了沿)的射电源日心距离及其误差条随时间的变化及由频谱漂移得出的相应初始激波速度. 绿点、红点、蓝点分别代表频谱的起始沿、峰沿和终了沿
Figure 6. (a) Dynamic radio spectrum of a type II radio burst observed by the HURBANOVO station on 9 May 2024, as well as the beginning edge (green), peak edge (red), and ending edge (blue) of the spectrum. (b) Heliocentric distances of the three edges (beginning, peak, and ending) of the radio burst spectrum and their error bars as a function of time, along with the corresponding initial shock velocities derived from the spectral drift. Green, red, blue dots represent the beginning edge, peak edge, and ending edge of the spectrum, respectively
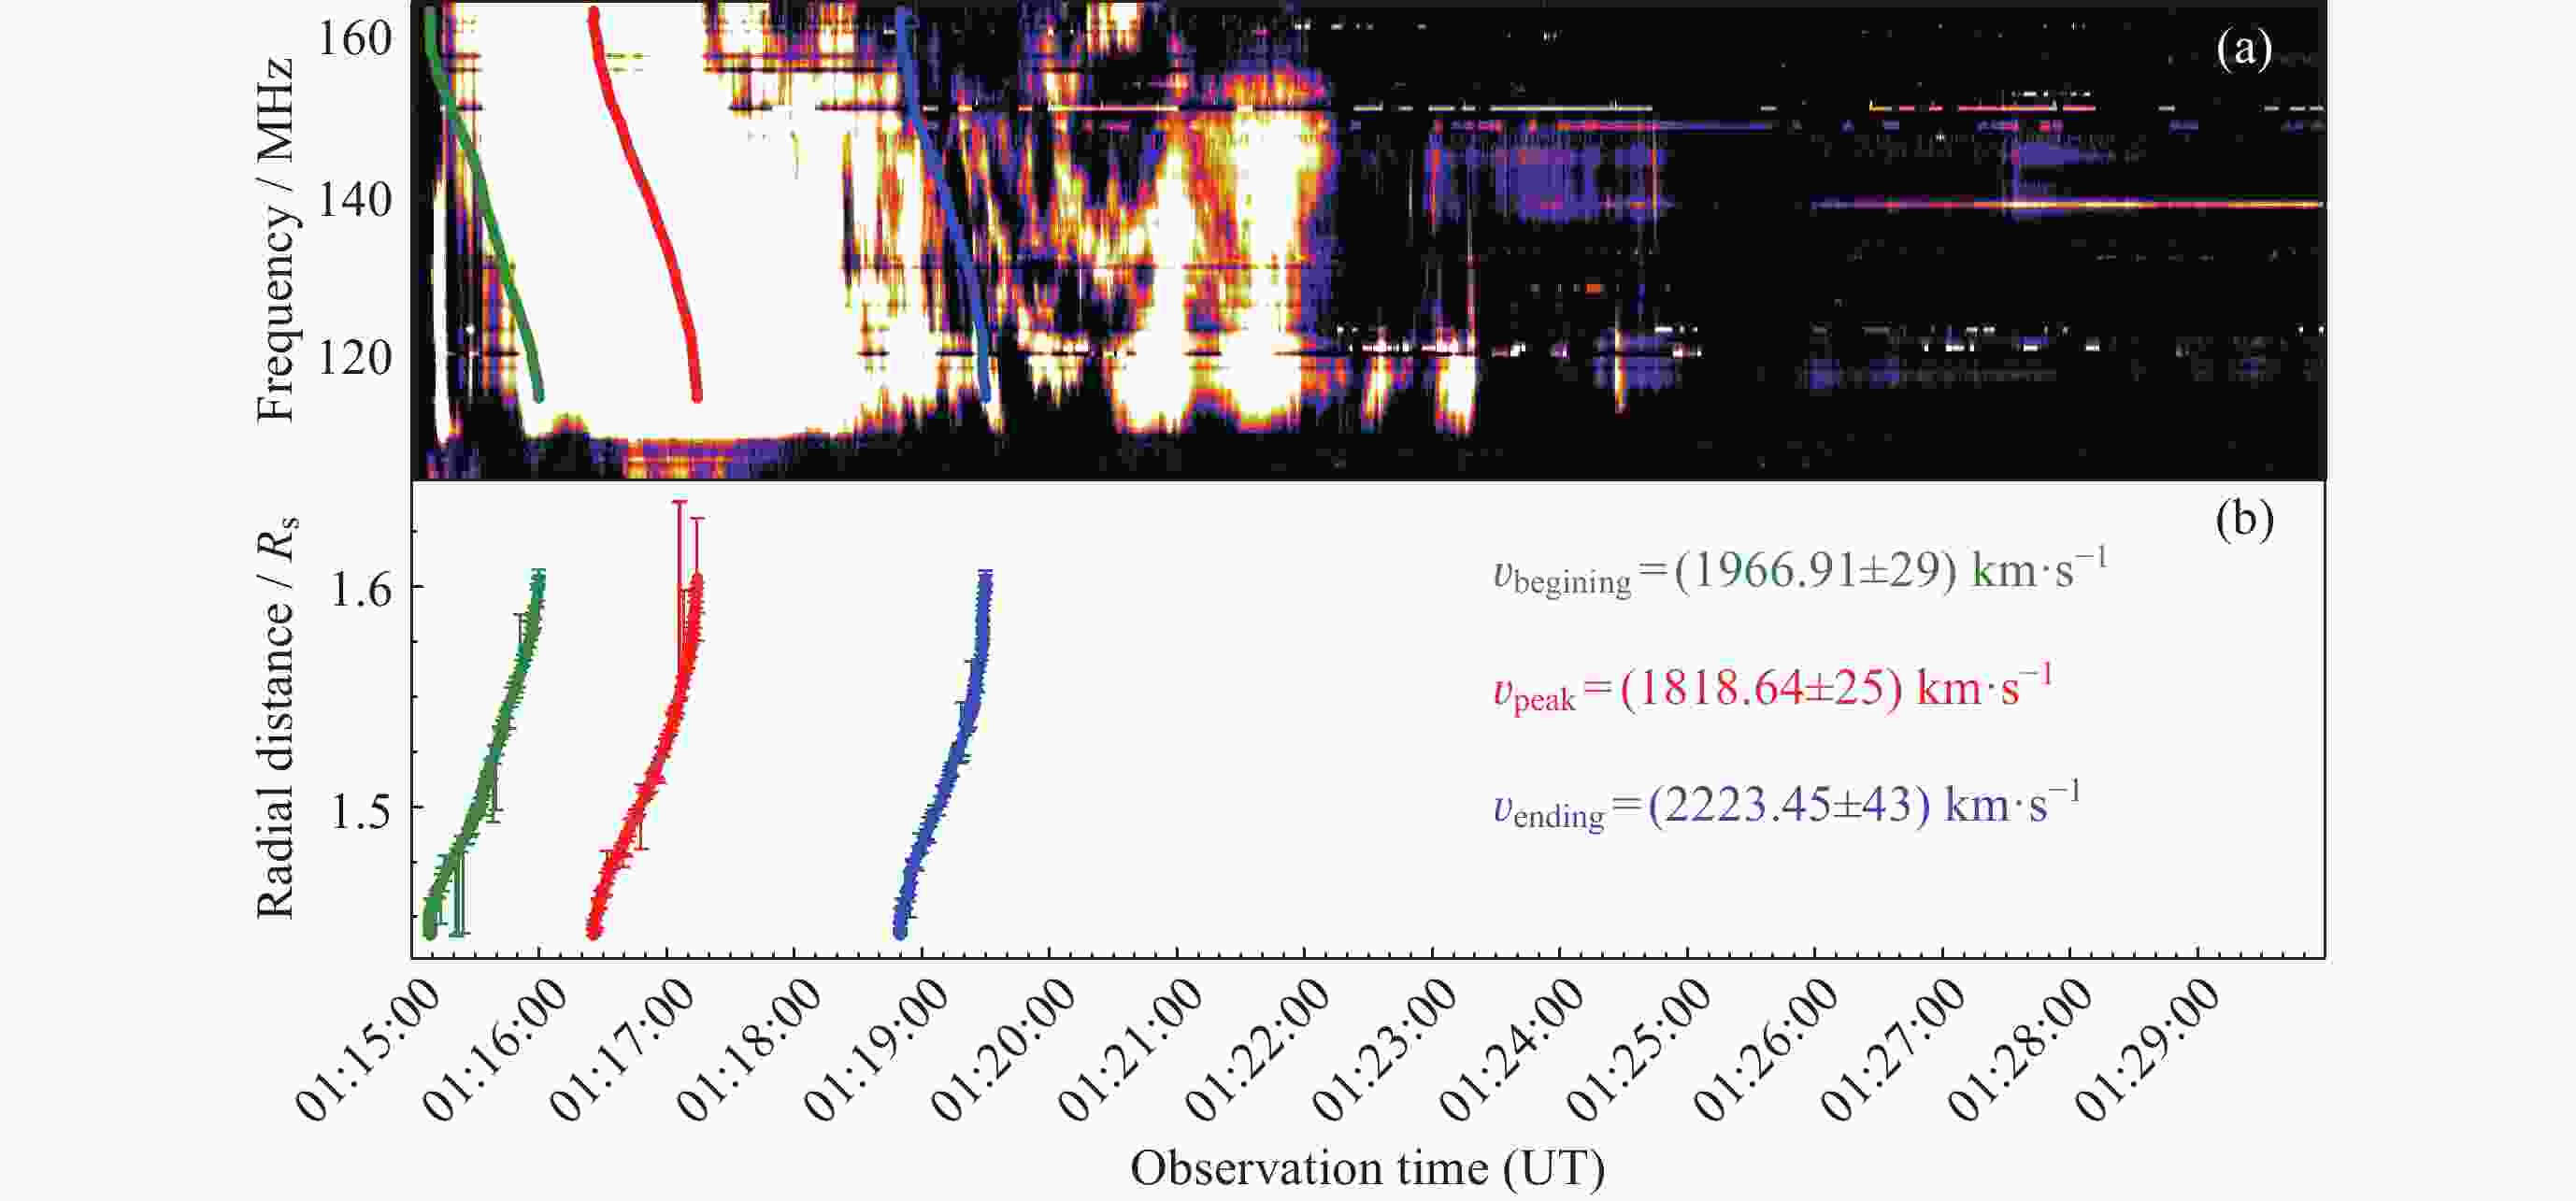
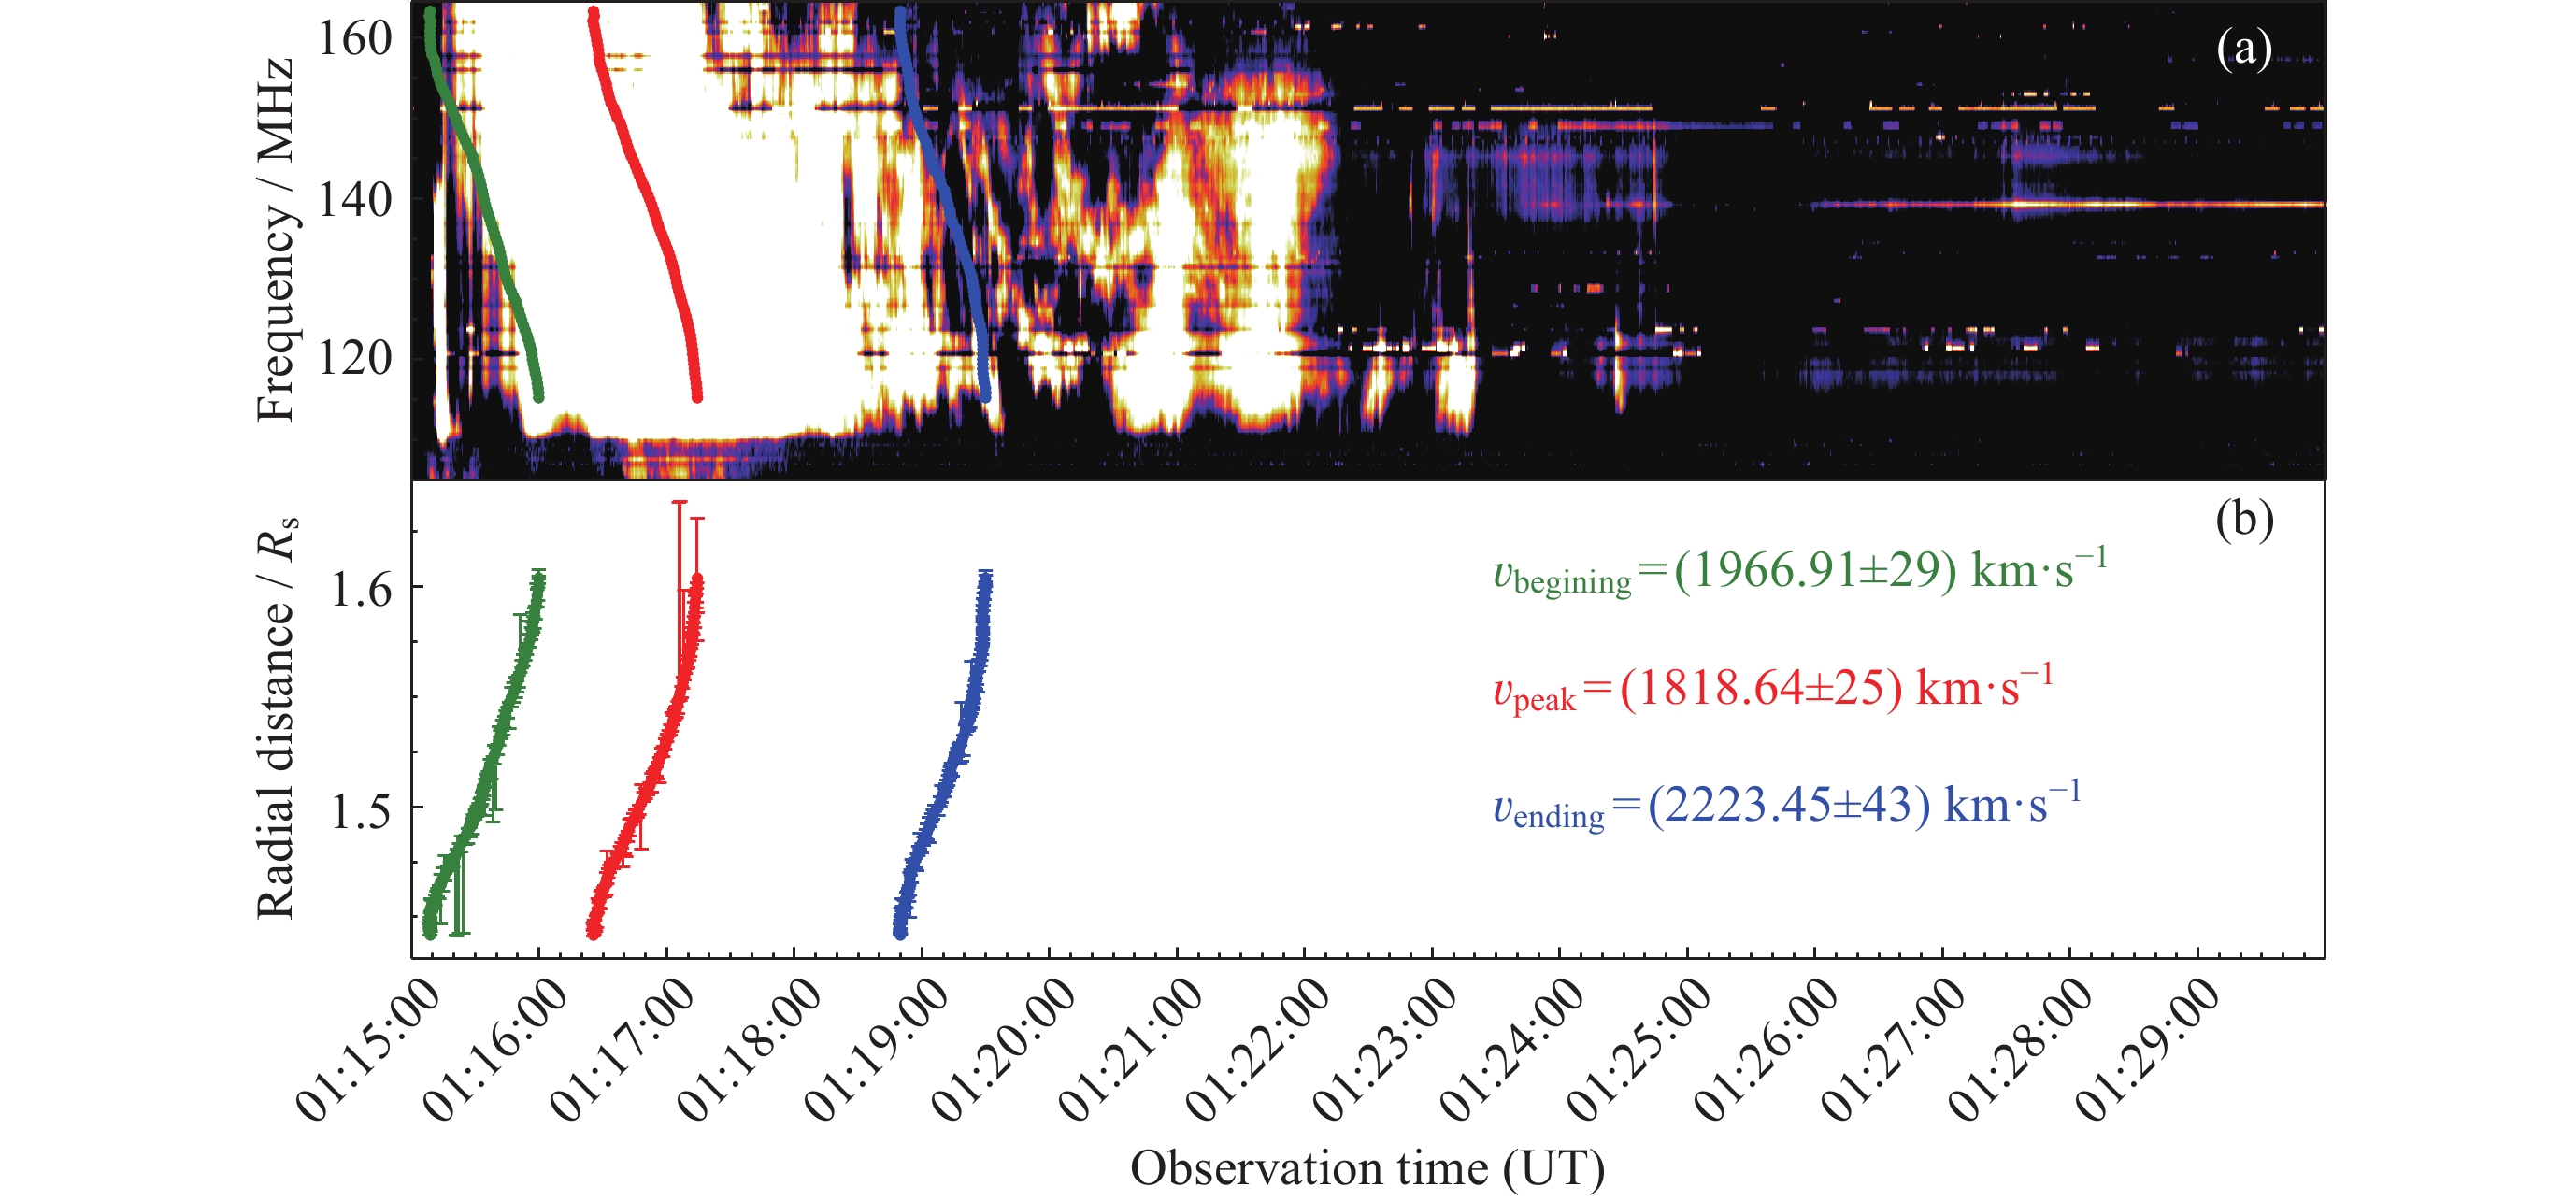
图 7 (a) 2024 年 5 月 11 日 ALMATY 台站观测到的Ⅱ型射电暴动态射电频谱及频谱的起始沿(绿点)、峰沿(红点)、 和终了沿(蓝点). (b)射电暴频谱的三个条带(起始沿、峰沿、终了沿)的射电源日心距离及其误差条随时间的变化及由频谱漂移得出的相应初始激波速度
Figure 7. (a) Dynamic radio spectrum of a type II radio burst observed by the ALMATY station on 11 May 2024, as well as the beginning edge (green), peak edge (red), and ending edge (blue) of the spectrum. (b) Heliocentric distances of the three edges (beginning, peak, and ending) of the radio burst spectrum and their error bars as a function of time, along with the corresponding initial shock velocities derived from the spectral drif
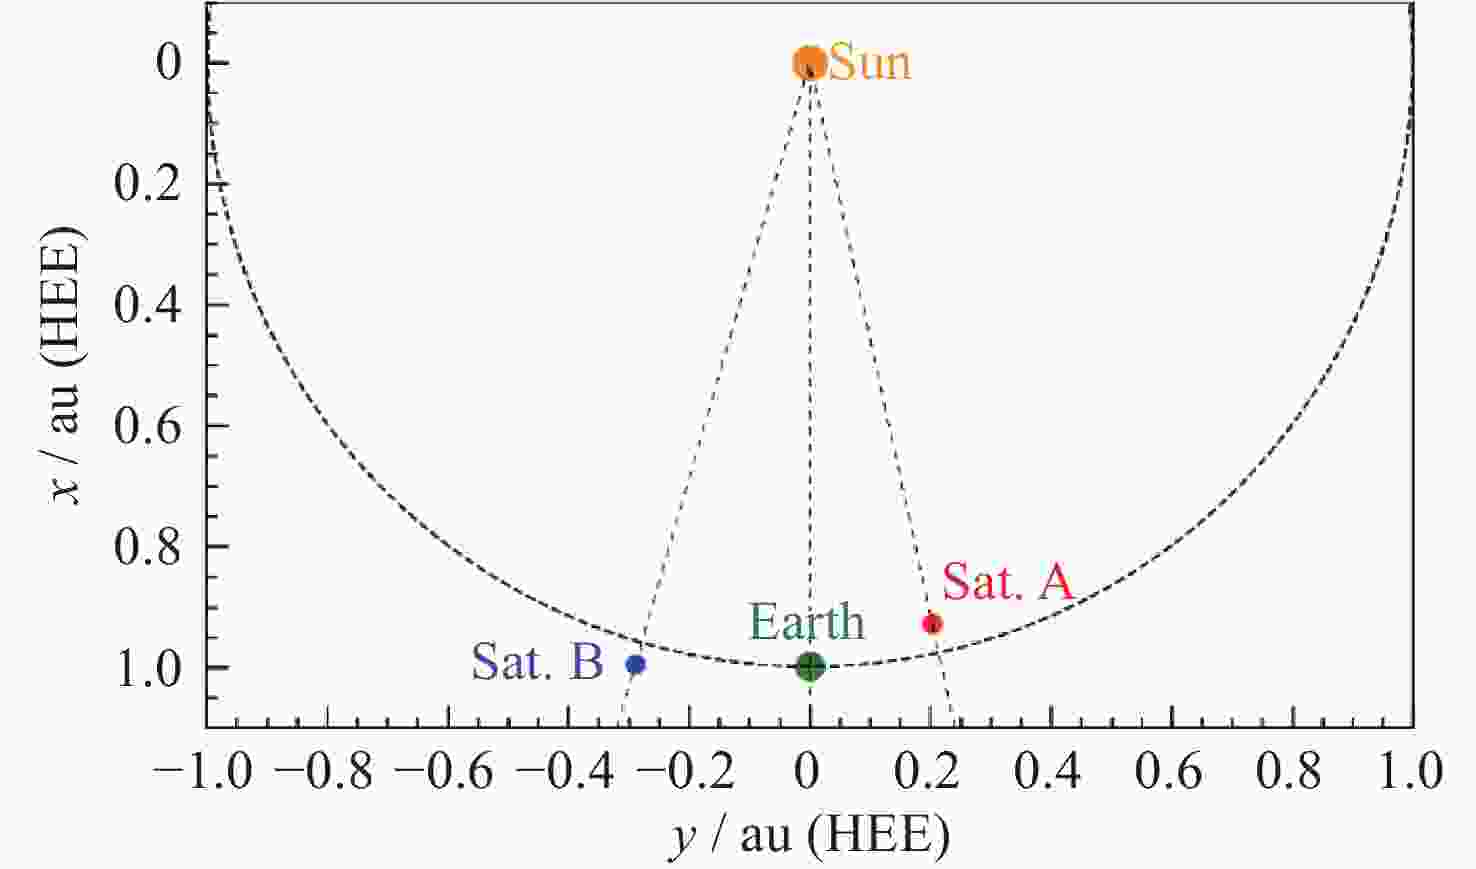
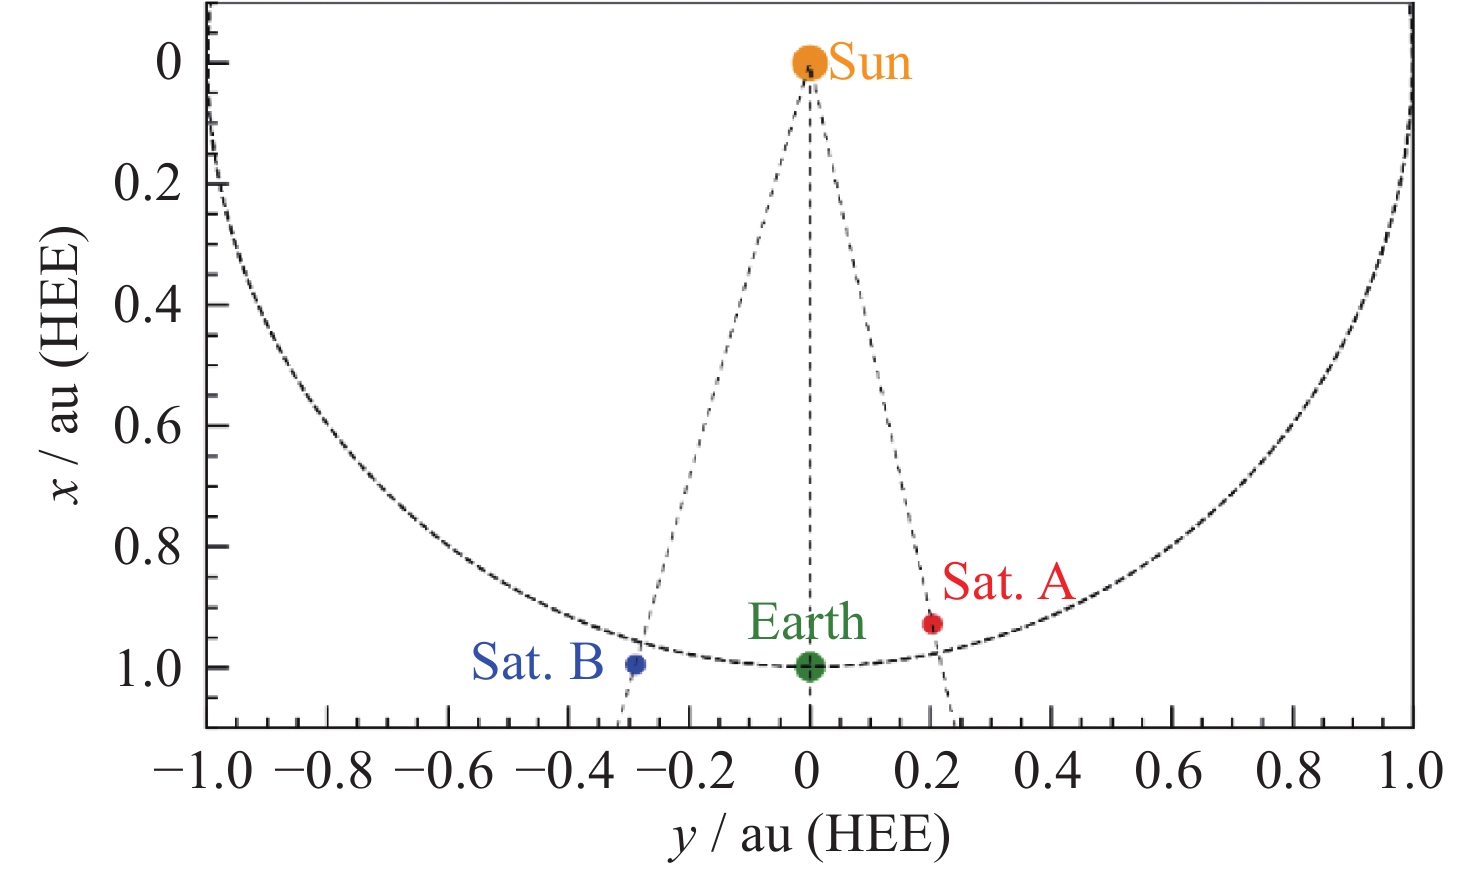
图 8 太阳、地球与 STEREO A/B 卫星在 2024 年 5 月 8 日 12:00 UT 时的相对位置
Figure 8. Relative locations of the Sun, the Earth and the STEREO A/B satellites at 12:00 UT on 8 May 2024
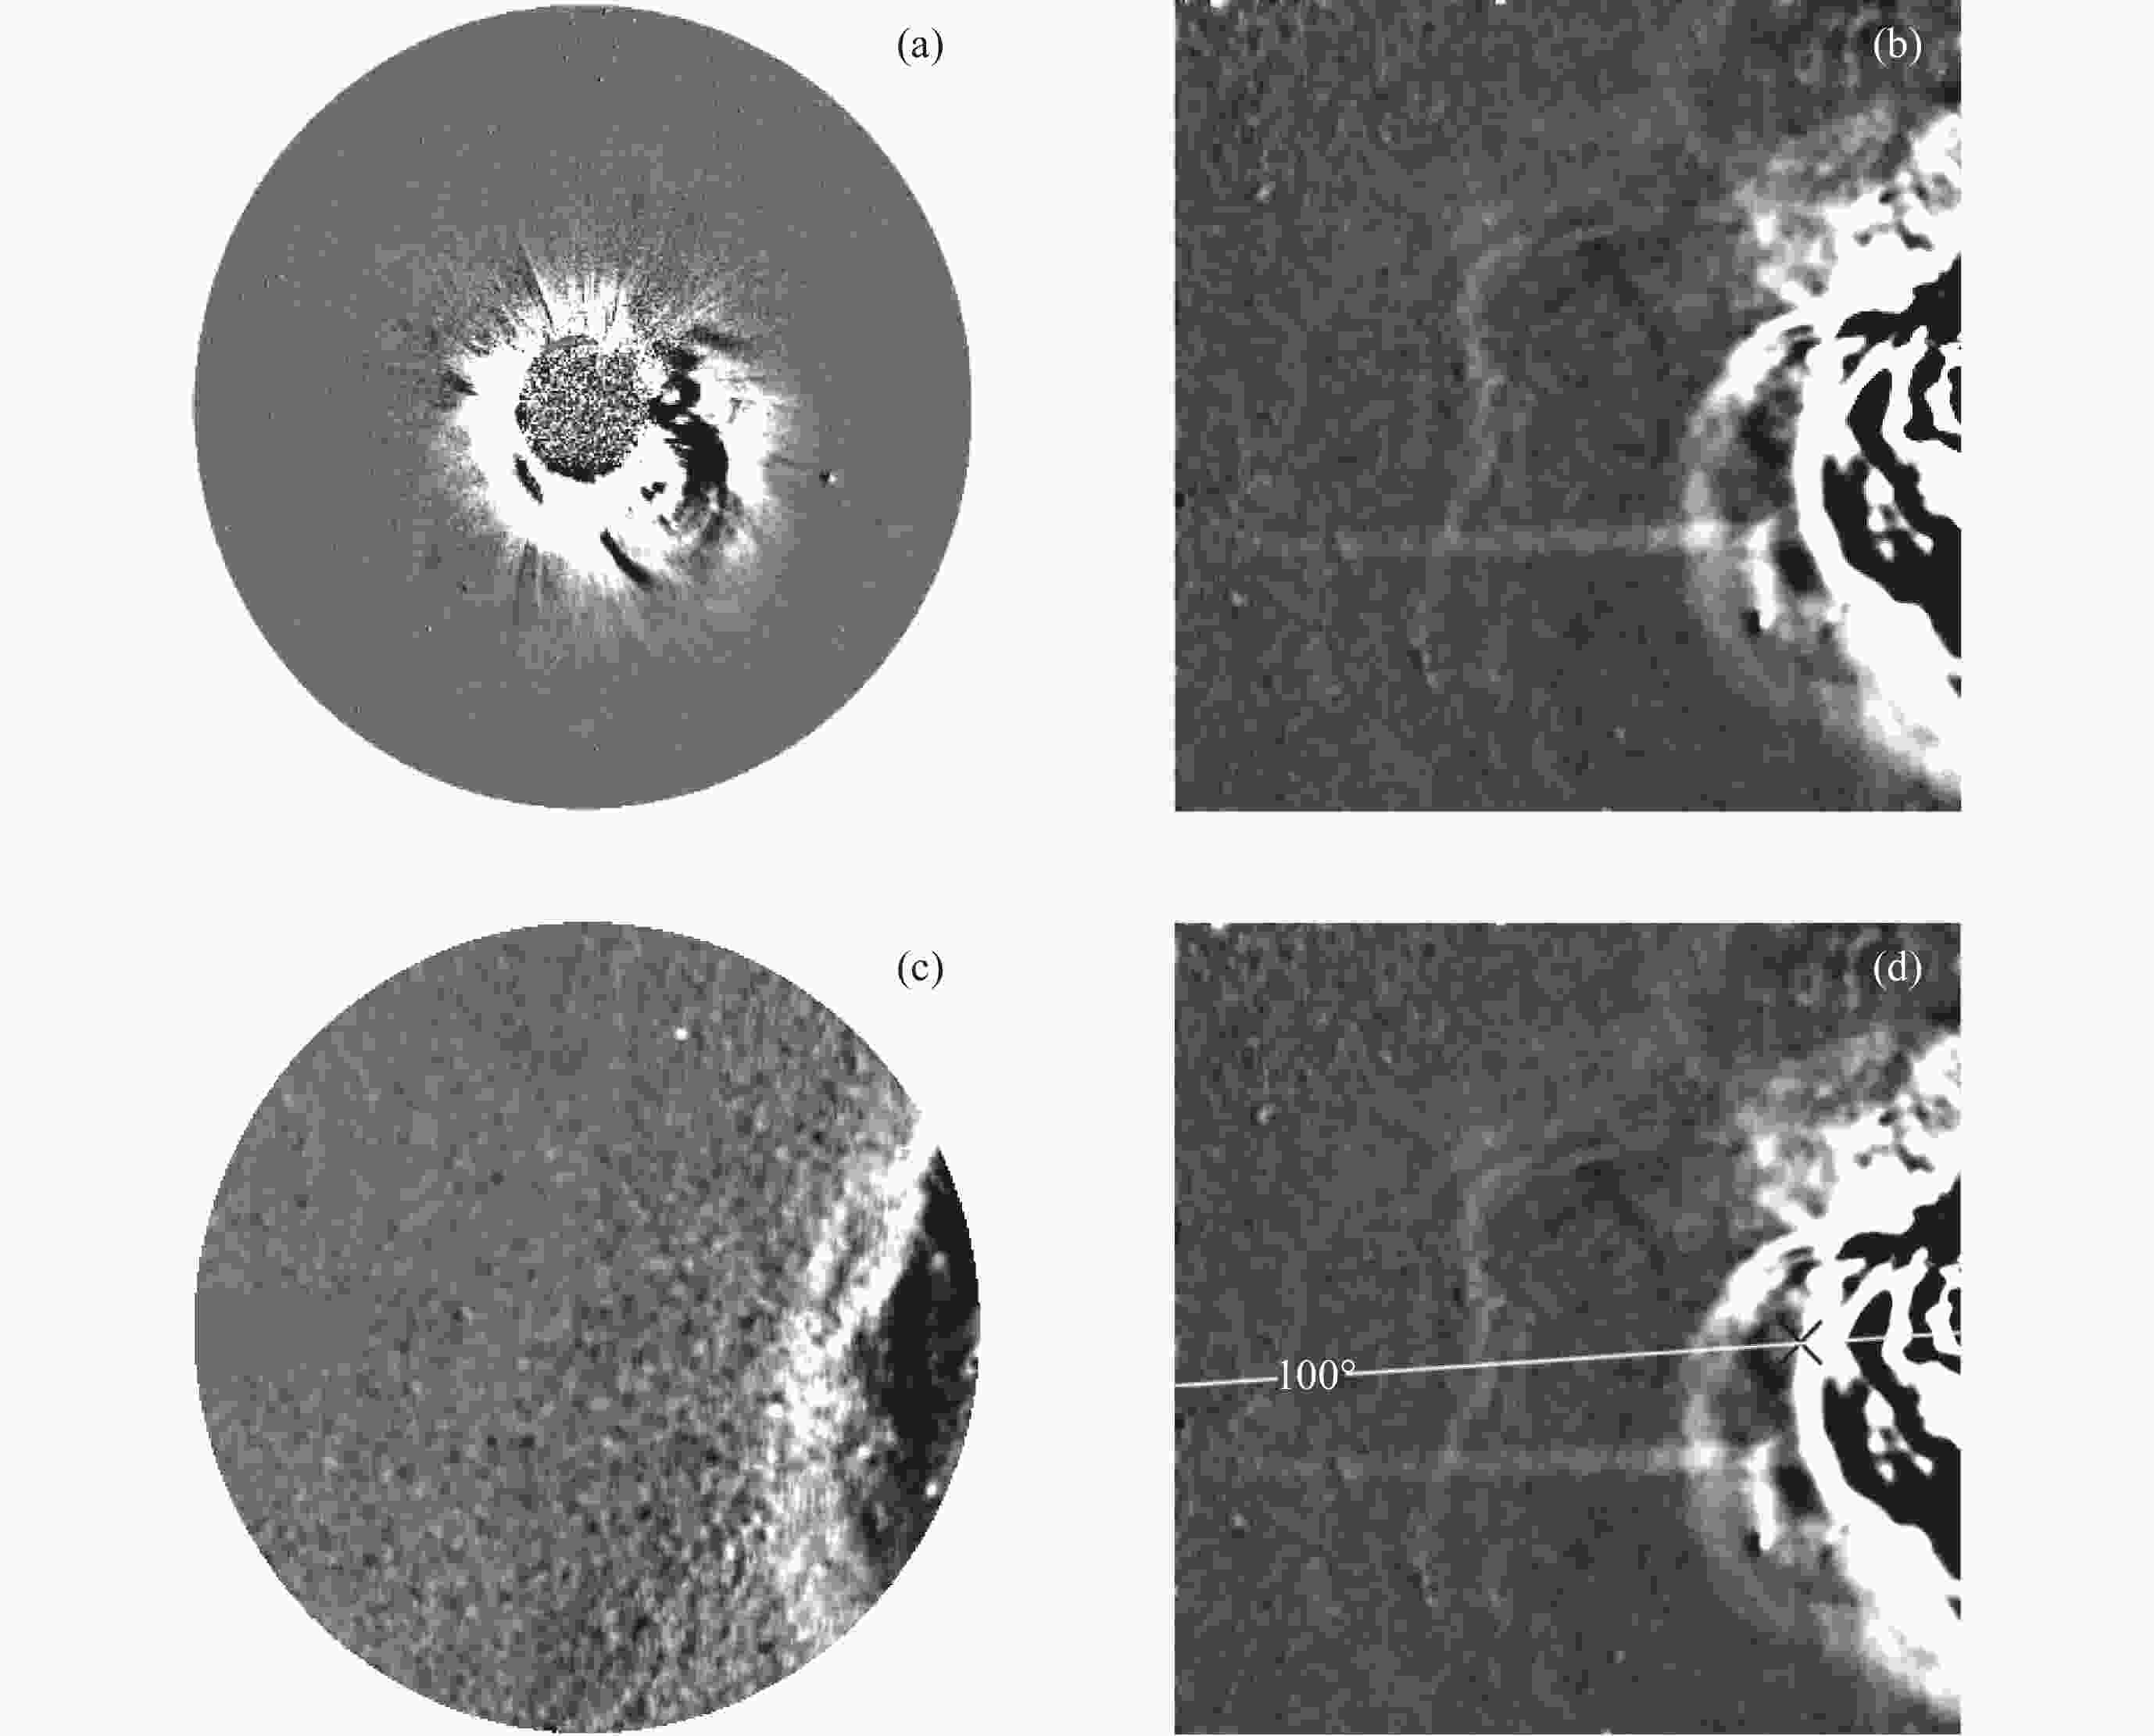
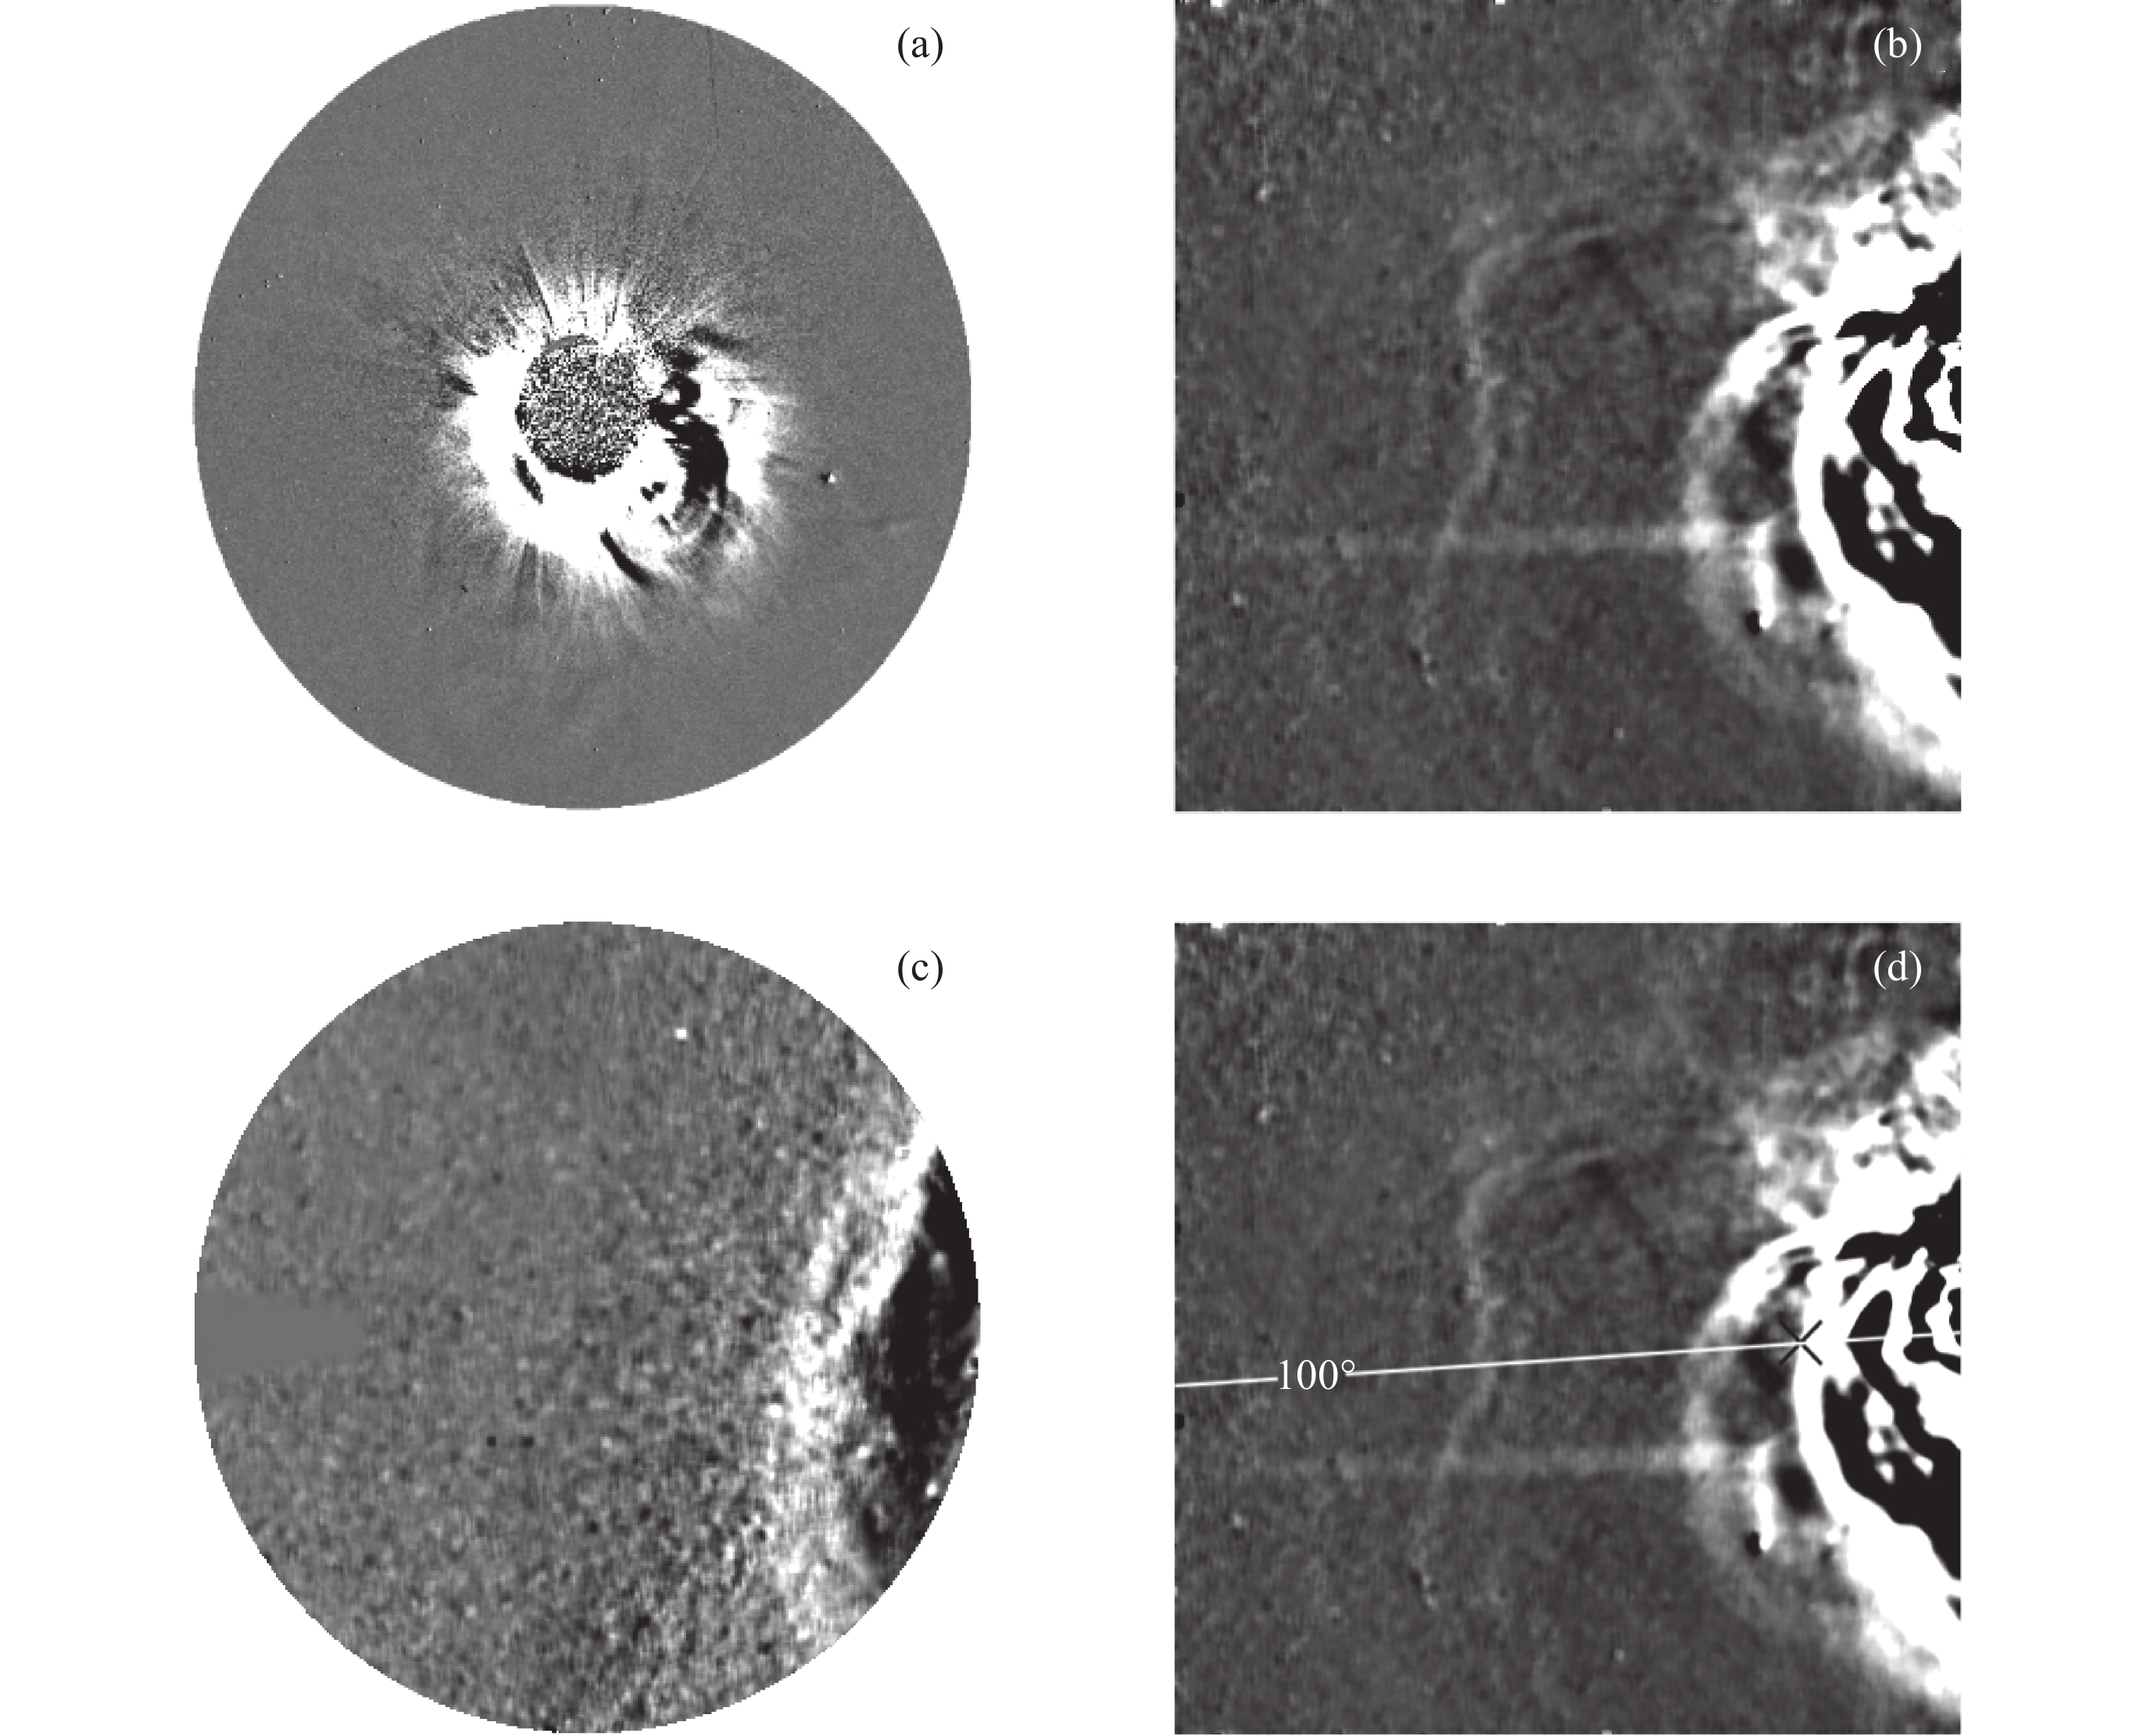
图 9 不同时刻 STEREO A/COR2, HI1 和 HI2 观测的移动差分图像以及人工采样. (a) COR2 在 2024 年 5 月 8 日 06:23 UT 的观测图像, (b) HI1 在 2024 年 5 月 8 日 16:08 UT 的观测图像, (c) HI2 在 2024 年 5 月 10 日 00:08 UT 的观测图像, (d) CME1 本体 2024 年 5 月 8 日 16:08 UT 在 HI1 视场中的亮前沿
Figure 9. Time-lapset difference images observed by STEREO A/COR2, HI1 and HI2 at different moments and a schematic diagram of manual sampling. (a) Observational image of COR2 at 06:23 UT on 8 May 2024, (b) observational image of HI1 at 16:08 UT on 8 May 2024, (c) observational image of HI2 at 00:08 UT on 10 May 2024, (d) schematic diagram of the bright front of the main body of CME1 in the field of view of HI1 at 16:08 UT on 8 May 2024
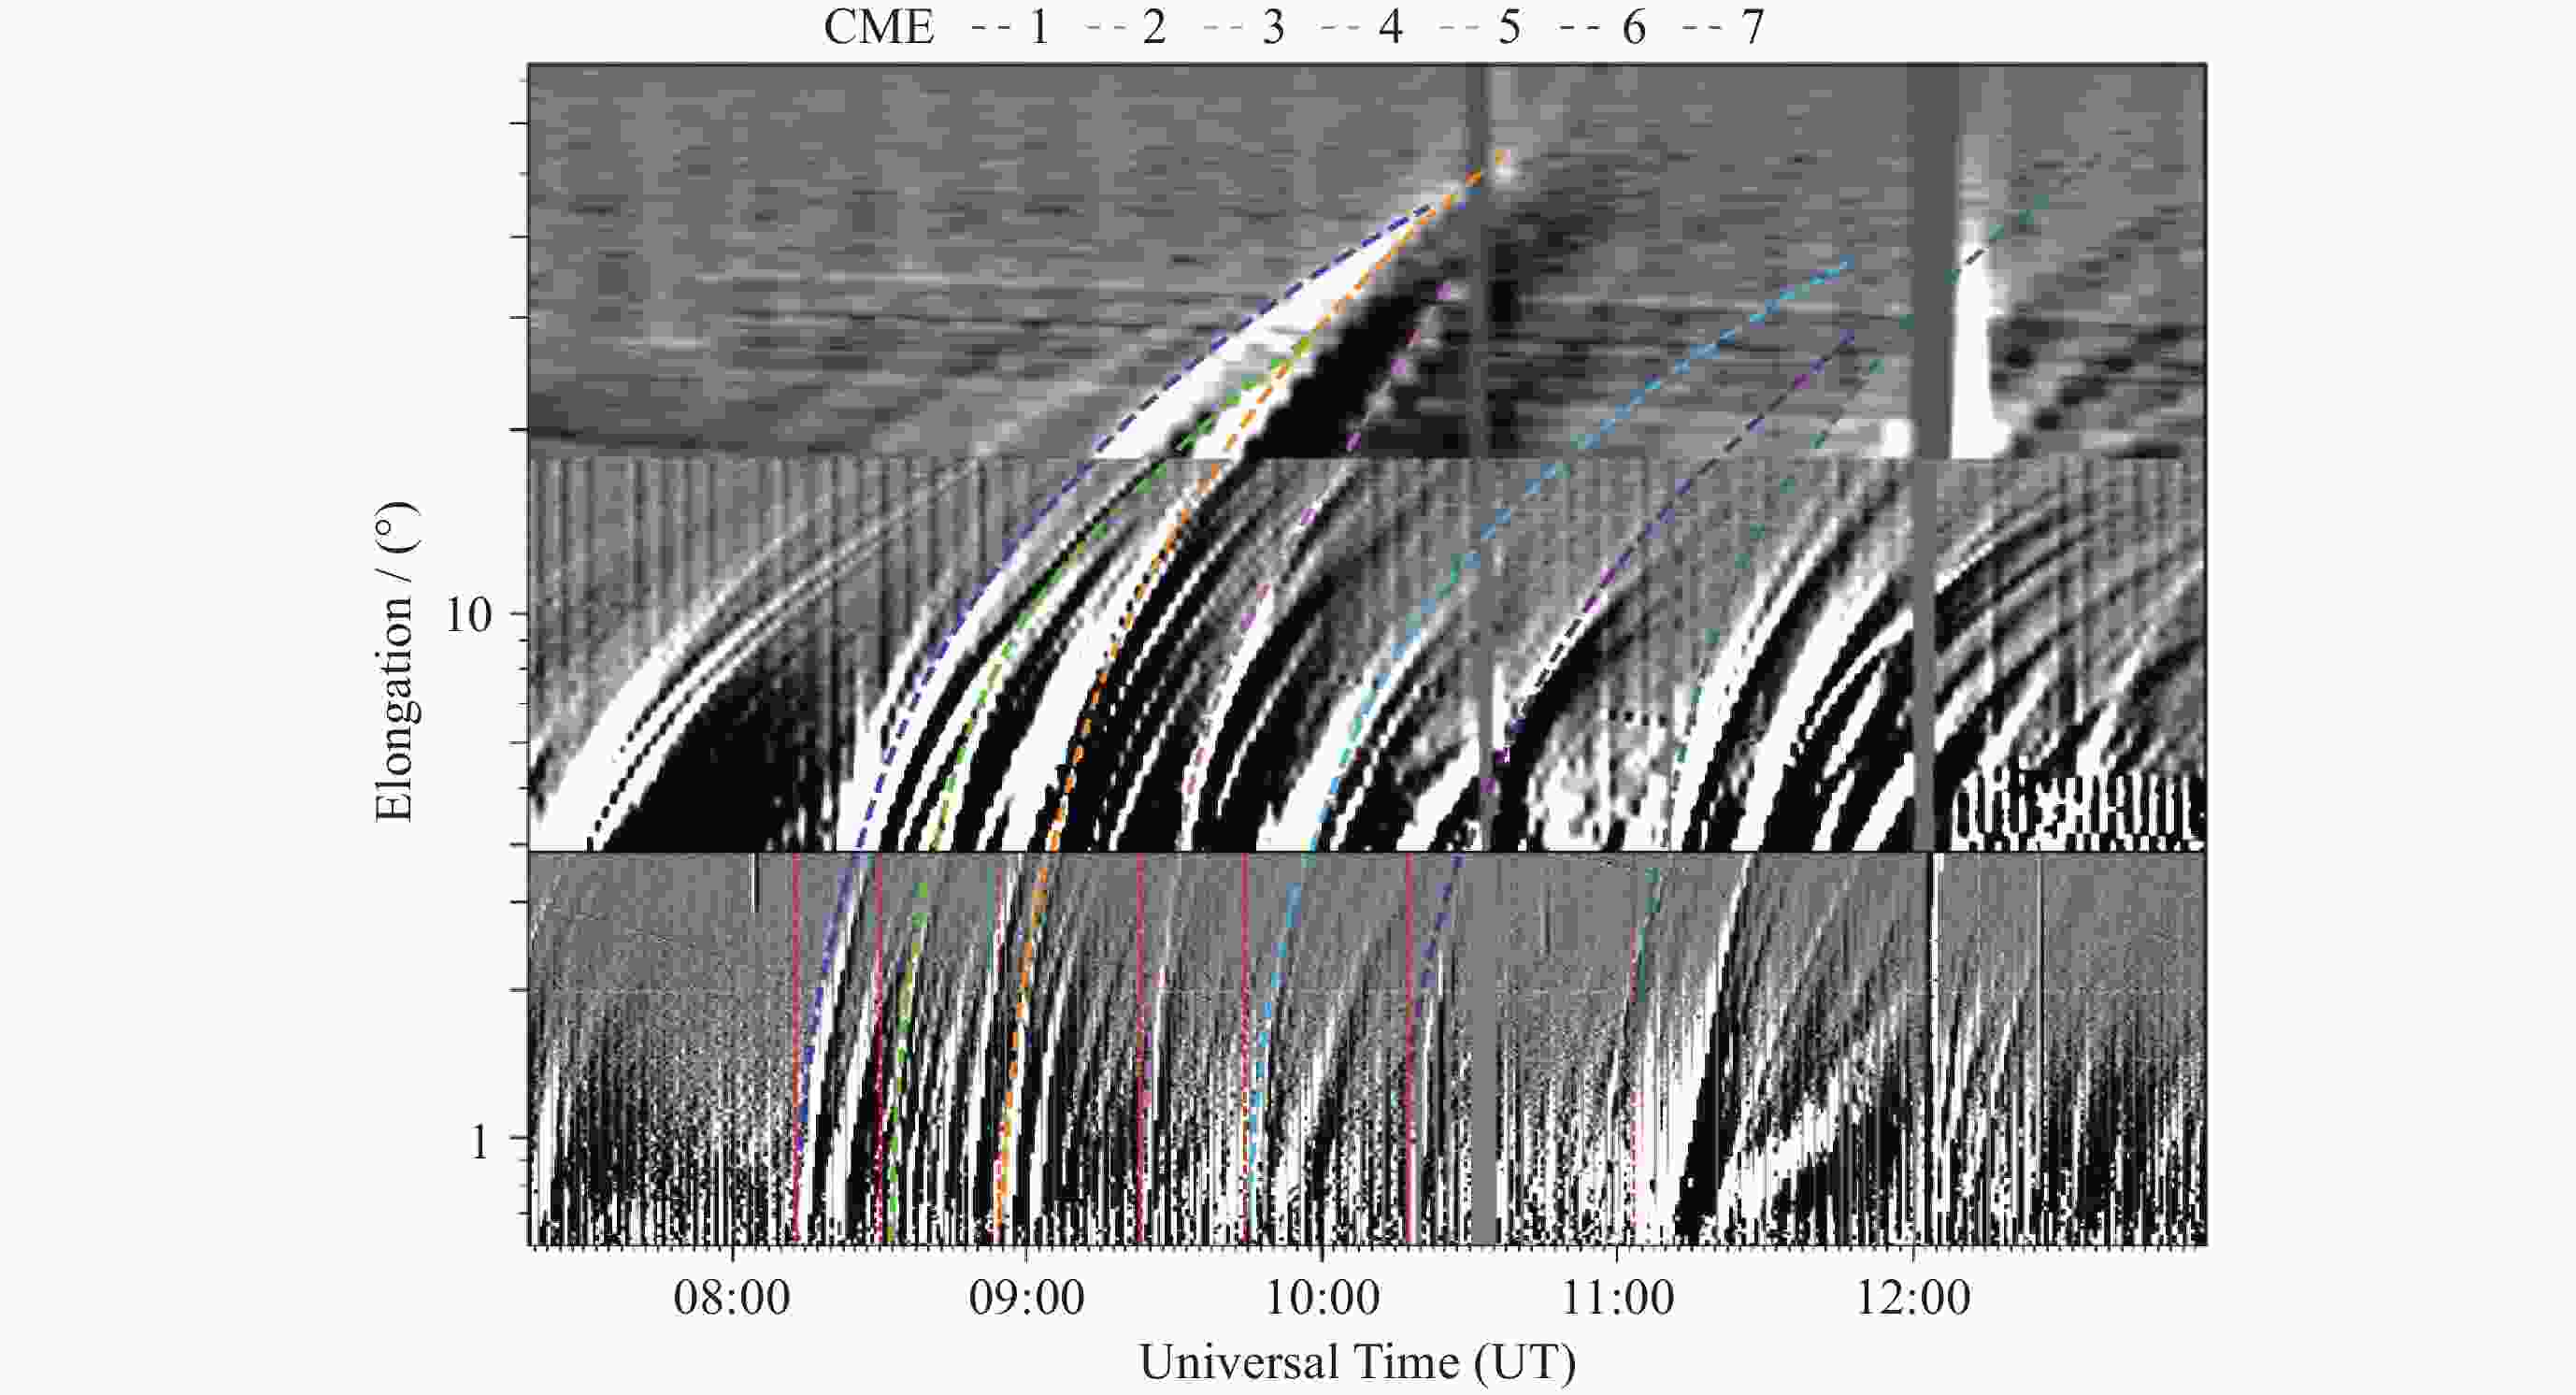
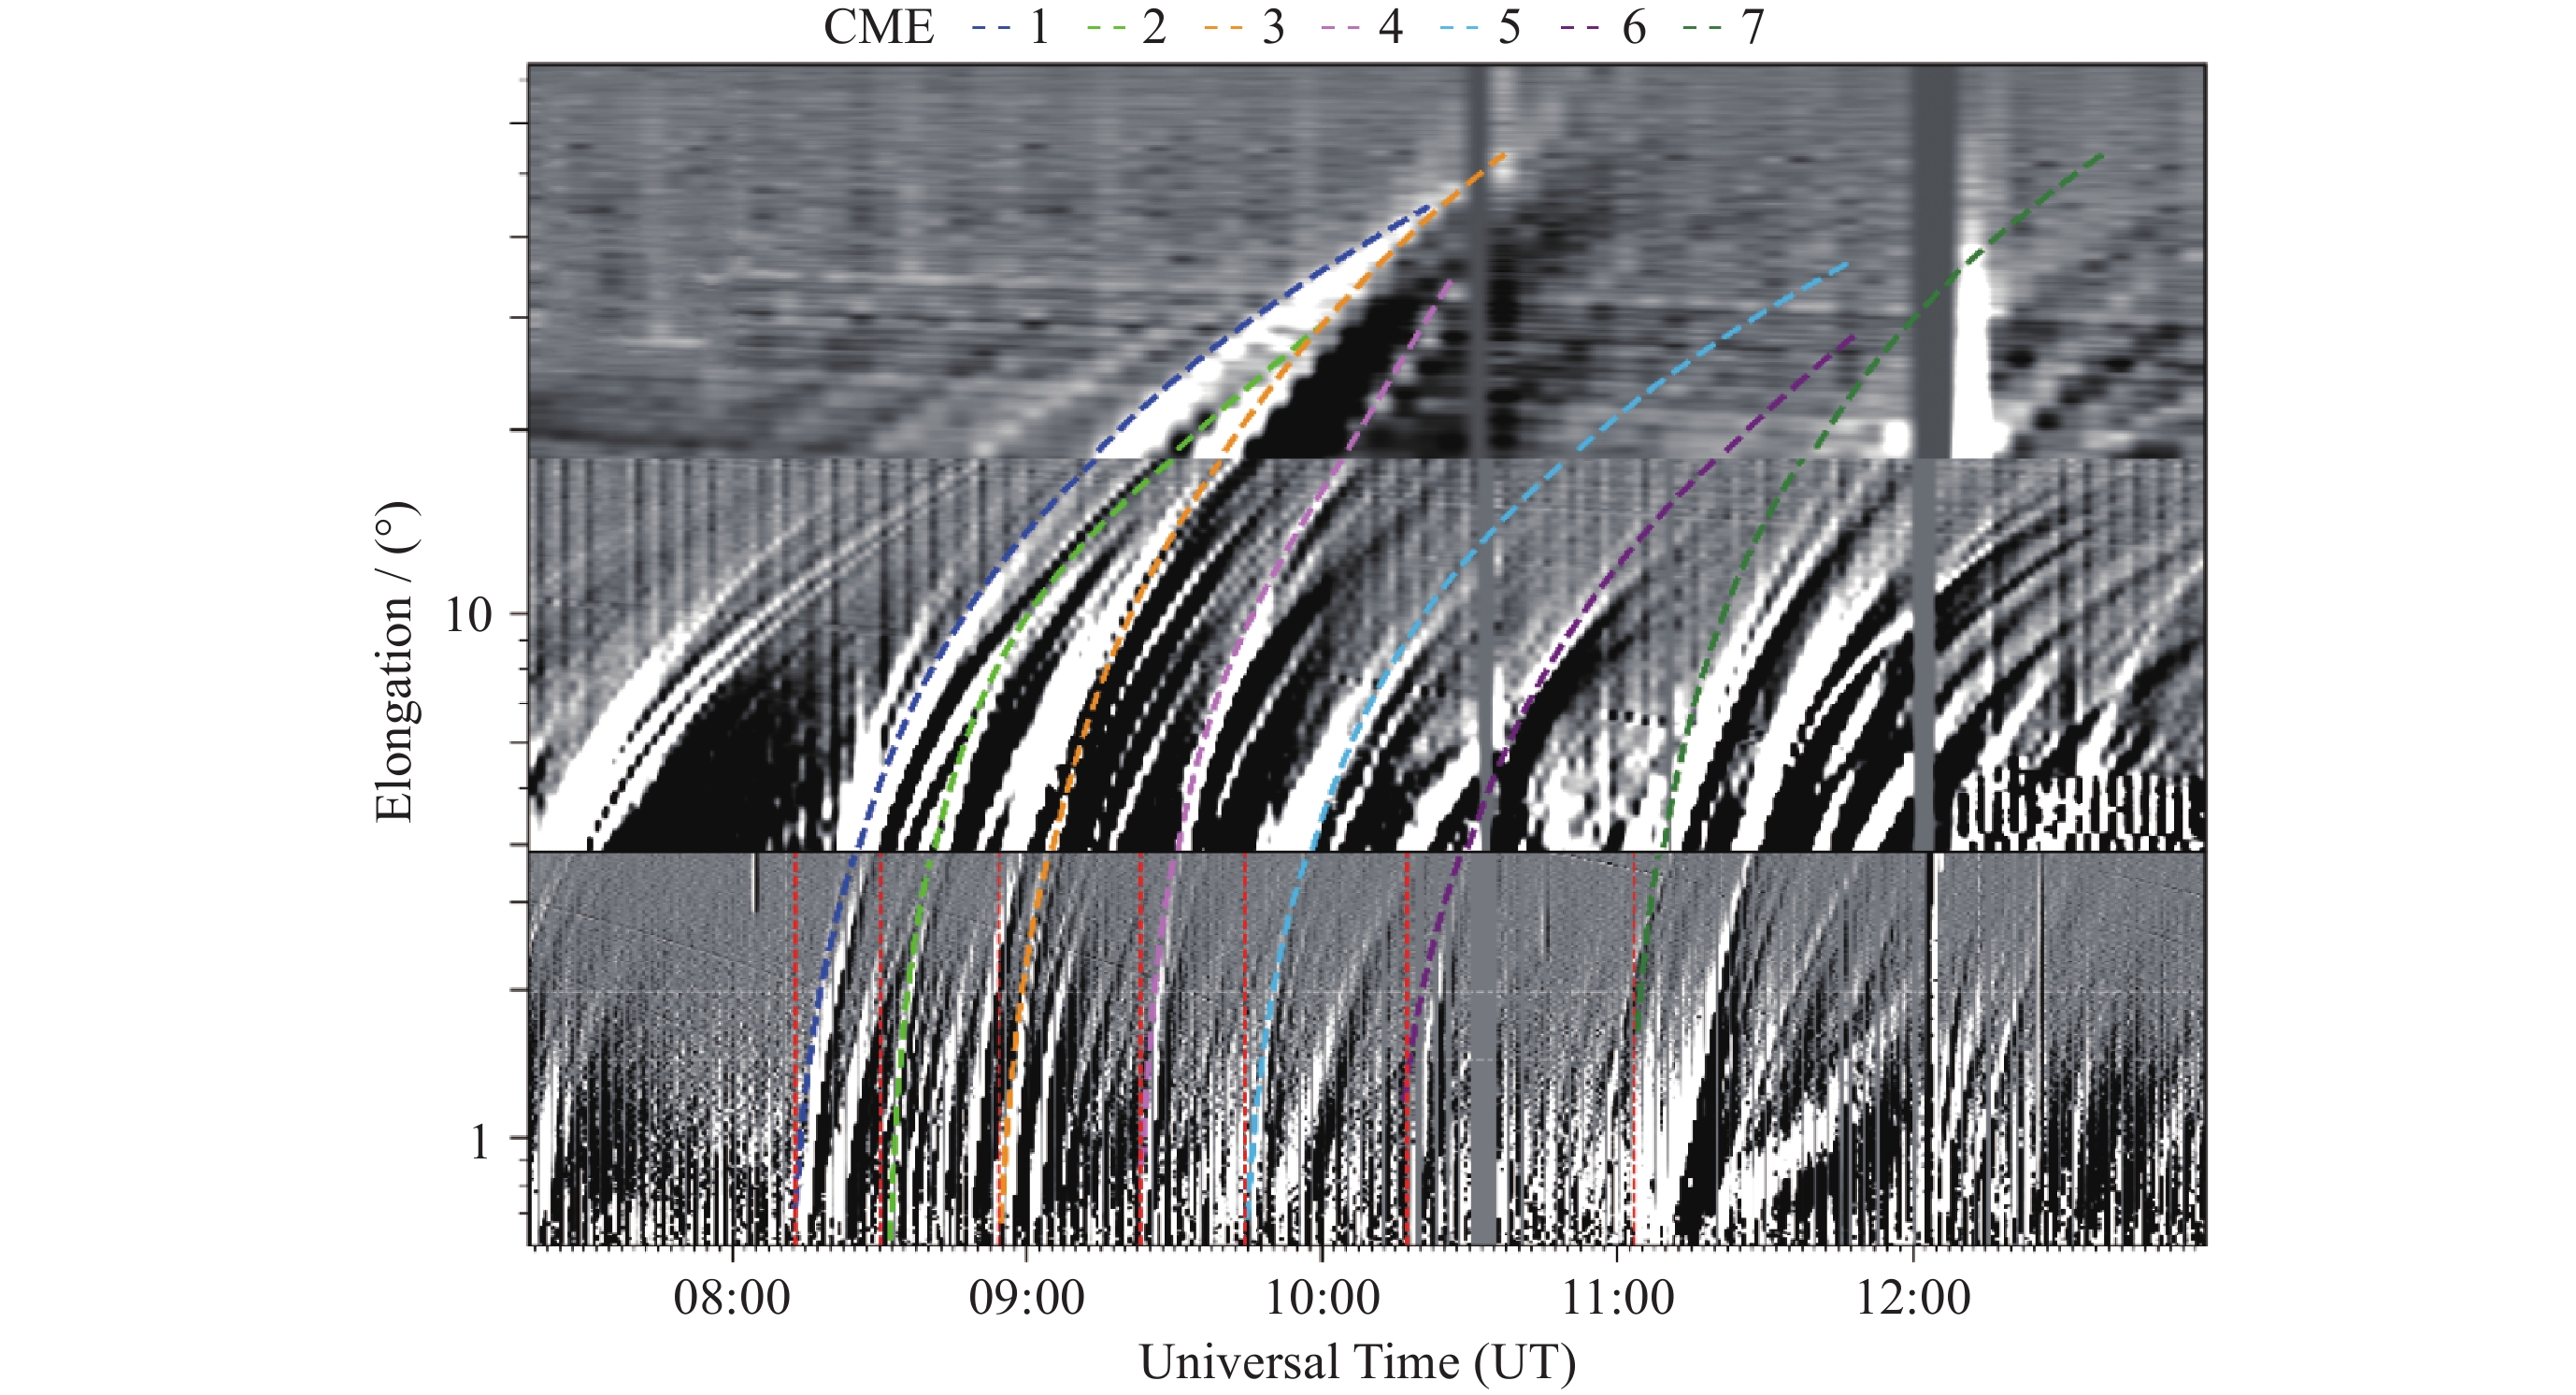
图 10 由 STEREO A/COR2, HI1 和 HI2 移动差分图像在PA = 100°附近的狭长部分构成的时间–距角 关系(J-map). 垂直红色虚线表示耀斑峰值时间, 其他颜色表示各个 CME 本体的轨迹
Figure 10. Time-lapset different diagram (J-map) composed of the narrow stripes near PA = 100° in the moving difference images of STEREO A/COR2, HI1 and HI2. The vertical red dashed lines denote peak times of flares, and other color curves represent the trajectories of CMEs’ main bodies
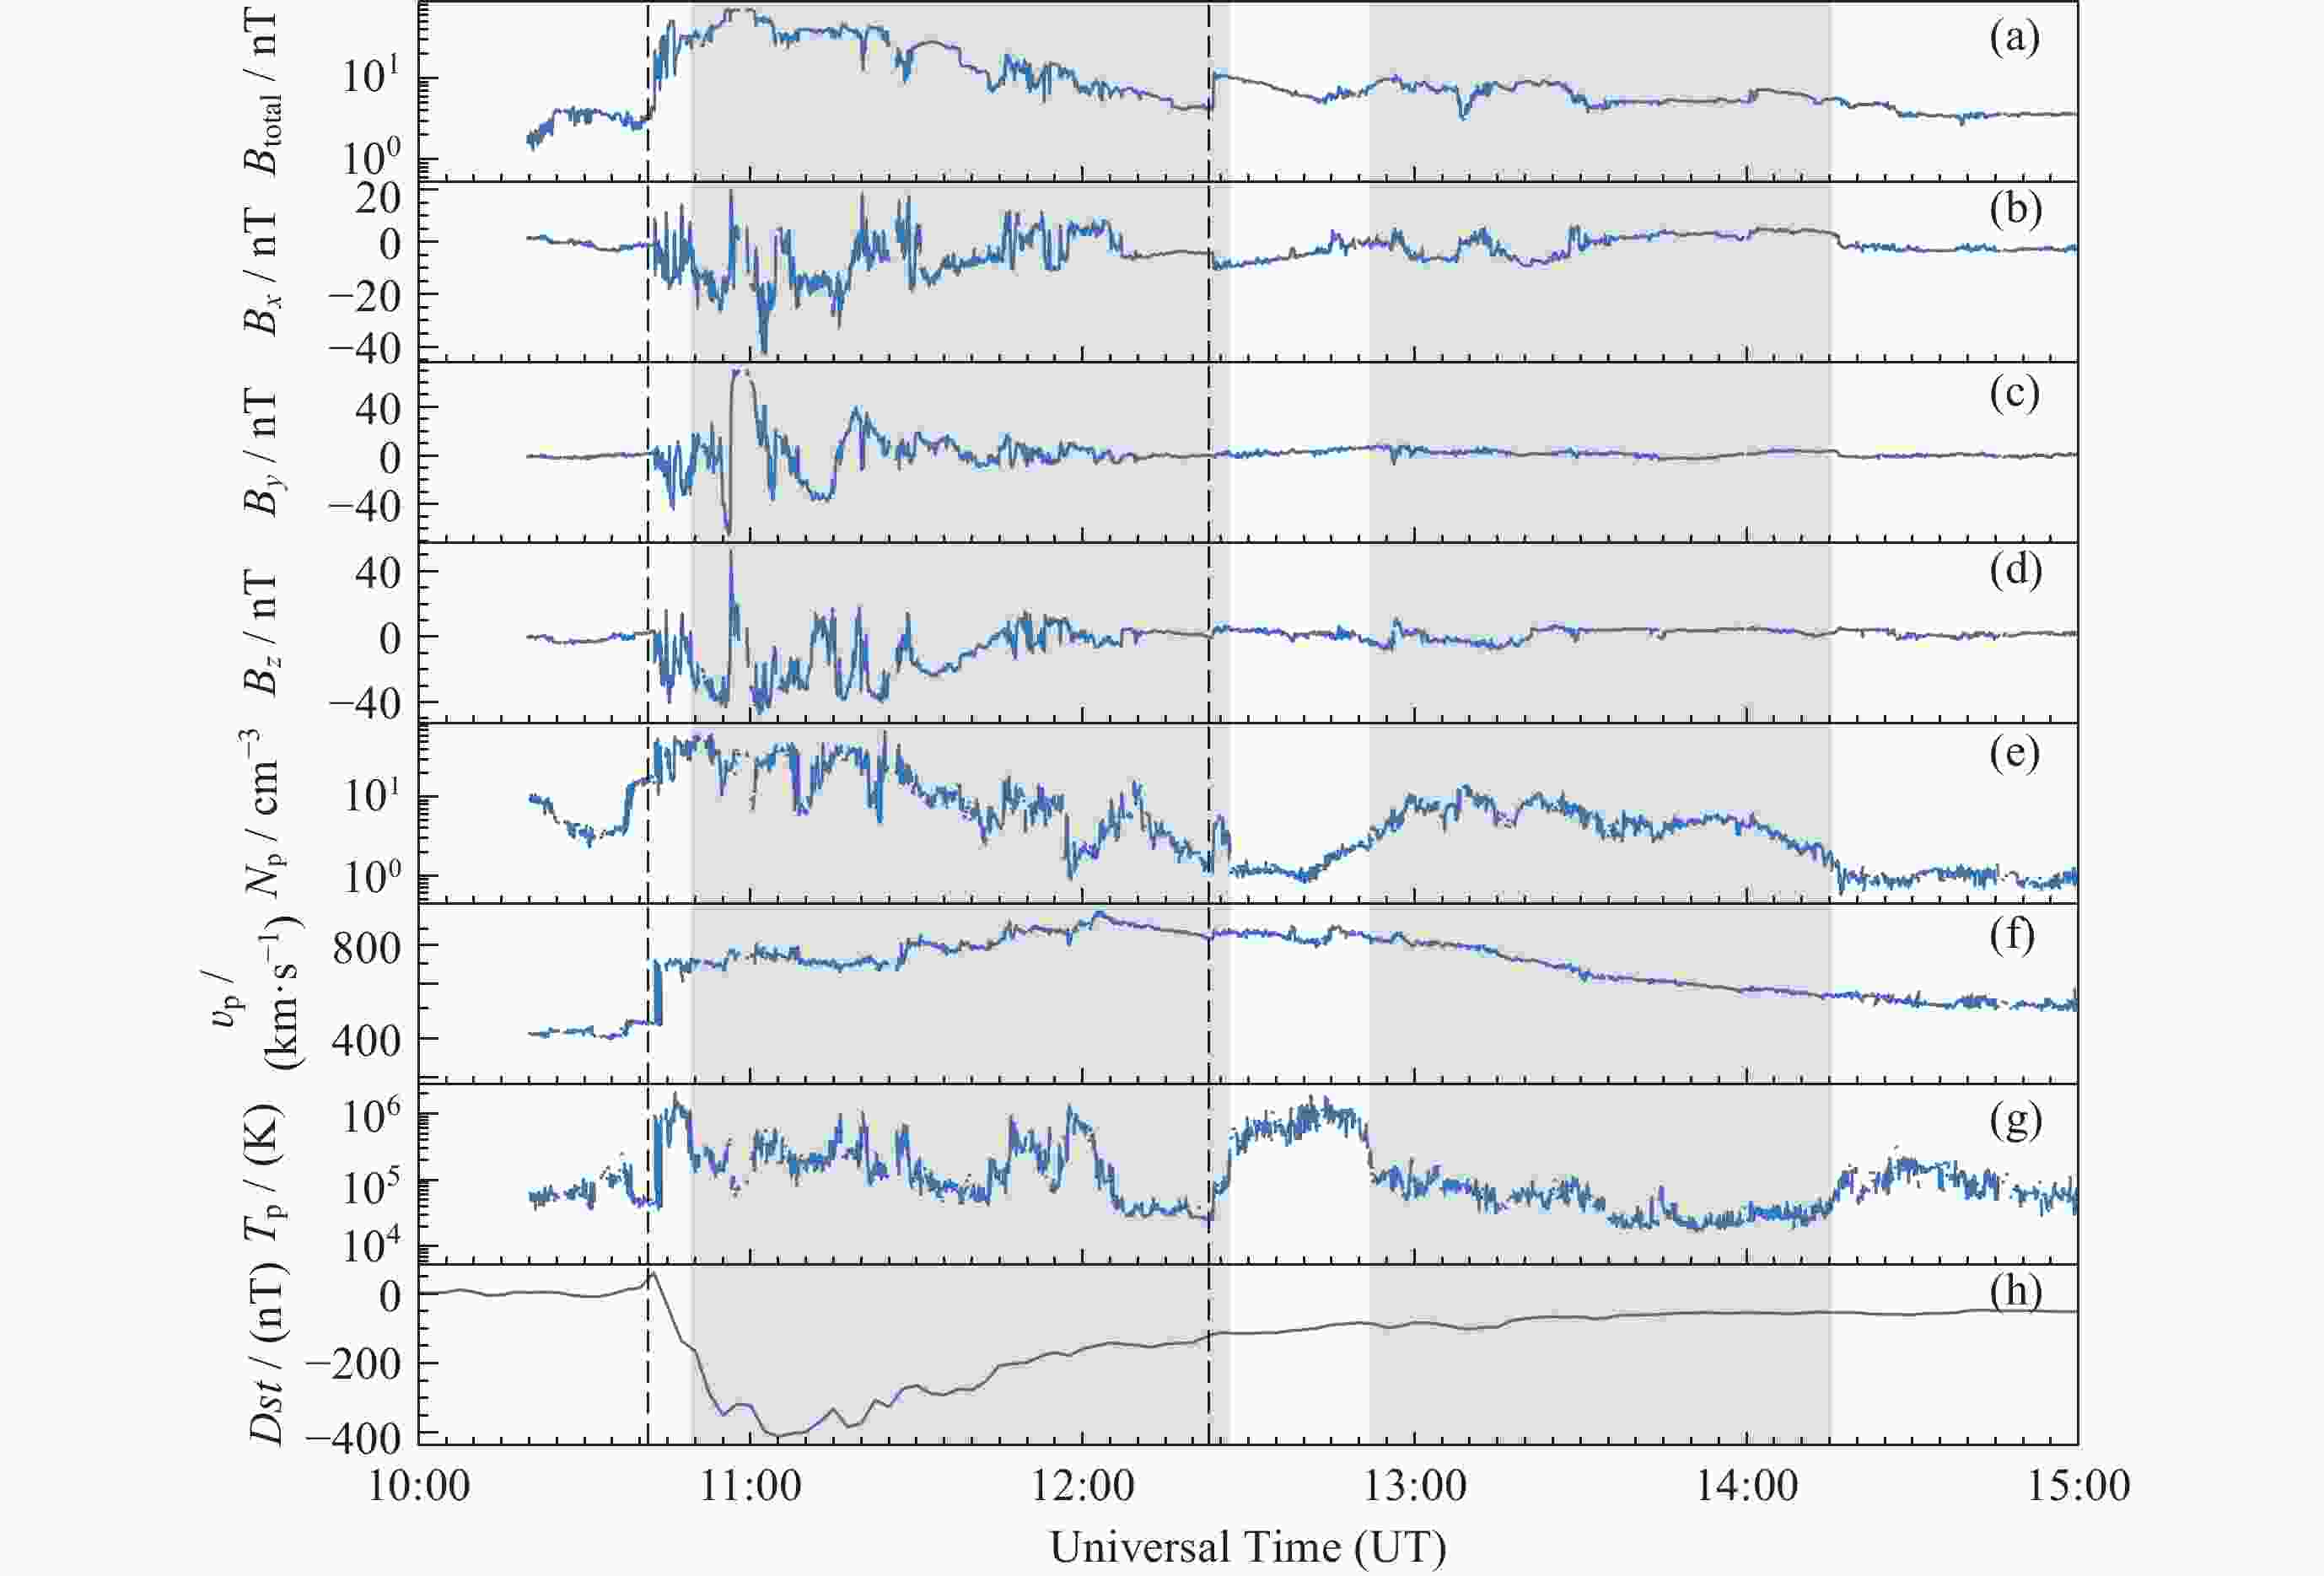
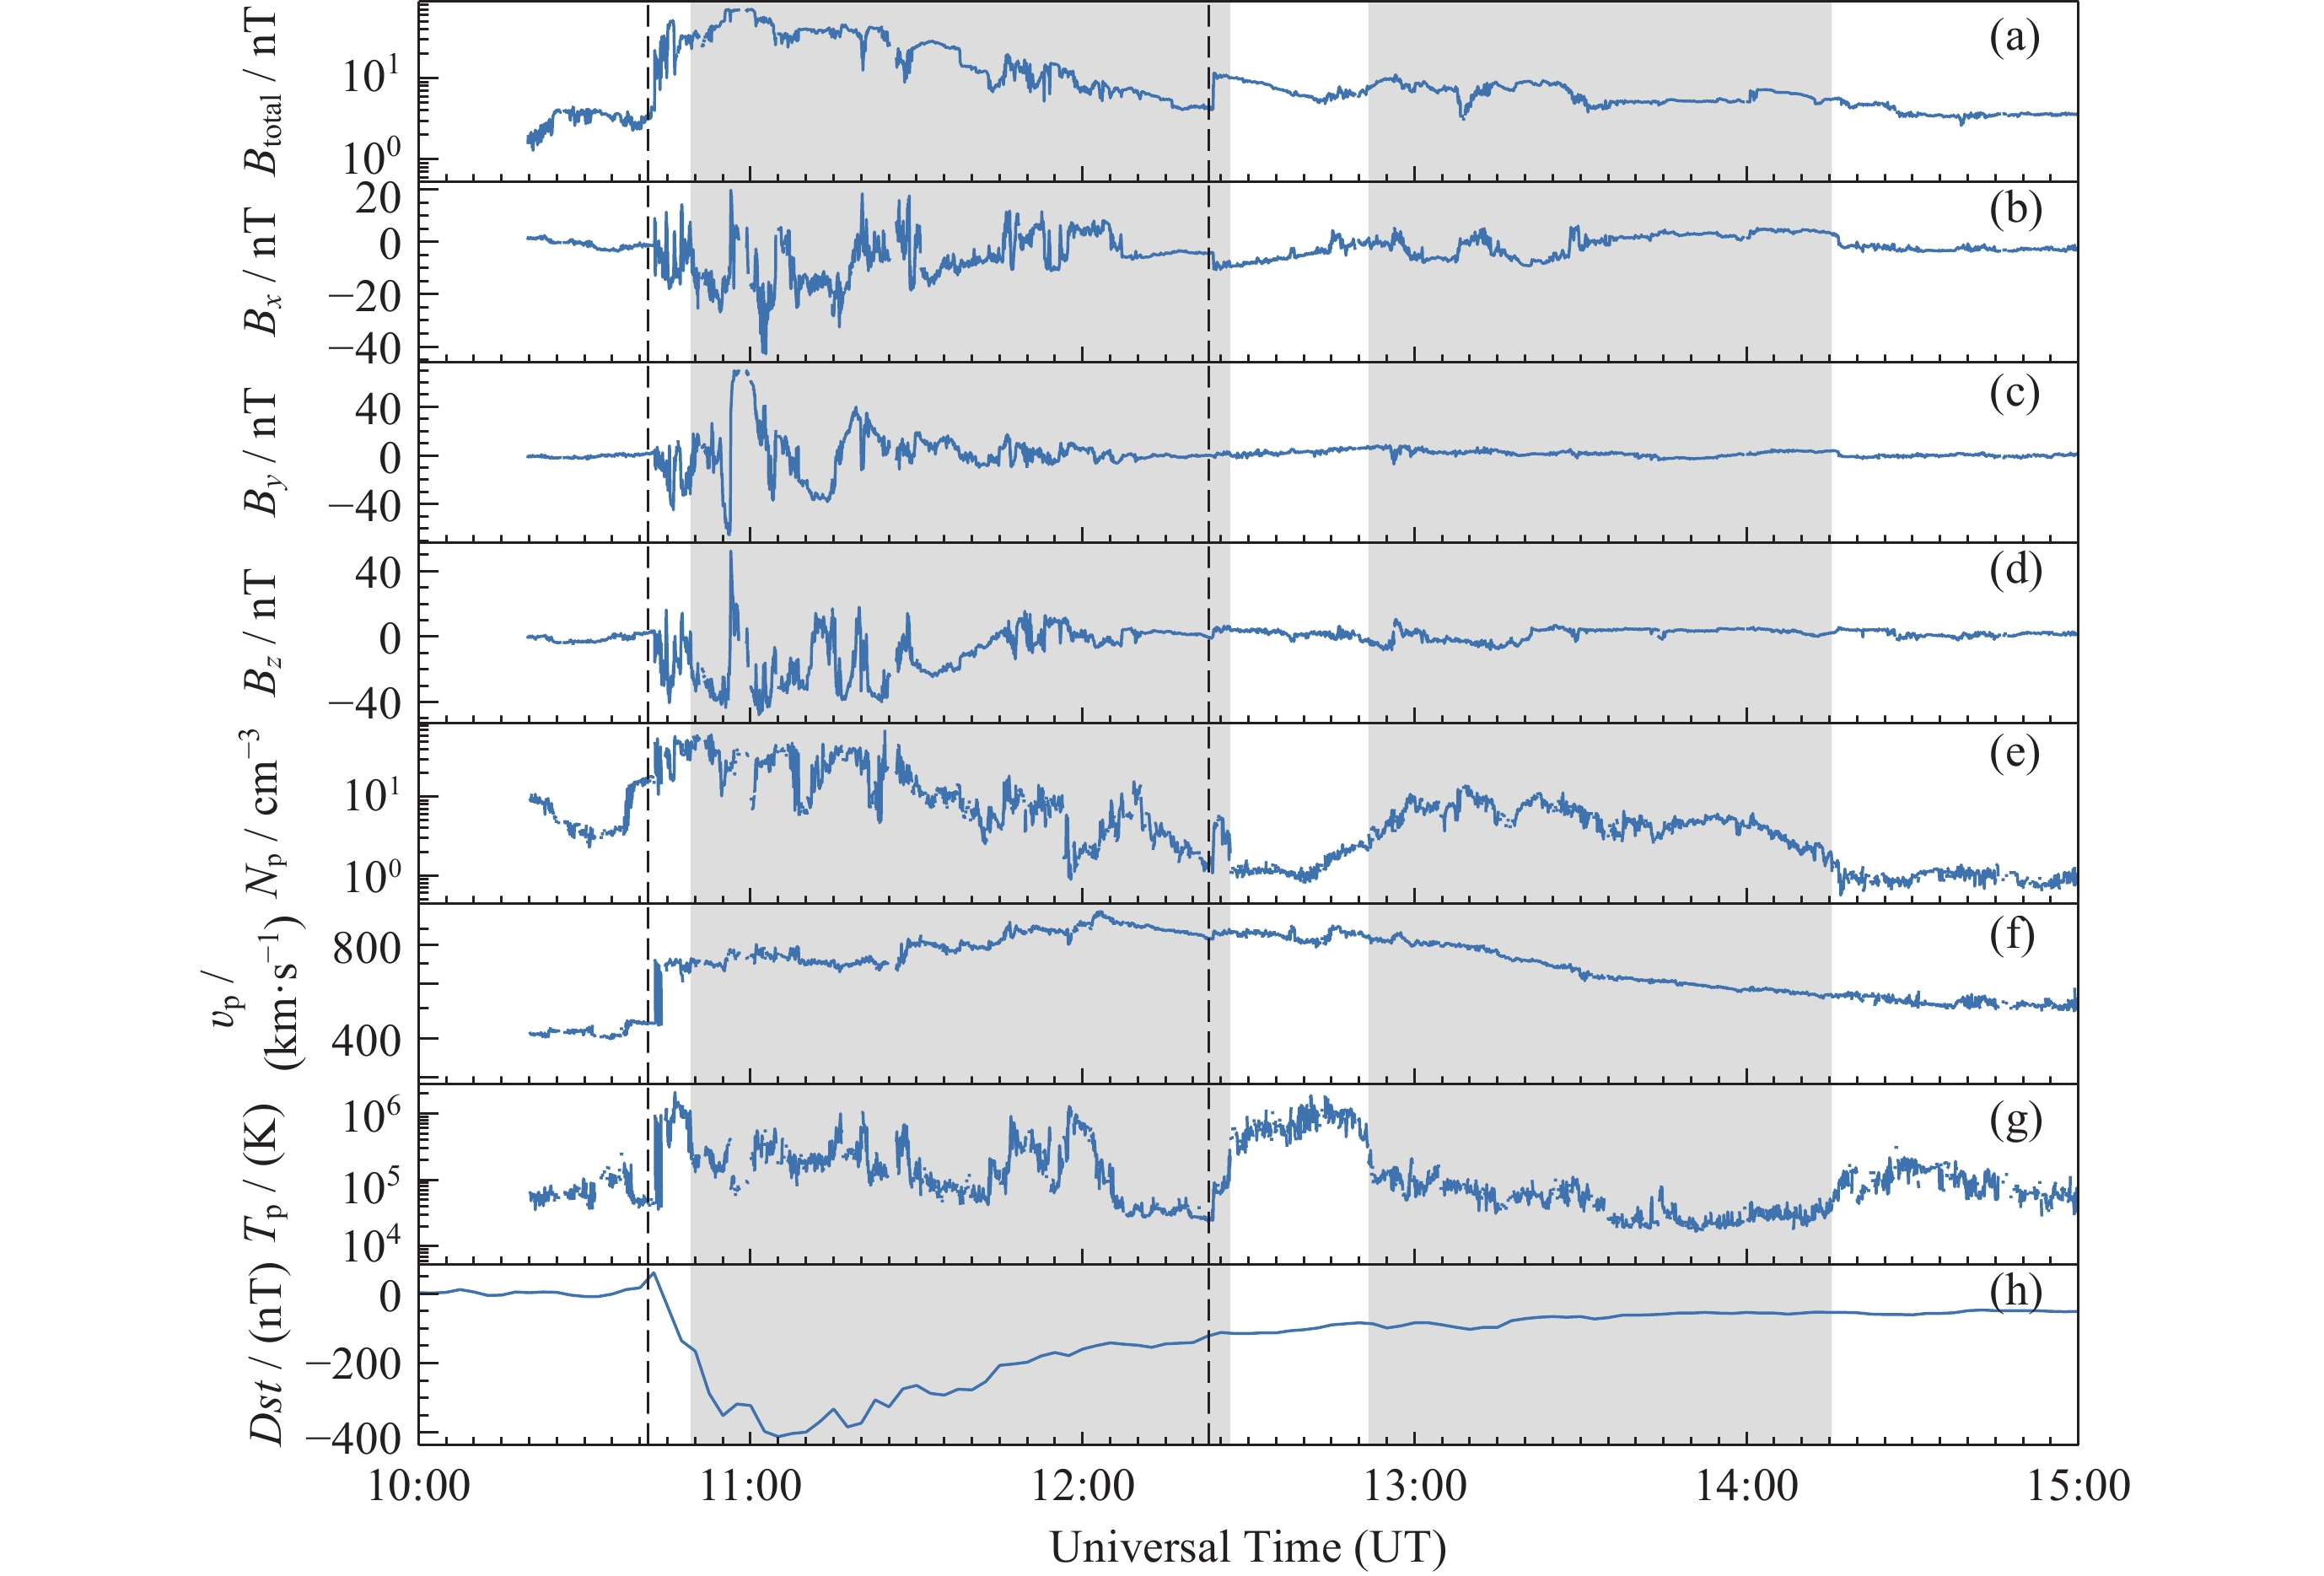
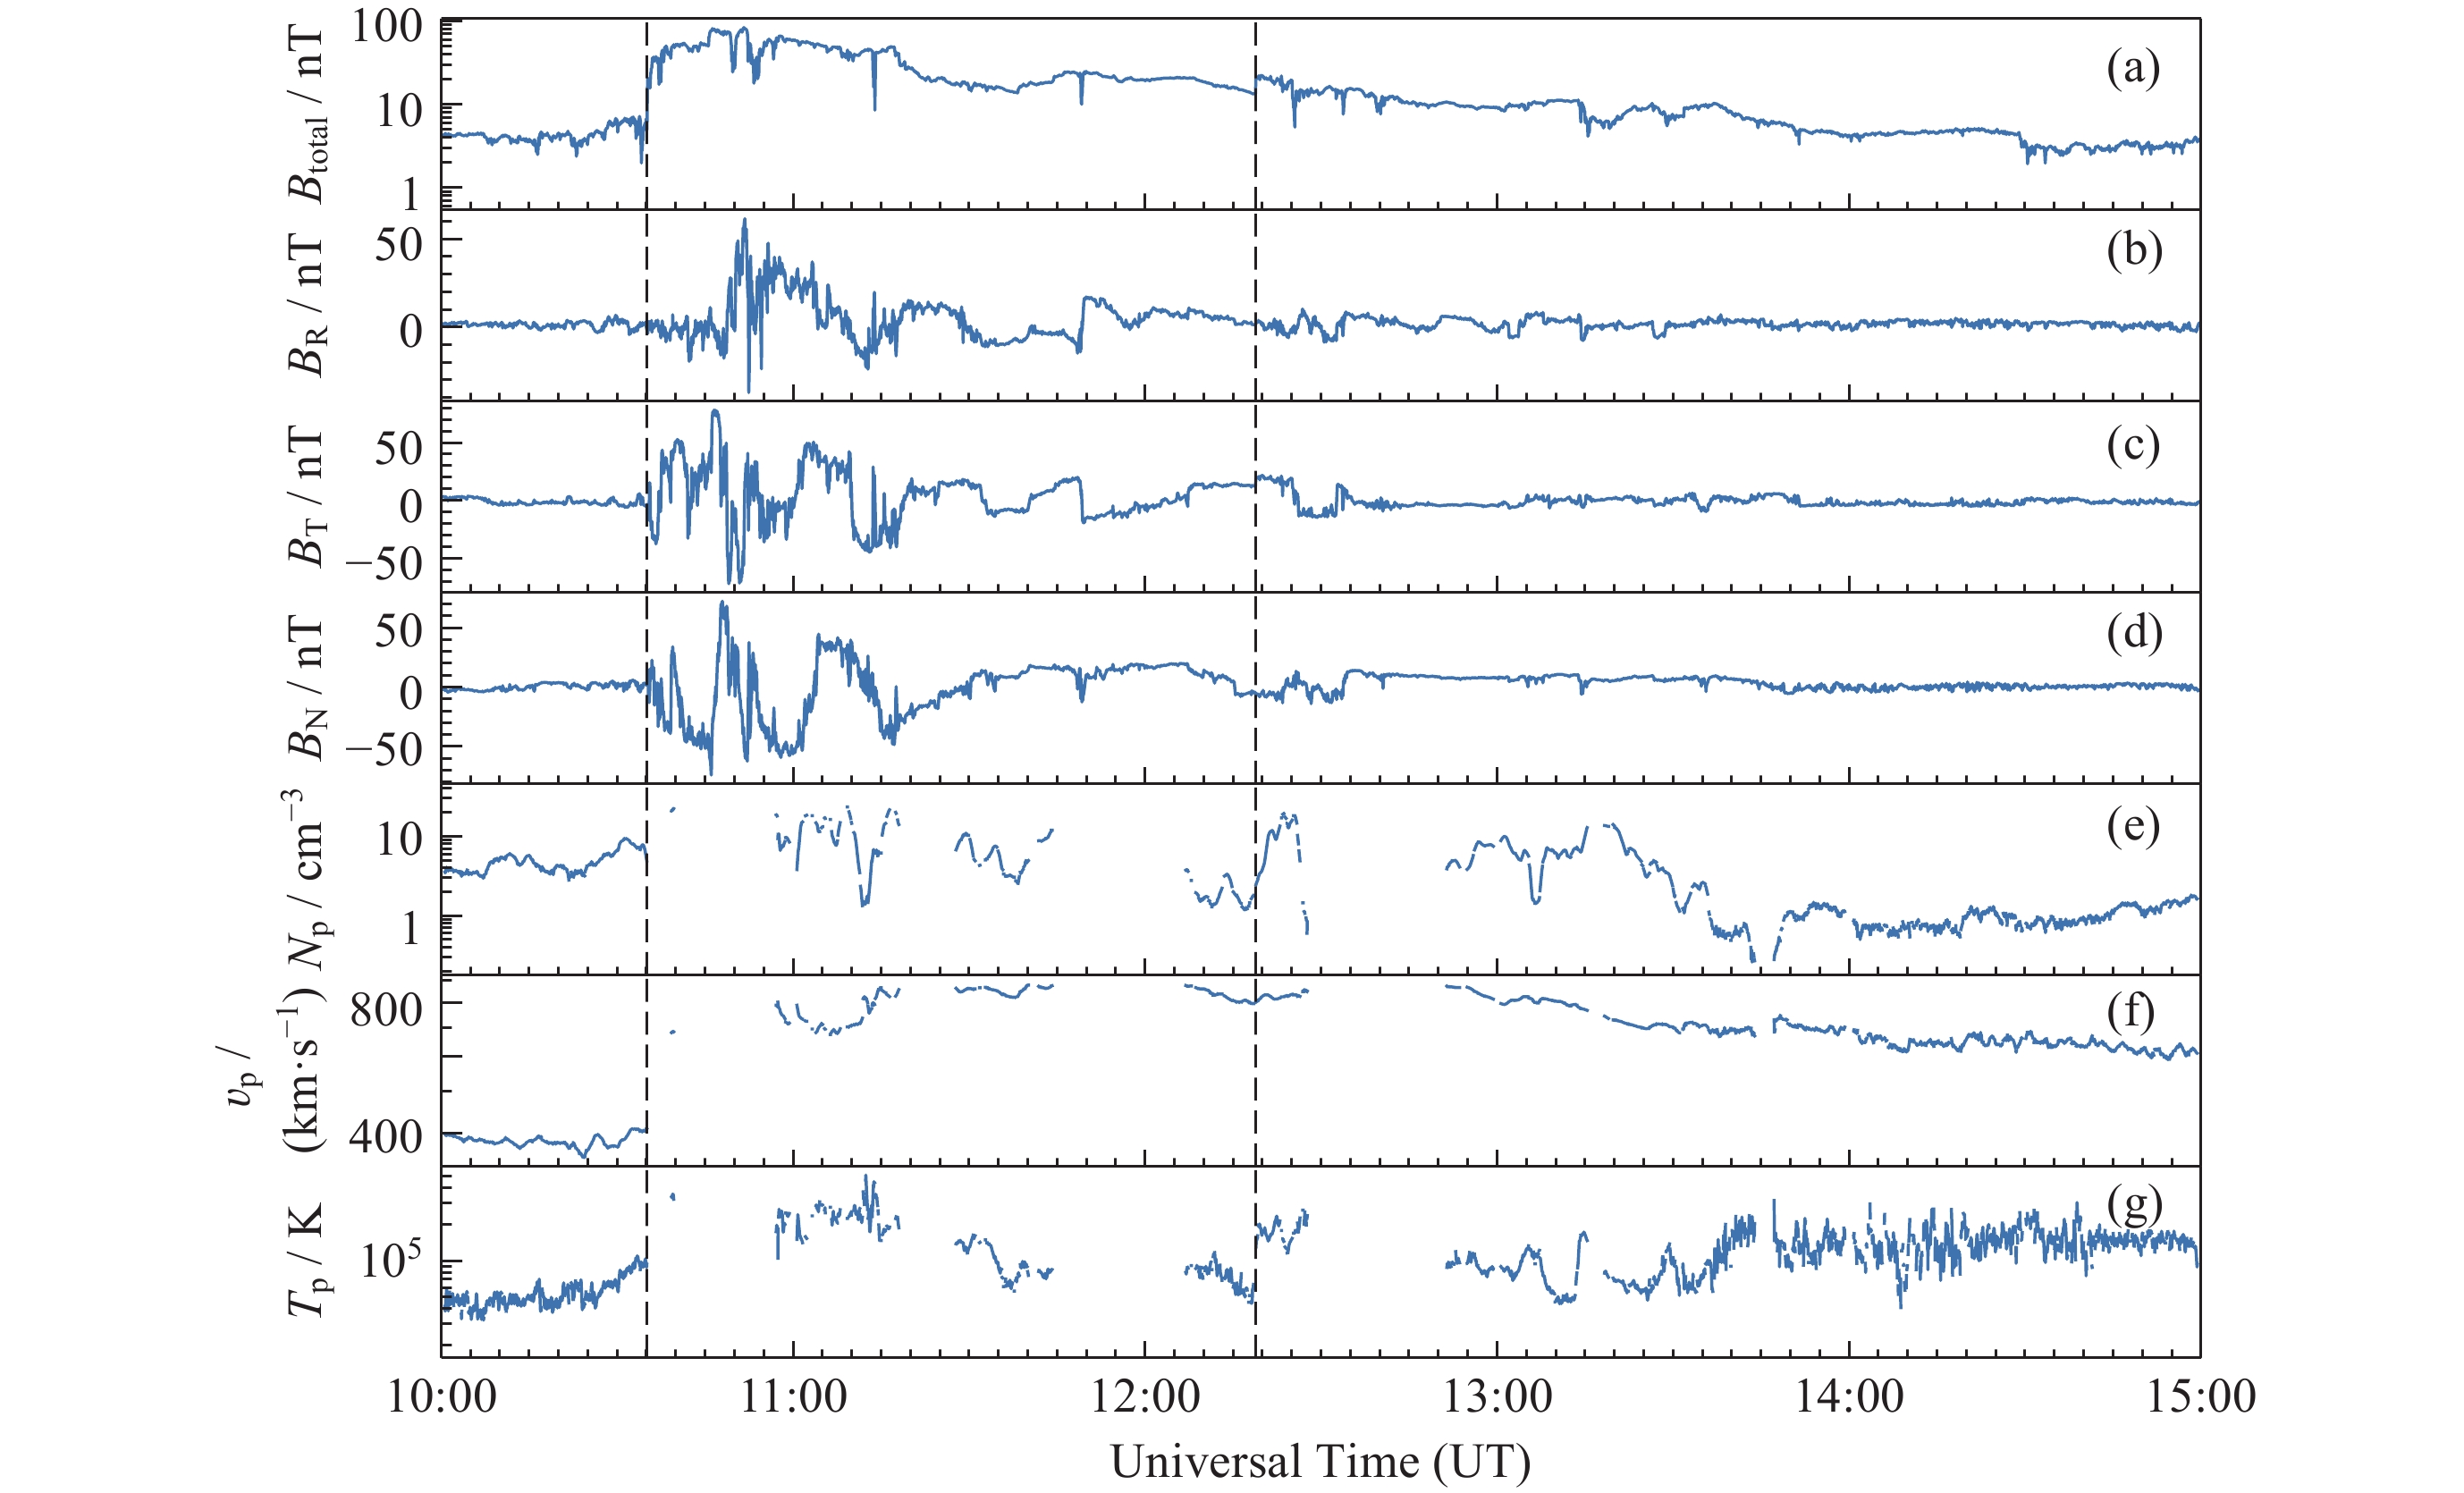
图 11 2024 年 5 月 10-14 日 WIND 卫星 1 min 分辨率的就位观测数据 (黑色垂直虚线表示激波到达时间, 灰色阴影部分表示复杂喷出物持续时间)
Figure 11. In-situ 1-minute observational data of the WIND from 10 to 14 May 2024 (The black vertical dashed lines denote the arrival times of the two shock waves, and the gray shaded areas stand for the durations of the two complex ejecta)
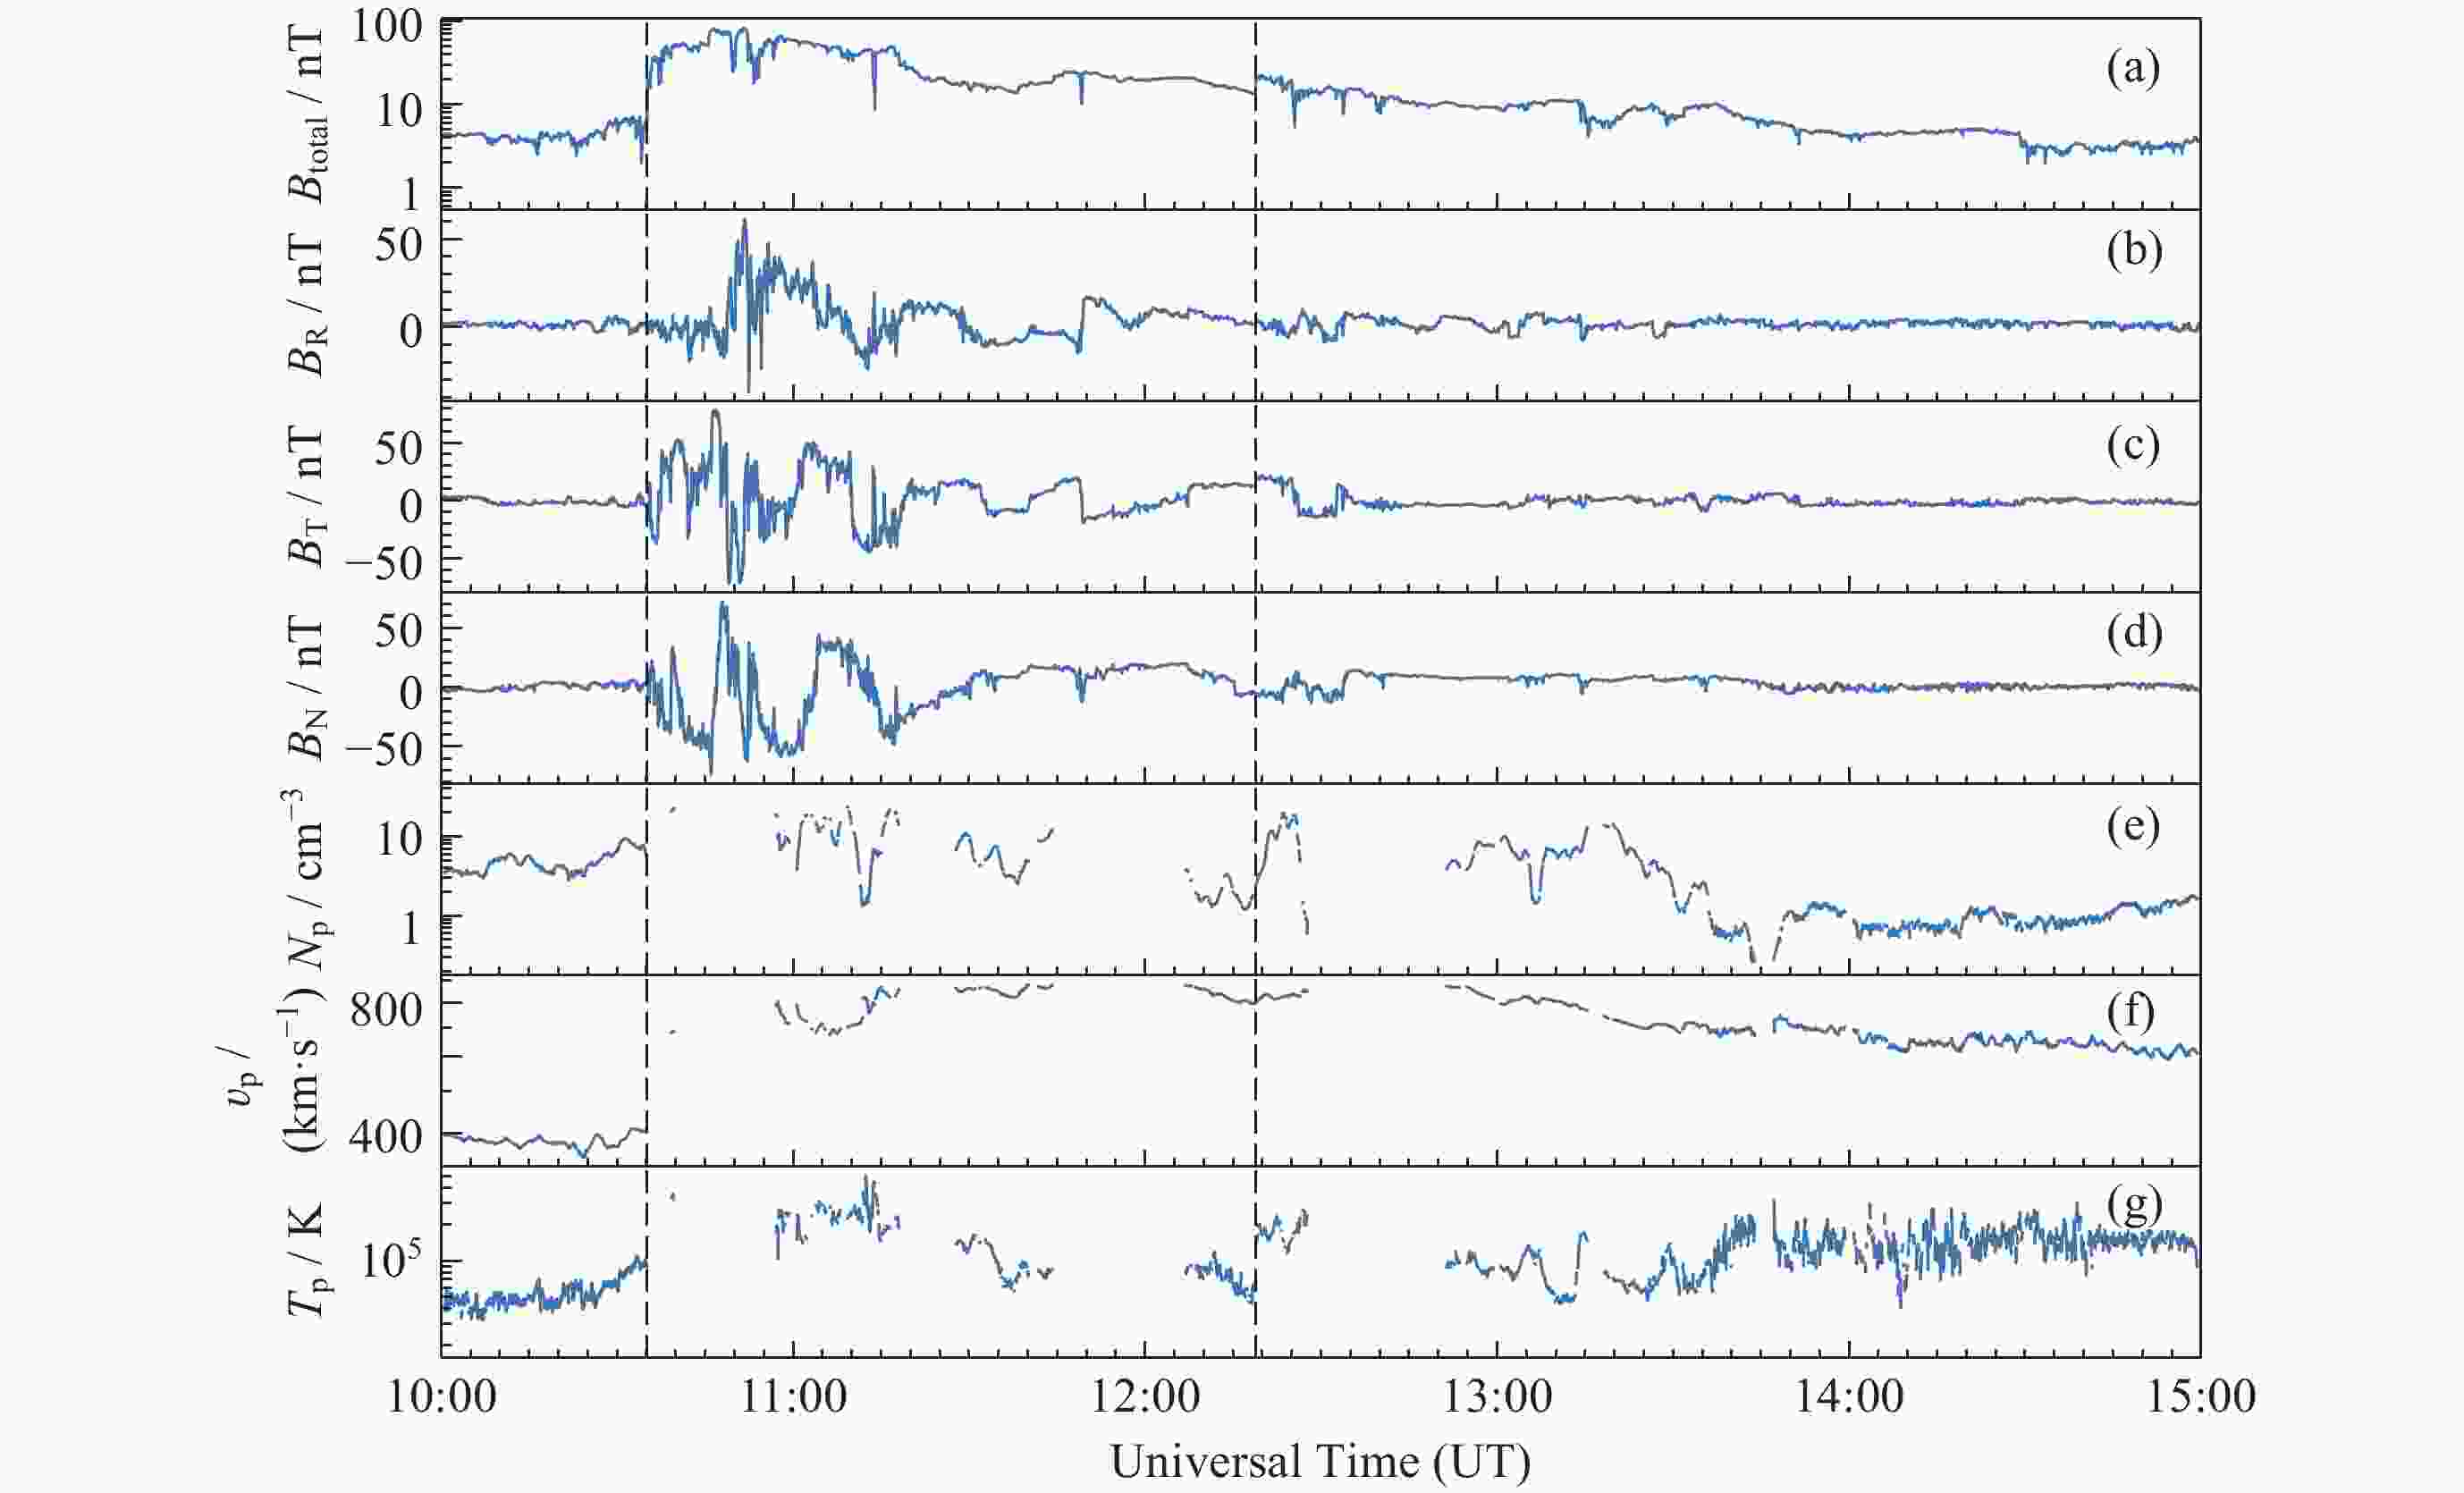
图 12 2024 年 5 月 10-14 日 STEREO A 卫星 1 min 分辨率的就位观测数据
Figure 12. In-situ 1-minute observational data of the STEREO A from 10 to 14 May 2024
表 1 2024年5月8-11日前向全晕CME及伴随耀斑的数据信息
Table 1. Parameters of the frontal full-halo CME and their associated flares from 8
4 to 115 May 2024序号 日期 太阳耀斑 日冕物质抛射 类别 时间(UT) 位置/(º) 时间(UT) 高度/Rs 线性速度
/(km·s–1)开始 峰值 结束 1 5月8日 X1.0 04:37 05:09 05:33 20 S, 11 W 05:36 2.84 530 2 5月8日 M8.5 11:26 12:04 12:17 25 S, 4 W 12:24 2.82 676.5 3 5月8日 X0.9 21:08 21:40 22:05 18 S, 18 W 22:24 3.33 952.4 4 5月9日 X2.1 08:45 09:13 09:36 19 S, 24 W 09:24 3.99 1280.4 5 5月9日 X1.0 17:23 17:44 18:01 16 S, 29 W 18:52 7.14 1024.2 6 5月10日 X3.8 06:27 06:54 07:06 14 S, 37 W 07:12 3.54 952.7 7 5月11日 X5.7 01:10 01:23 01:39 14 S, 45 W 01:36 3.88 1613.5 注 CME时间指SOHO/LASCO/C2和C3首次观测到CME的时间; 高度指SOHO/LASCO/C2和C3首次观测到CME时, CME前沿的高度; 拟合线性速度的数据所在的日心距范围为1.5~30 Rs; 表中耀斑的参数来源于GOES 18卫星的观测*, CME相关参数来源于SOHO/LASCO/C2和C3的观测**.  下载: 导出CSV
表 2 FΦ和HM方法得到的7个前向全晕CME最优拟合参数
Table 2. Optimal fitting parameters of 7 frontal full-halo CME obtained by the FΦ and HM methods
固定Φ角拟合法 (FΦ) 调和均值法 (HM) 传播方向/(°) 传播速度/(km·s–1) 抵达时间(UT) 传播方向/(°) 传播速度/(km·s–1) 抵达时间(UT) 1 48±2 530±3 05/11 10:08 40±5 539±6 05/11 09:23 2 33±14 584±27 05/11 07:44 11±15 638±39 05/11 02:41 3 41±2 776±6 05/11 02:33 30±7 797±12 05/11 01:43 4 30±10 905±63 05/11 04:41 –5±11 1124±117 05/10 20:11 5 56±4 479±3 05/13 07:15 51±4 482±3 05/13 07:04 6 43±2 524±9 05/13 11:47 18±5 584±24 05/13 03:58 7 54±6 869±24 05/12 23:39 57±1 875±3 05/12 23:42
下载: 导出CSV
-
[1] SCHWENN R, DAL LAGO A, HUTTUNEN E, et al. The association of coronal mass ejections with their effects near the Earth[J]. Annales Geophysicae, 2005, 23(3): 1033-1059 doi: 10.5194/angeo-23-1033-2005 [2] 冯学尚, 向长青, 钟鼎坤. 行星际太阳风暴的数值模拟研究[J]. 中国科学: 地球科学, 2013, 43(6): 912-933FENG Xueshang, XIANG Changqing, ZHONG Dingkun. Numerical study of interplanetary solar storms[J]. Scientia Sinica Terrae, 2013, 43(6): 912-933 [3] GOPALSWAMY N, YASHIRO S, MICHALEK G, et al. Solar source of the largest geomagnetic storm of cycle 23[J]. Geophysical Research Letters, 2005, 32(12): L12S09 doi: 10.1029/2004gl021639 [4] BOTELER D H. A 21st century view of the March 1989 magnetic storm[J]. Space Weather, 2019, 17(10): 1427-1441 doi: 10.1029/2019SW002278 [5] DOMINGO V, FLECK B, POLAND A I. The SOHO mission: an overview[J]. Solar Physics, 1995, 162(1/2): 1-37 doi: 10.1007/978-94-009-0191-9_1 [6] BRUECKNER G E, HOWARD R A, KOOMEN M J, et al. ThE Large Angle Spectroscopic Coronagraph (LASCO)[J]. Solar Physics, 1995, 162(1/2): 357-402 [7] KAISER M L, KUCERA T A, DAVILA J M, et al. The STEREO mission: an introduction[J]. Space Science Reviews, 2008, 136(1/2/3/4): 5-16 doi: 10.1007/978-0-387-09649-0_2 [8] HOWARD R A, MOSES J D, VOURLIDAS A, et al. Sun Earth Connection Coronal and Heliospheric Investigation (SECCHI)[J]. Space Science Reviews, 2008, 136(1/2/3/4): 67-115 doi: 10.1016/s0273-1177(02)00147-3 [9] LUHMANN J G, CURTIS D W, SCHROEDER P, et al. STEREO IMPACT investigation goals, measurements, and data products overview[J]. Space Science Reviews, 2008, 136(1/2/3/4): 117-184 [10] LEPPING R P, ACŨNA M H, BURLAGA L F, et al. The WIND magnetic field investigation[J]. Space Science Reviews, 1995, 71(1/2/3/4): 207-229 [11] OGILVIE K W, CHORNAY D J, FRITZENREITER R J, et al. SWE, a comprehensive plasma instrument for the WIND spacecraft[J]. Space Science Reviews, 1995, 71(1/2/3/4): 55-77 doi: 10.1007/bf00751326 [12] BENZ A O, MONSTEIN C, MEYER H, et al. A world-wide net of solar radio spectrometers: e-CALLISTO[J]. Earth, Moon, and Planet, 2009, 104(1/2/3/4): 277-285 doi: 10.1007/s11038-008-9267-6 [13] WANG Jingjing, LUO Bingxian, LIU Siqing, et al. Analysis of CME events in 2010 combined with in-situ and STEREO/HI observations[J]. Chinese Journal of Geophysics, 2013, 56(3): 746-757 [14] HU H D, LIU Y D, WANG R, et al. Multi-spacecraft observations of the coronal and interplanetary evolution of a solar eruption associated with two active regions[J]. The Astrophysical Journal, 2017, 840(2): 76 doi: 10.3847/1538-4357/aa6d54 [15] LIU Y D, HU H D, ZHAO X W, et al. A pileup of coronal mass ejections produced the largest geomagnetic storm in two decades[J]. The Astrophysical Journal Letters, 2024, 974(1): L8 doi: 10.3847/2041-8213/ad7ba4 [16] LUGAZ N. Accuracy and limitations of Fitting and Stereoscopic Methods to determine the direction of coronal mass ejections from Heliospheric Imagers observations[J]. Solar Physics, 2010, 267(2): 411-429 doi: 10.1007/s11207-010-9654-9 [17] LIU Y, THERNISIEN A, LUHMANN J G, et al. Reconstructing coronal mass ejections with Coordinated Imaging and in situ observations: global structure, kinematics, and implications for space weather forecasting[J]. The Astrophysical Journal, 2010, 722(2): 1762-1777 doi: 10.1088/0004-637X/722/2/1762 [18] ZHANG J, DERE K P, HOWARD R A, et al. On the temporal relationship between coronal mass ejections and flares[J]. The Astrophysical Journal, 2001, 559(1): 452-462 doi: 10.1086/322405 [19] ZHOU G P, WANG J X, CAO Z L. Correlation between halo coronal mass ejections and solar surface activity[J]. Astronomy & Astrophysics, 2003, 397(3): 1057-1067 doi: 10.1051/0004-6361:20021463 [20] YASHIRO S, MICHALEK G, AKIYAMA S, et al. Spatial relationship between solar flares and coronal mass ejections[J]. The Astrophysical Journal, 2008, 673(2): 1174-1180 doi: 10.1086/524927 [21] Li R. Predicting the Arrival Time of an Interplanetary Shock Based on the DART Observations [D]. Beijing: University of Chinese Academy of Sciences (National Space Science Center, Chinese Academy of Sciences), 2024 [22] NEWKIRK JR G. The solar corona in active regions and the thermal origin of the slowly varying component of solar radio radiation[J]. The Astrophysical Journal, 1961, 133: 983 doi: 10.1016/0038-092x(64)90060-x [23] THOMPSON W T. Coordinate systems for solar image data[J]. Astronomy & Astrophysics, 2006, 449(2): 791-803 doi: 10.1051/0004-6361:20054262 [24] SHEELEY JR N R, WALTERS J H, WANG Y M, et al. Continuous tracking of coronal outflows: two kinds of coronal mass ejections[J]. Journal of Geophysical Research: Space Physics, 1999, 104(A11): 24739-24767 doi: 10.1029/1999JA900308 [25] LIU Y, DAVIES J A, LUHMANN J G, et al. Geometric triangulation of imaging observations to track coronal mass ejections continuously out to 1 AU[J]. The Astrophysical Journal Letters, 2010, 710(1): L82-L87 doi: 10.1088/2041-8205/710/1/L82 [26] SHEELEY JR N R, HERBST A D, PALATCHI C A, et al. Heliospheric images of the solar wind at Earth[J]. The Astrophysical Journal, 2008, 675(1): 853-862 doi: 10.1086/526422 [27] DAVIES J A, HARRISON R A, ROUILLARD A P, et al. A synoptic view of solar transient evolution in the inner heliosphere using the Heliospheric Imagers on STEREO[J]. Geophysical Research Letters, 2009, 36(2): L02102 doi: 10.1029/2008gl036182 [28] WANG R, LIU Y D, ZHAO X W, et al. Unveiling key factors in solar eruptions leading to the solar superstorm in 2024 May[J]. Astronomy & Astrophysics, 2024, 692: A112 doi: 10.1051/0004-6361/202452008 [29] World Data Center for Geomagnetism, NOSE K M, IYEMORI T, et al. Geomagnetic Dst index[EB/OL]. (2015-12-30)[2024-09-14]. https://doi.org/10.17593/14515-74000 -
-

 下载:
下载:


计量
- 文章访问数: 806
- HTML全文浏览量: 383
- PDF下载量: 163
-
被引次数:
0(来源:Crossref)
0(来源:其他)

